# Plot over line gives NaN
**URL:** https://discourse.paraview.org/t/plot-over-line-gives-nan/2207
**Category:** ParaView Support
**Created:** [July 12, 2019, 3:19pm UTC](https://discourse.paraview.org/t/plot-over-line-gives-nan/2207 "2019-07-12T15:19:46Z")
**Posts on this page:** 17
**Page:** 1
### Author:  [@Rem](https://discourse.paraview.org/u/Rem)
#### Post date: [July 12, 2019, 3:19pm UTC](https://discourse.paraview.org/t/plot-over-line-gives-nan/2207/1 "2019-07-12T15:19:47Z")
Hi all!
I’m experiencing a little issue here when plotting over line. When I try to visualise the attached data in 2D everything works well. But if I want to plot, say on the x=0 axis, some values don’t appear (wholes in the line) whereas they appear on the 2D visualisation.
Any idea ?
Thanks guys!
Rem
[data.rar](https://discourse.paraview.org/uploads/default/original/2X/7/7efaf8802e7aa94bb0f7a387d6ee02892c010127.rar) (3.4 MB)
---
### Author:  [@mwestphal](https://discourse.paraview.org/u/mwestphal)
#### Post date: [July 15, 2019, 9:21am UTC](https://discourse.paraview.org/t/plot-over-line-gives-nan/2207/2 "2019-07-15T09:21:54Z")
It is working great here. Can you provide a step by step to reproduce the issue ?
---
### Author:  [@Rem](https://discourse.paraview.org/u/Rem)
#### Post date: [July 15, 2019, 9:28am UTC](https://discourse.paraview.org/t/plot-over-line-gives-nan/2207/3 "2019-07-15T09:28:49Z")
Okay:
1- plot over line
2- set the line on the y axis
3- set the x coordinates of both ends to 0
4- apply
On the new window you should see a plot.
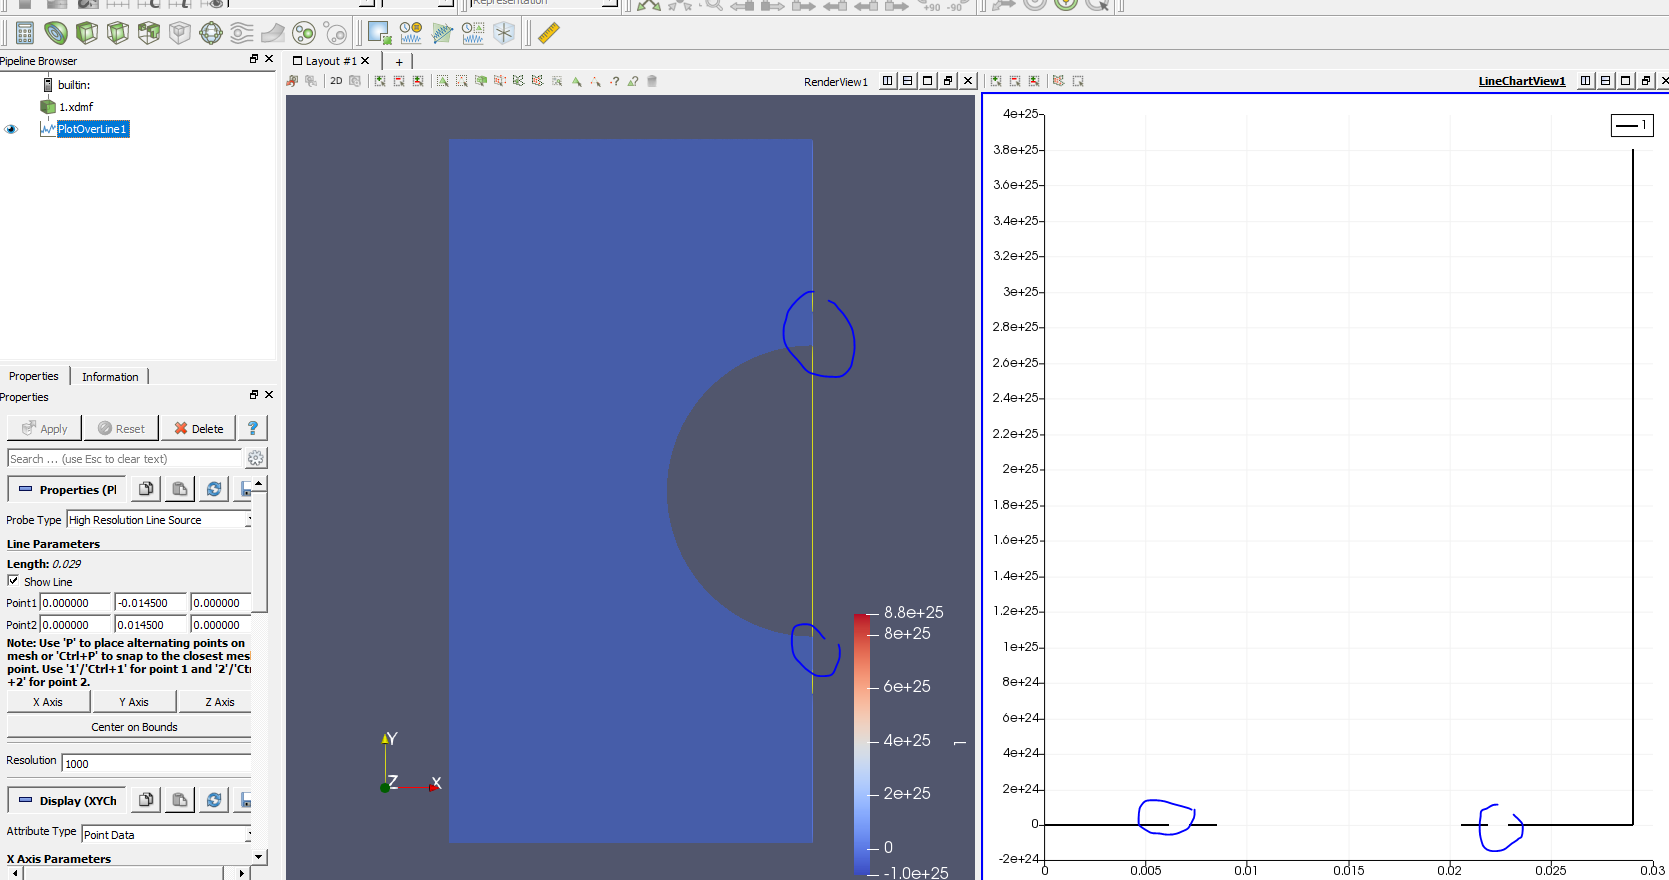
Now see that the line has 2 holes (that shouldn’t be there…)
5- export the data to .csv and you should see NaN values
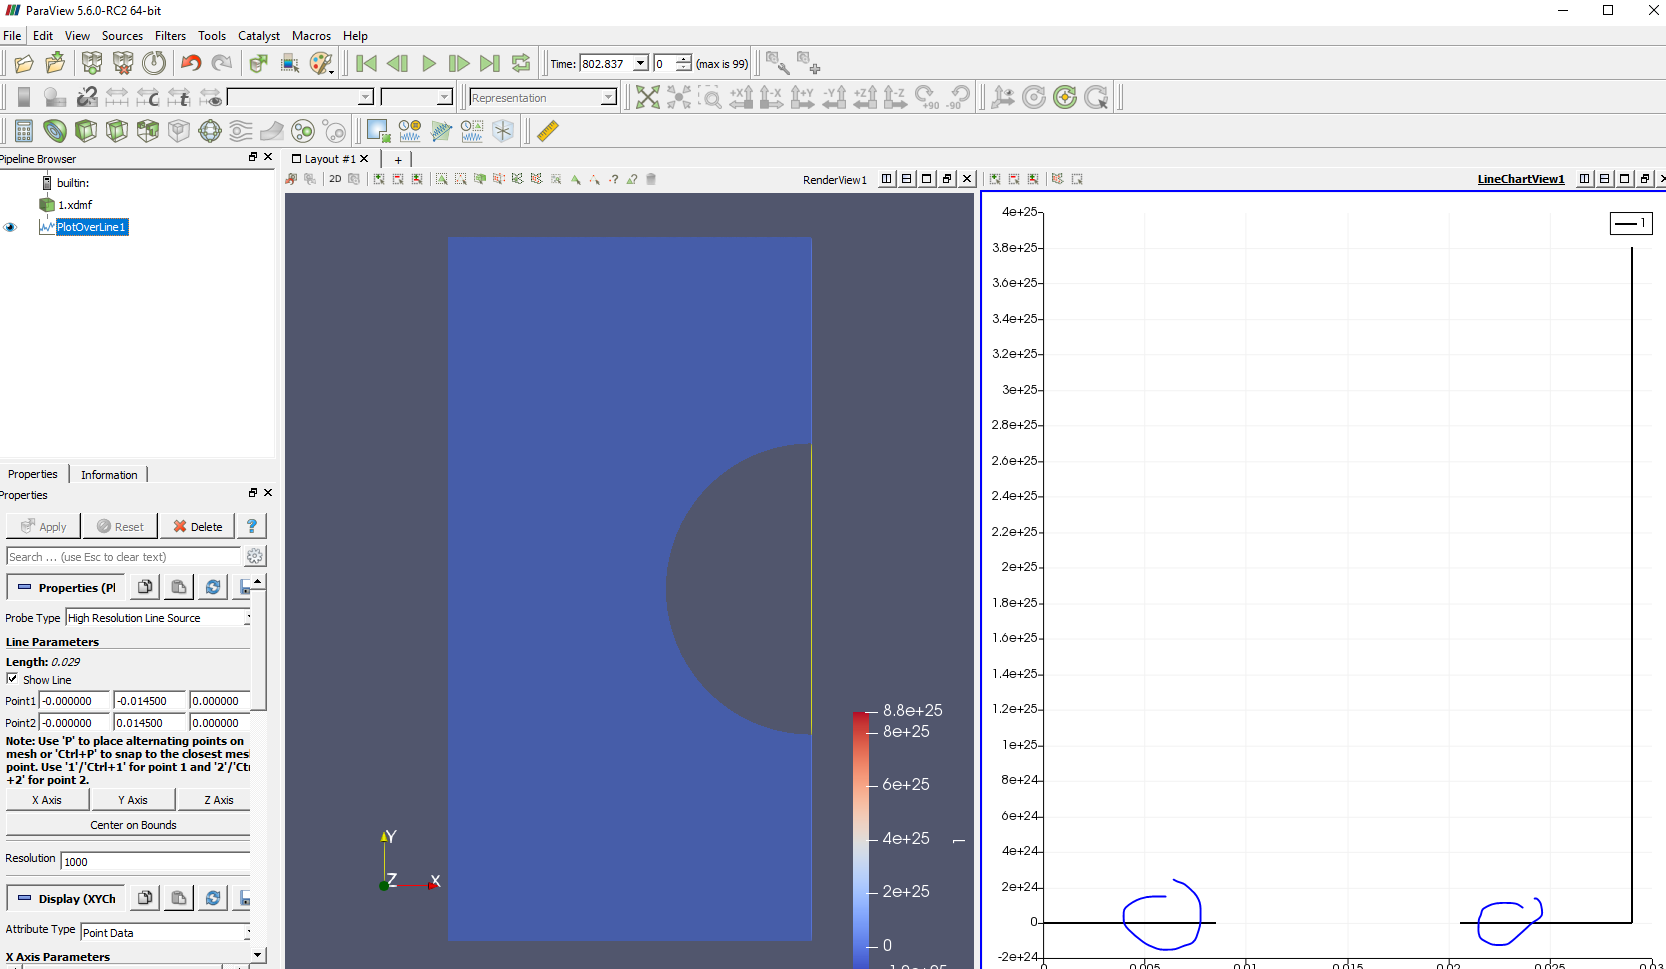
Also note that these “holes” disappear if you set the x position of the line on -1e-9 for example.
---
### Author:  [@mwestphal](https://discourse.paraview.org/u/mwestphal)
#### Post date: [July 15, 2019, 9:33am UTC](https://discourse.paraview.org/t/plot-over-line-gives-nan/2207/4 "2019-07-15T09:33:33Z")
that a problem when the line is exactly on the edge. I would suggest using “Ctrl+P” to find the right position for the line?.
---
### Author:  [@Rem](https://discourse.paraview.org/u/Rem)
#### Post date: [July 15, 2019, 9:39am UTC](https://discourse.paraview.org/t/plot-over-line-gives-nan/2207/5 "2019-07-15T09:39:08Z")
Tried that, but it crashed for some reason
---
### Author:  [@mwestphal](https://discourse.paraview.org/u/mwestphal)
#### Post date: [July 15, 2019, 9:40am UTC](https://discourse.paraview.org/t/plot-over-line-gives-nan/2207/6 "2019-07-15T09:40:05Z")
Looks like a bug. does 5.7.0-RC1 fixes it ?
---
### Author:  [@Rem](https://discourse.paraview.org/u/Rem)
#### Post date: [July 15, 2019, 9:40am UTC](https://discourse.paraview.org/t/plot-over-line-gives-nan/2207/7 "2019-07-15T09:40:31Z")
Unfortunately not
---
### Author:  [@mwestphal](https://discourse.paraview.org/u/mwestphal)
#### Post date: [July 15, 2019, 9:48am UTC](https://discourse.paraview.org/t/plot-over-line-gives-nan/2207/8 "2019-07-15T09:48:01Z")
Any output in the terminal ?
---
### Author:  [@Rem](https://discourse.paraview.org/u/Rem)
#### Post date: [July 15, 2019, 9:49am UTC](https://discourse.paraview.org/t/plot-over-line-gives-nan/2207/9 "2019-07-15T09:49:21Z")
None
---
### Author:  [@mwestphal](https://discourse.paraview.org/u/mwestphal)
#### Post date: [July 15, 2019, 9:51am UTC](https://discourse.paraview.org/t/plot-over-line-gives-nan/2207/10 "2019-07-15T09:51:45Z")
Well, unless you can provide more info, you will have to carefully set your line position.
---
### Author:  [@Rem](https://discourse.paraview.org/u/Rem)
#### Post date: [July 15, 2019, 9:52am UTC](https://discourse.paraview.org/t/plot-over-line-gives-nan/2207/11 "2019-07-15T09:52:51Z")
I’m afraid I can’t. Now that I found a workaround it’s okay but this is a mystery to me. Have you managed to reproduce it ?
---
### Author:  [@mwestphal](https://discourse.paraview.org/u/mwestphal)
#### Post date: [July 15, 2019, 9:59am UTC](https://discourse.paraview.org/t/plot-over-line-gives-nan/2207/12 "2019-07-15T09:59:07Z")
Not at all. If you want to investigate the issue yourself, you will have to build ParaView in debug and run it with a debugger. Not an easy task unless you are a programmer.
---
### Author:  [@Rem](https://discourse.paraview.org/u/Rem)
#### Post date: [July 15, 2019, 10:01am UTC](https://discourse.paraview.org/t/plot-over-line-gives-nan/2207/13 "2019-07-15T10:01:05Z")
That’s strange cause the same thing happens on two of my computers.
I’ll see if I can find time to investigate a bit further though
---
### Author:  [@wascott](https://discourse.paraview.org/u/wascott)
#### Post date: [July 16, 2019, 7:23pm UTC](https://discourse.paraview.org/t/plot-over-line-gives-nan/2207/14 "2019-07-16T19:23:58Z")
Remi, if you can post your data in a different format, such as a .tar.gz, I will take a look.
Alan
---
### Author:  [@Rem](https://discourse.paraview.org/u/Rem)
#### Post date: [July 17, 2019, 6:52am UTC](https://discourse.paraview.org/t/plot-over-line-gives-nan/2207/15 "2019-07-17T06:52:48Z")
Hi,
What about that ?
[temperature.xdmf](https://discourse.paraview.org/uploads/default/original/2X/2/268e0e5e018e1de53f165da0be2c1dec14d67139.xdmf) (681 Bytes)
[temperature.h5](https://discourse.paraview.org/uploads/default/original/2X/8/8244e3144df8df017d95b9e0fa67fcc3d9188738.h5) (379.3 KB)
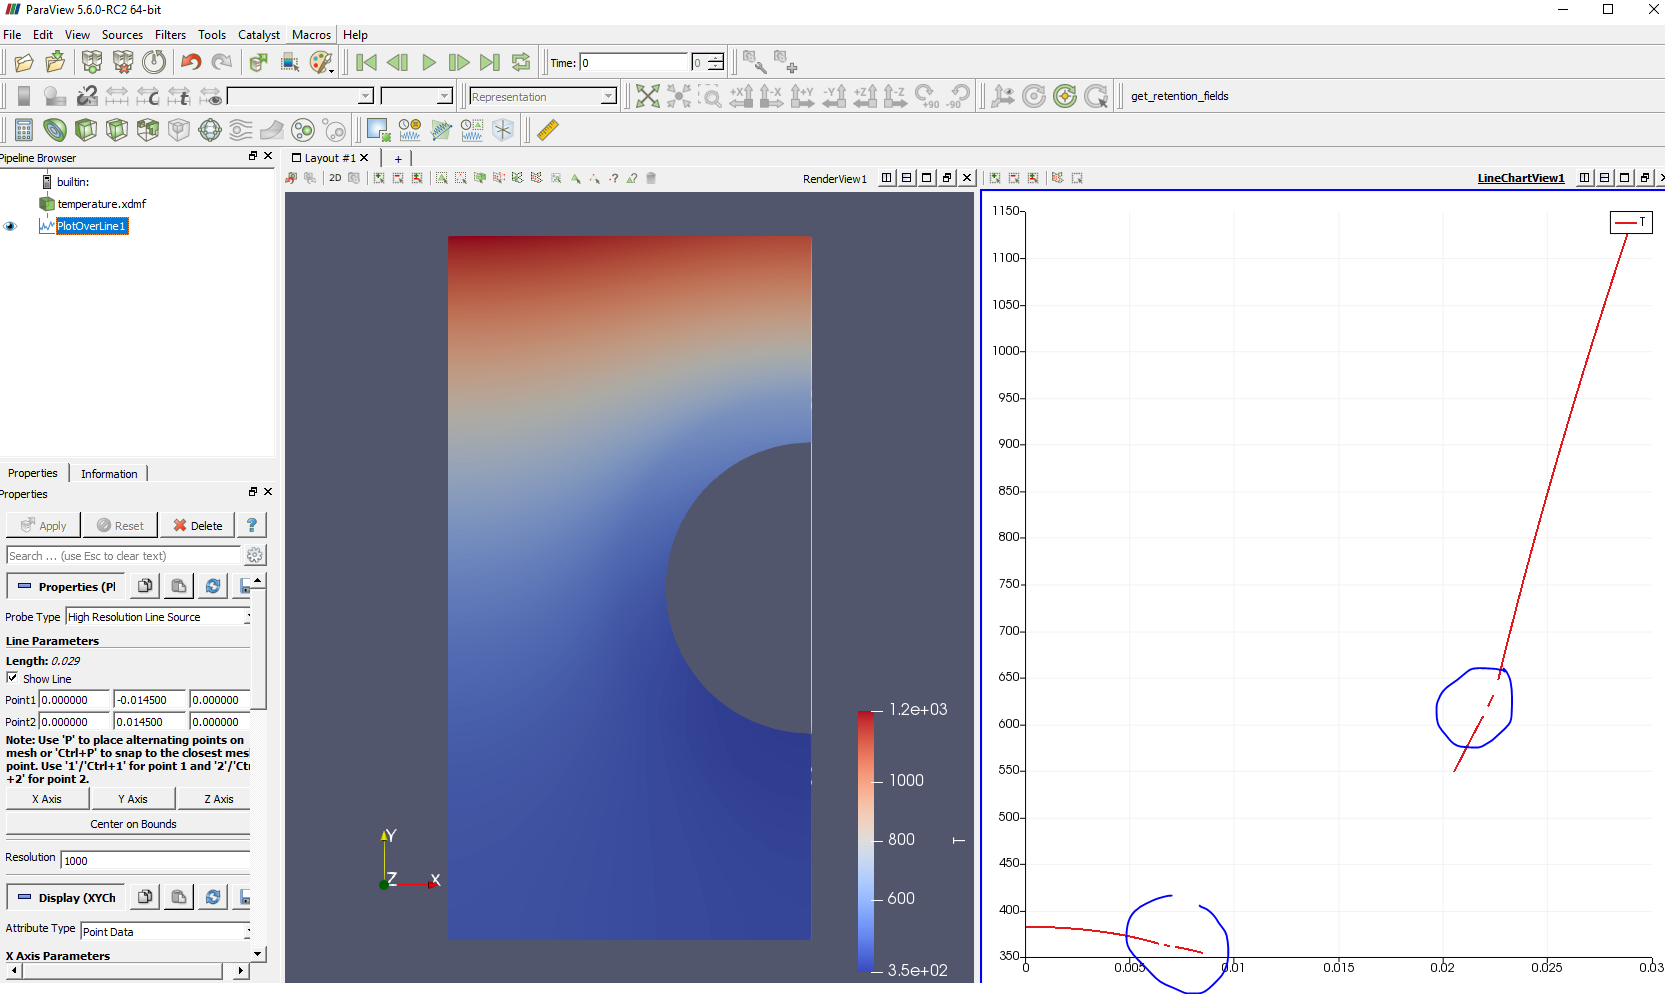
Same thing happens on this data.
---
### Author:  [@Kenneth\_Moreland](https://discourse.paraview.org/u/Kenneth_Moreland)
#### Post date: [July 17, 2019, 2:12pm UTC](https://discourse.paraview.org/t/plot-over-line-gives-nan/2207/16 "2019-07-17T14:12:09Z")
The problem is that you are trying to plot right on the edge of your mesh, and numerical inaccuracies are causing points of the line to be outside of your mesh. (This is not a criticism of your data. Rather, this is just the nature of floating point numbers on a computer.)
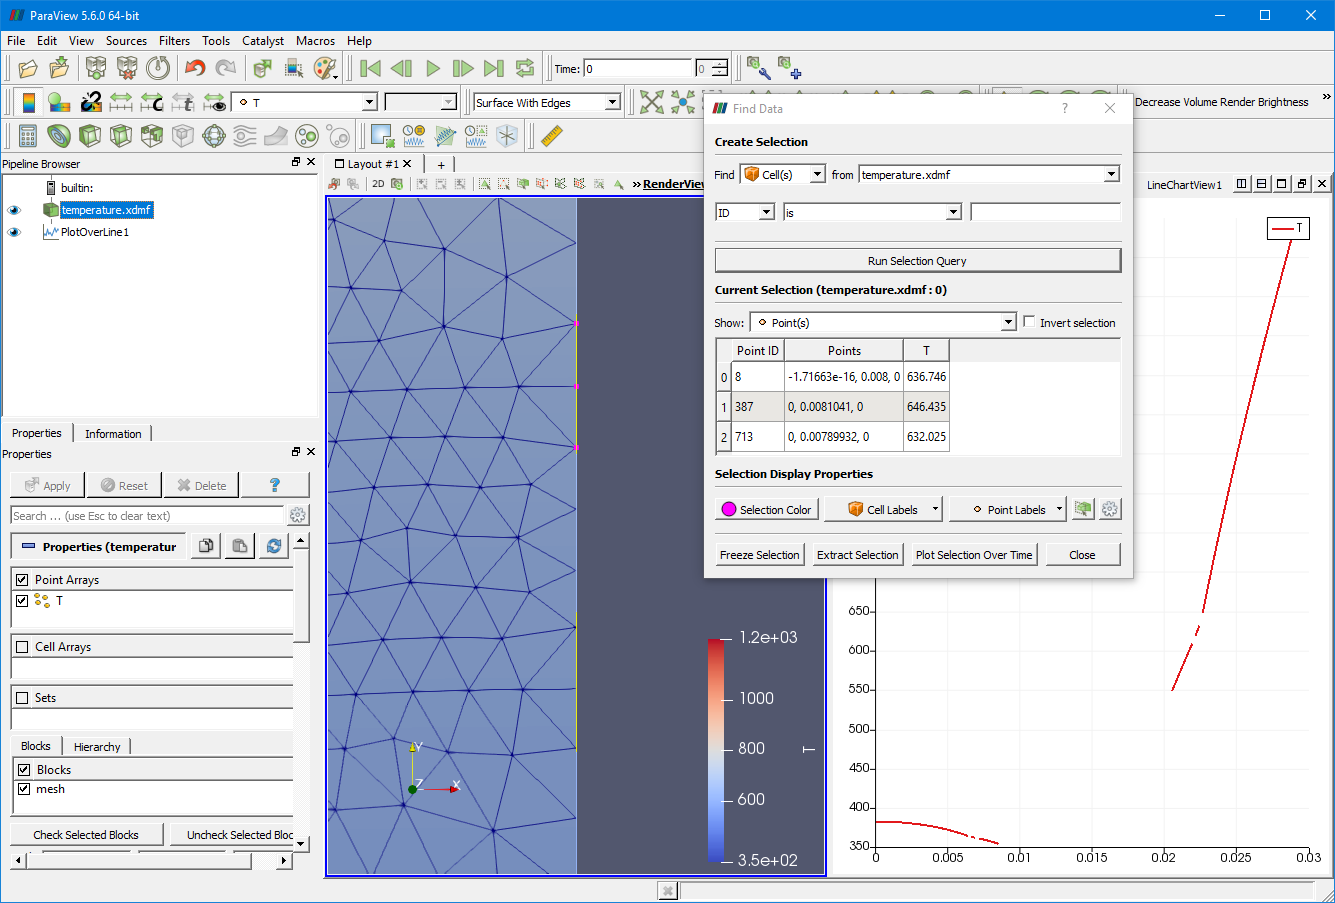
Take a look at this captured screenshot. Here I have zoomed in the mesh at one of the places where the `Plot Over Line` is giving a NaN value. (It is the topmost point in the mesh and the rightmost point in the plot.) Then I have selected 3 mesh points around that location and I’m showing the numeric information for those 3 points in the superimposed `Find Data` dialog.
You can see that although the points with ids 387 and 713 have an x coordinate value of 0. However, the point with id 8 (which happens to be in the middle) has x coordinate value of -1.71663e-16. This is just slightly to the left of the line you are plotting on. The difference is imperceptible and I’m sure below any realistic significant digits. However, it means that when `Plot Over Line` intersects the line around those mesh cells, it computes it as just outside the boundary of the mesh, and thus assigns NaN values (which is the correct behavior).
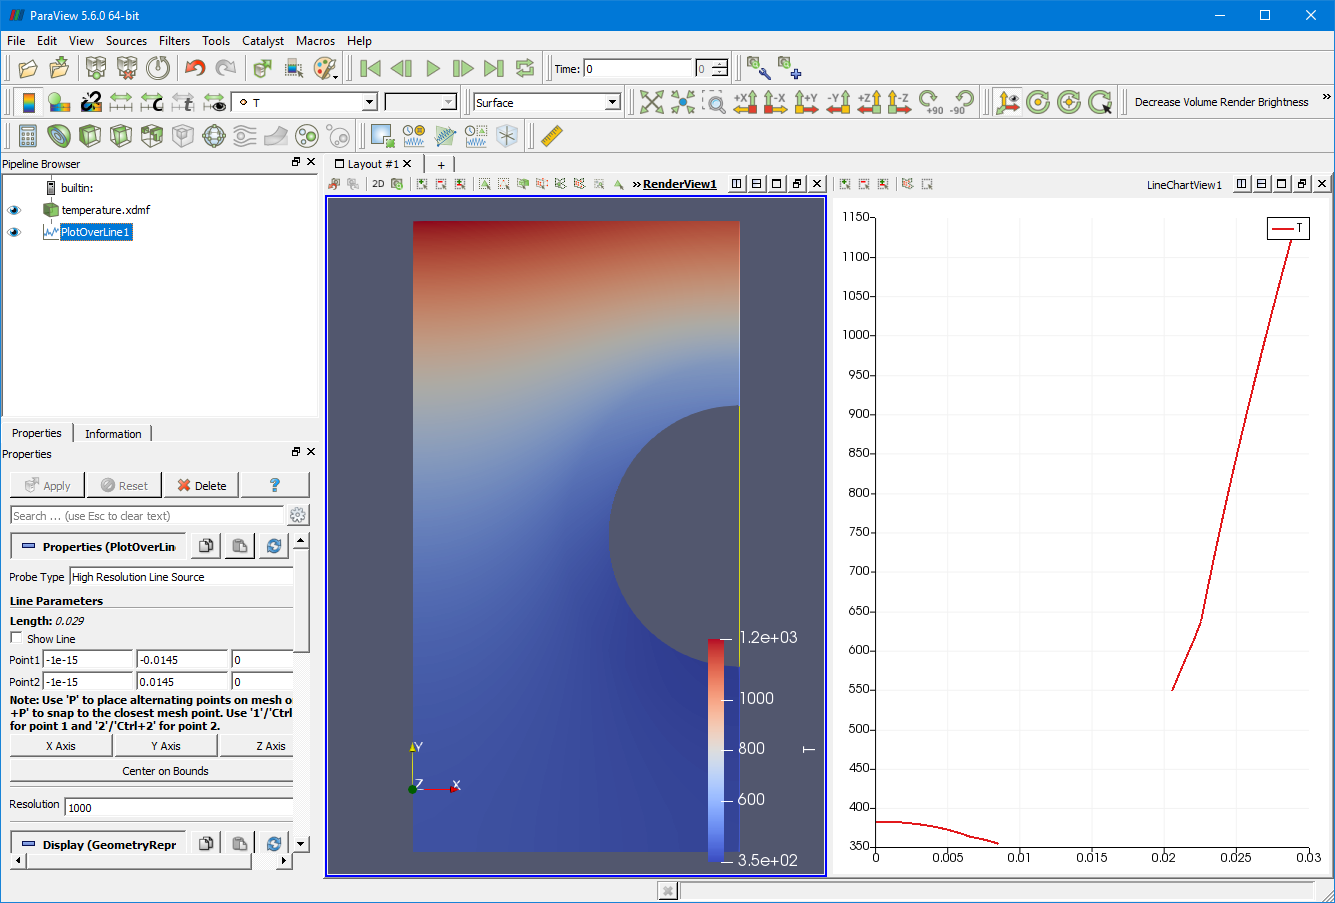
The solution is simple. Move the line to the left by an epsilon amount so that it is always inside the mesh. I changed the x coordinate of both `Point 1` and `Point 2` to be `-1e-15`, and that seemed to work just fine as shown in this second screen capture.
---
### Author:  [@Rem](https://discourse.paraview.org/u/Rem)
#### Post date: [July 17, 2019, 2:15pm UTC](https://discourse.paraview.org/t/plot-over-line-gives-nan/2207/17 "2019-07-17T14:15:51Z")
Hi Kenneth ! Thanks for the help ! I was starting to imagine that the reason was something like that. I’ll find a solution for a better meshing.
I found that trick of moving an epsilon to the left but couldn’t figure why it worked: now I do!
Thank you all !!
Rem