# Plot over sorted line
**URL:** https://discourse.paraview.org/t/plot-over-sorted-line/13629
**Category:** ParaView Support
**Created:** [January 3, 2024, 2:54pm UTC](https://discourse.paraview.org/t/plot-over-sorted-line/13629 "2024-01-03T14:54:34Z")
**Posts on this page:** 6
**Page:** 1
### Author:  [@KB92](https://discourse.paraview.org/u/KB92)
#### Post date: [January 3, 2024, 2:54pm UTC](https://discourse.paraview.org/t/plot-over-sorted-line/13629/1 "2024-01-03T14:54:34Z")
Hello, I am posting this again as I forgot to upload images in my previous post.

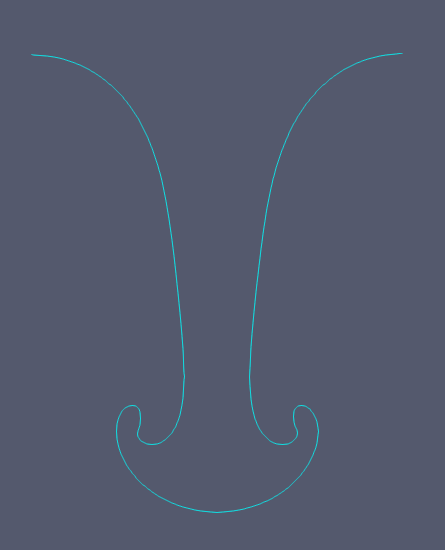
I have data in .vtk file which gives surface plot as seen in picture 1. 2nd picture is the contour plot of the 1st one. Now I need to save data of this contour plot as .csv file in a way that I can create the same shape in excel or python where I will be comparing several of these. After contouring I used plot on sorted line but it gives a single value instead of the same mushroom kind of shape. Please explain how can I achieve this?
---
### Author:  [@Kenneth\_Moreland](https://discourse.paraview.org/u/Kenneth_Moreland)
#### Post date: [January 3, 2024, 4:01pm UTC](https://discourse.paraview.org/t/plot-over-sorted-line/13629/2 "2024-01-03T16:01:46Z")
The short answer is you can run the `Plot On Sorted Lines` filter on your contour lines to order the points to follow the line. Then save the result as a CSV file.
Demonstrating this is always easier when you post your data (not just the images), but as a proxy I did a contour on a smoothed Mandelbrot fractal in ParaView to generate a wavy line. Here is the state file and screen shot.
[contour-plot.pvsm](https://discourse.paraview.org/uploads/short-url/4aizhiBM0MERtub6Hp2txqvzonw.pvsm) (655.3 KB)
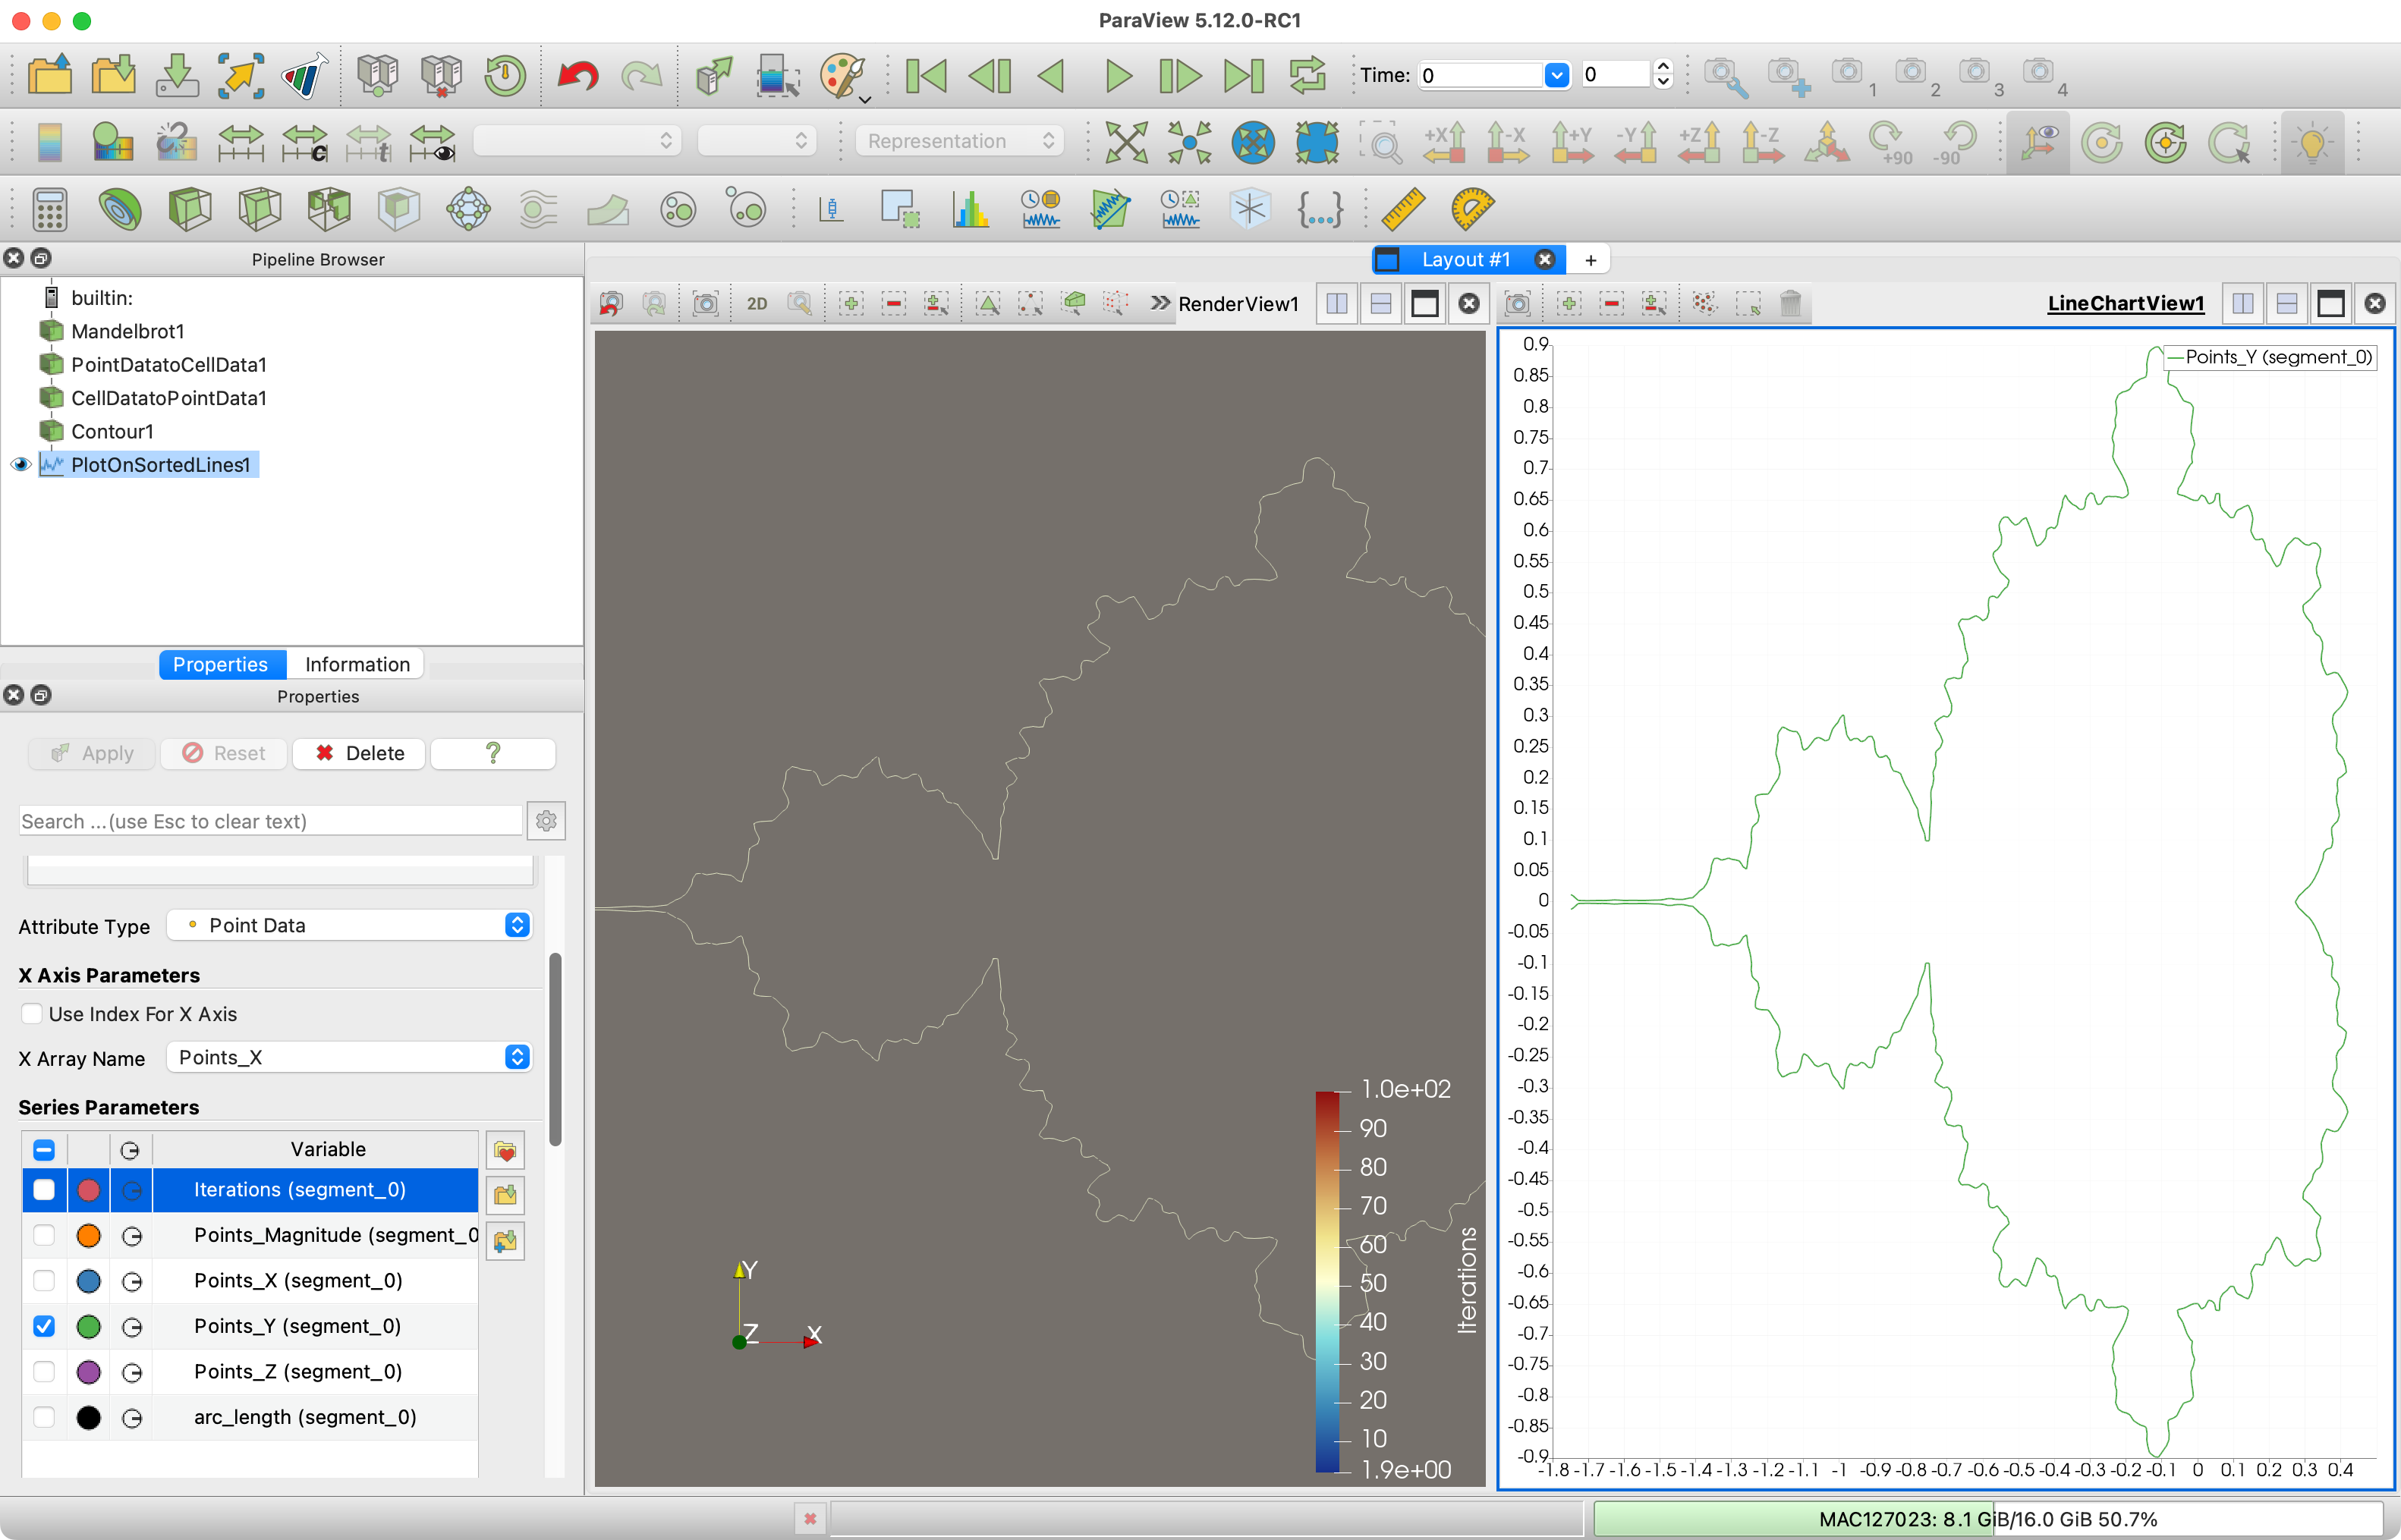
As you can see, after making the contour plot, I ran the `Plot On Sorted Lines` filter. ParaView makes its own XY plot for that (which is the original point of the filter). I changed the X and Y axes to follow the X and Y coordinates to verify the plot is correct.
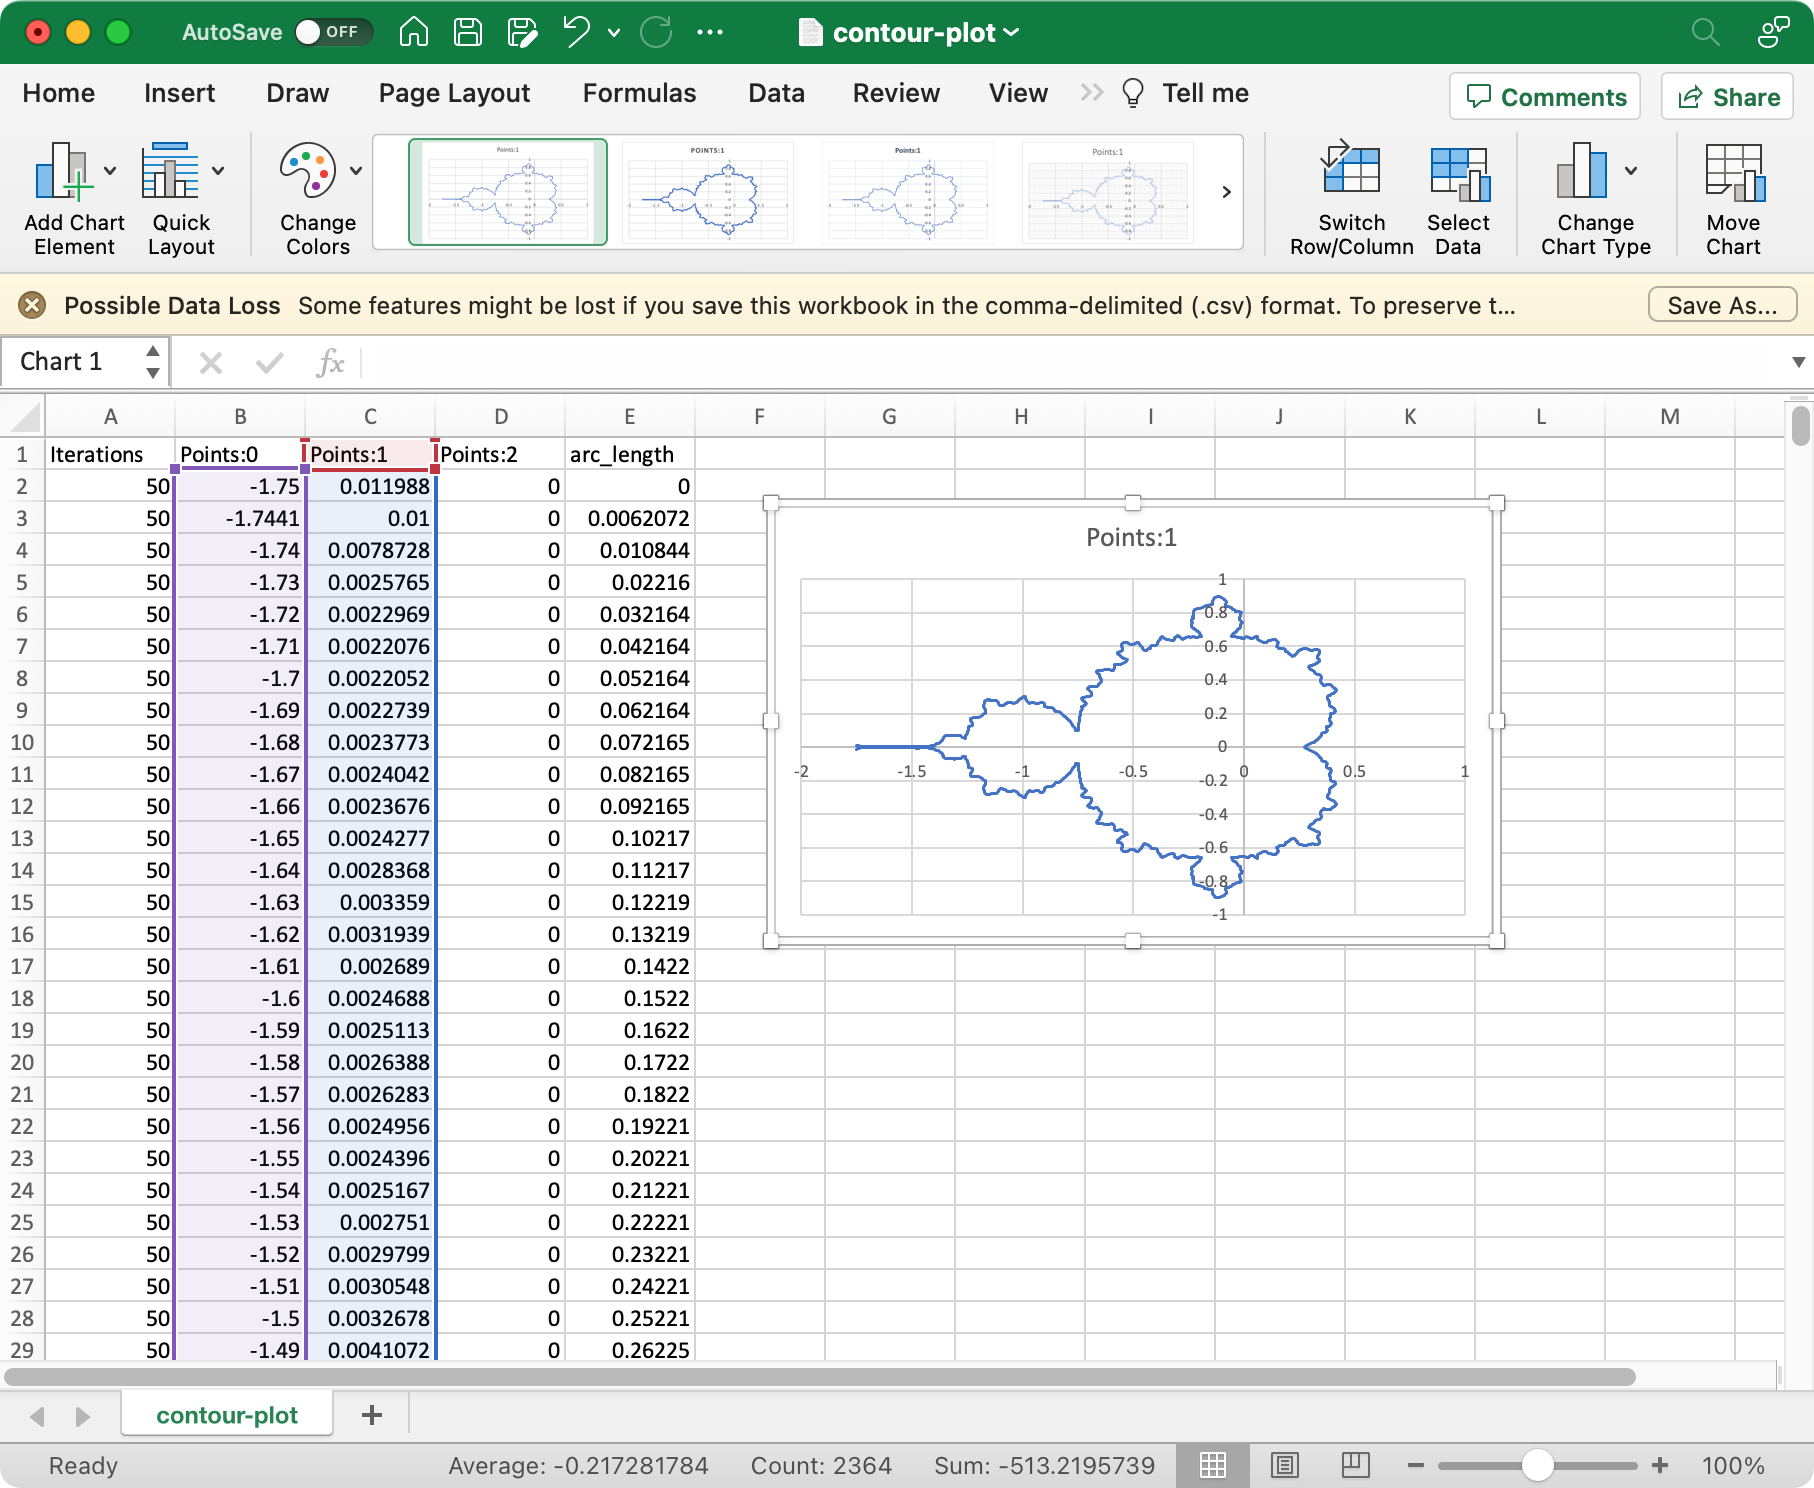
After this, you can use save data  to write out a CSV file on the points. You can then plot the X and Y coordinates in any program you like. Here is a screenshot of me doing that in Excel.
This problem was also discussed on this post: [How do I obtain contour lines in a sequence. - #11 by Kenneth\_Moreland](https://discourse.paraview.org/t/how-do-i-obtain-contour-lines-in-a-sequence/8530/11)
---
### Author:  [@KB92](https://discourse.paraview.org/u/KB92)
#### Post date: [January 3, 2024, 9:35pm UTC](https://discourse.paraview.org/t/plot-over-sorted-line/13629/3 "2024-01-03T21:35:34Z")
Thank you so much. It helped. I have another question if I can ask it here. Is there a way to modify data in a vtk file and save it again as a vtk?
---
### Author:  [@Kenneth\_Moreland](https://discourse.paraview.org/u/Kenneth_Moreland)
#### Post date: [January 4, 2024, 1:32pm UTC](https://discourse.paraview.org/t/plot-over-sorted-line/13629/4 "2024-01-04T13:32:08Z")
That sounds like a question best asked on a new post. And can you be more specific about what do you mean? Do you mean you want to save a vtk file, edit it, and reload it in ParaView? Do you mean you want to load a vtk file in ParaView, edit it in ParaView, and save it again?
What modifications do you want to make? ParaView filters can make lots of modifications to mesh features. But in general you cannot edit individual features in the mesh.
---
### Author:  [@KB92](https://discourse.paraview.org/u/KB92)
#### Post date: [January 5, 2024, 12:24pm UTC](https://discourse.paraview.org/t/plot-over-sorted-line/13629/5 "2024-01-05T12:24:08Z")
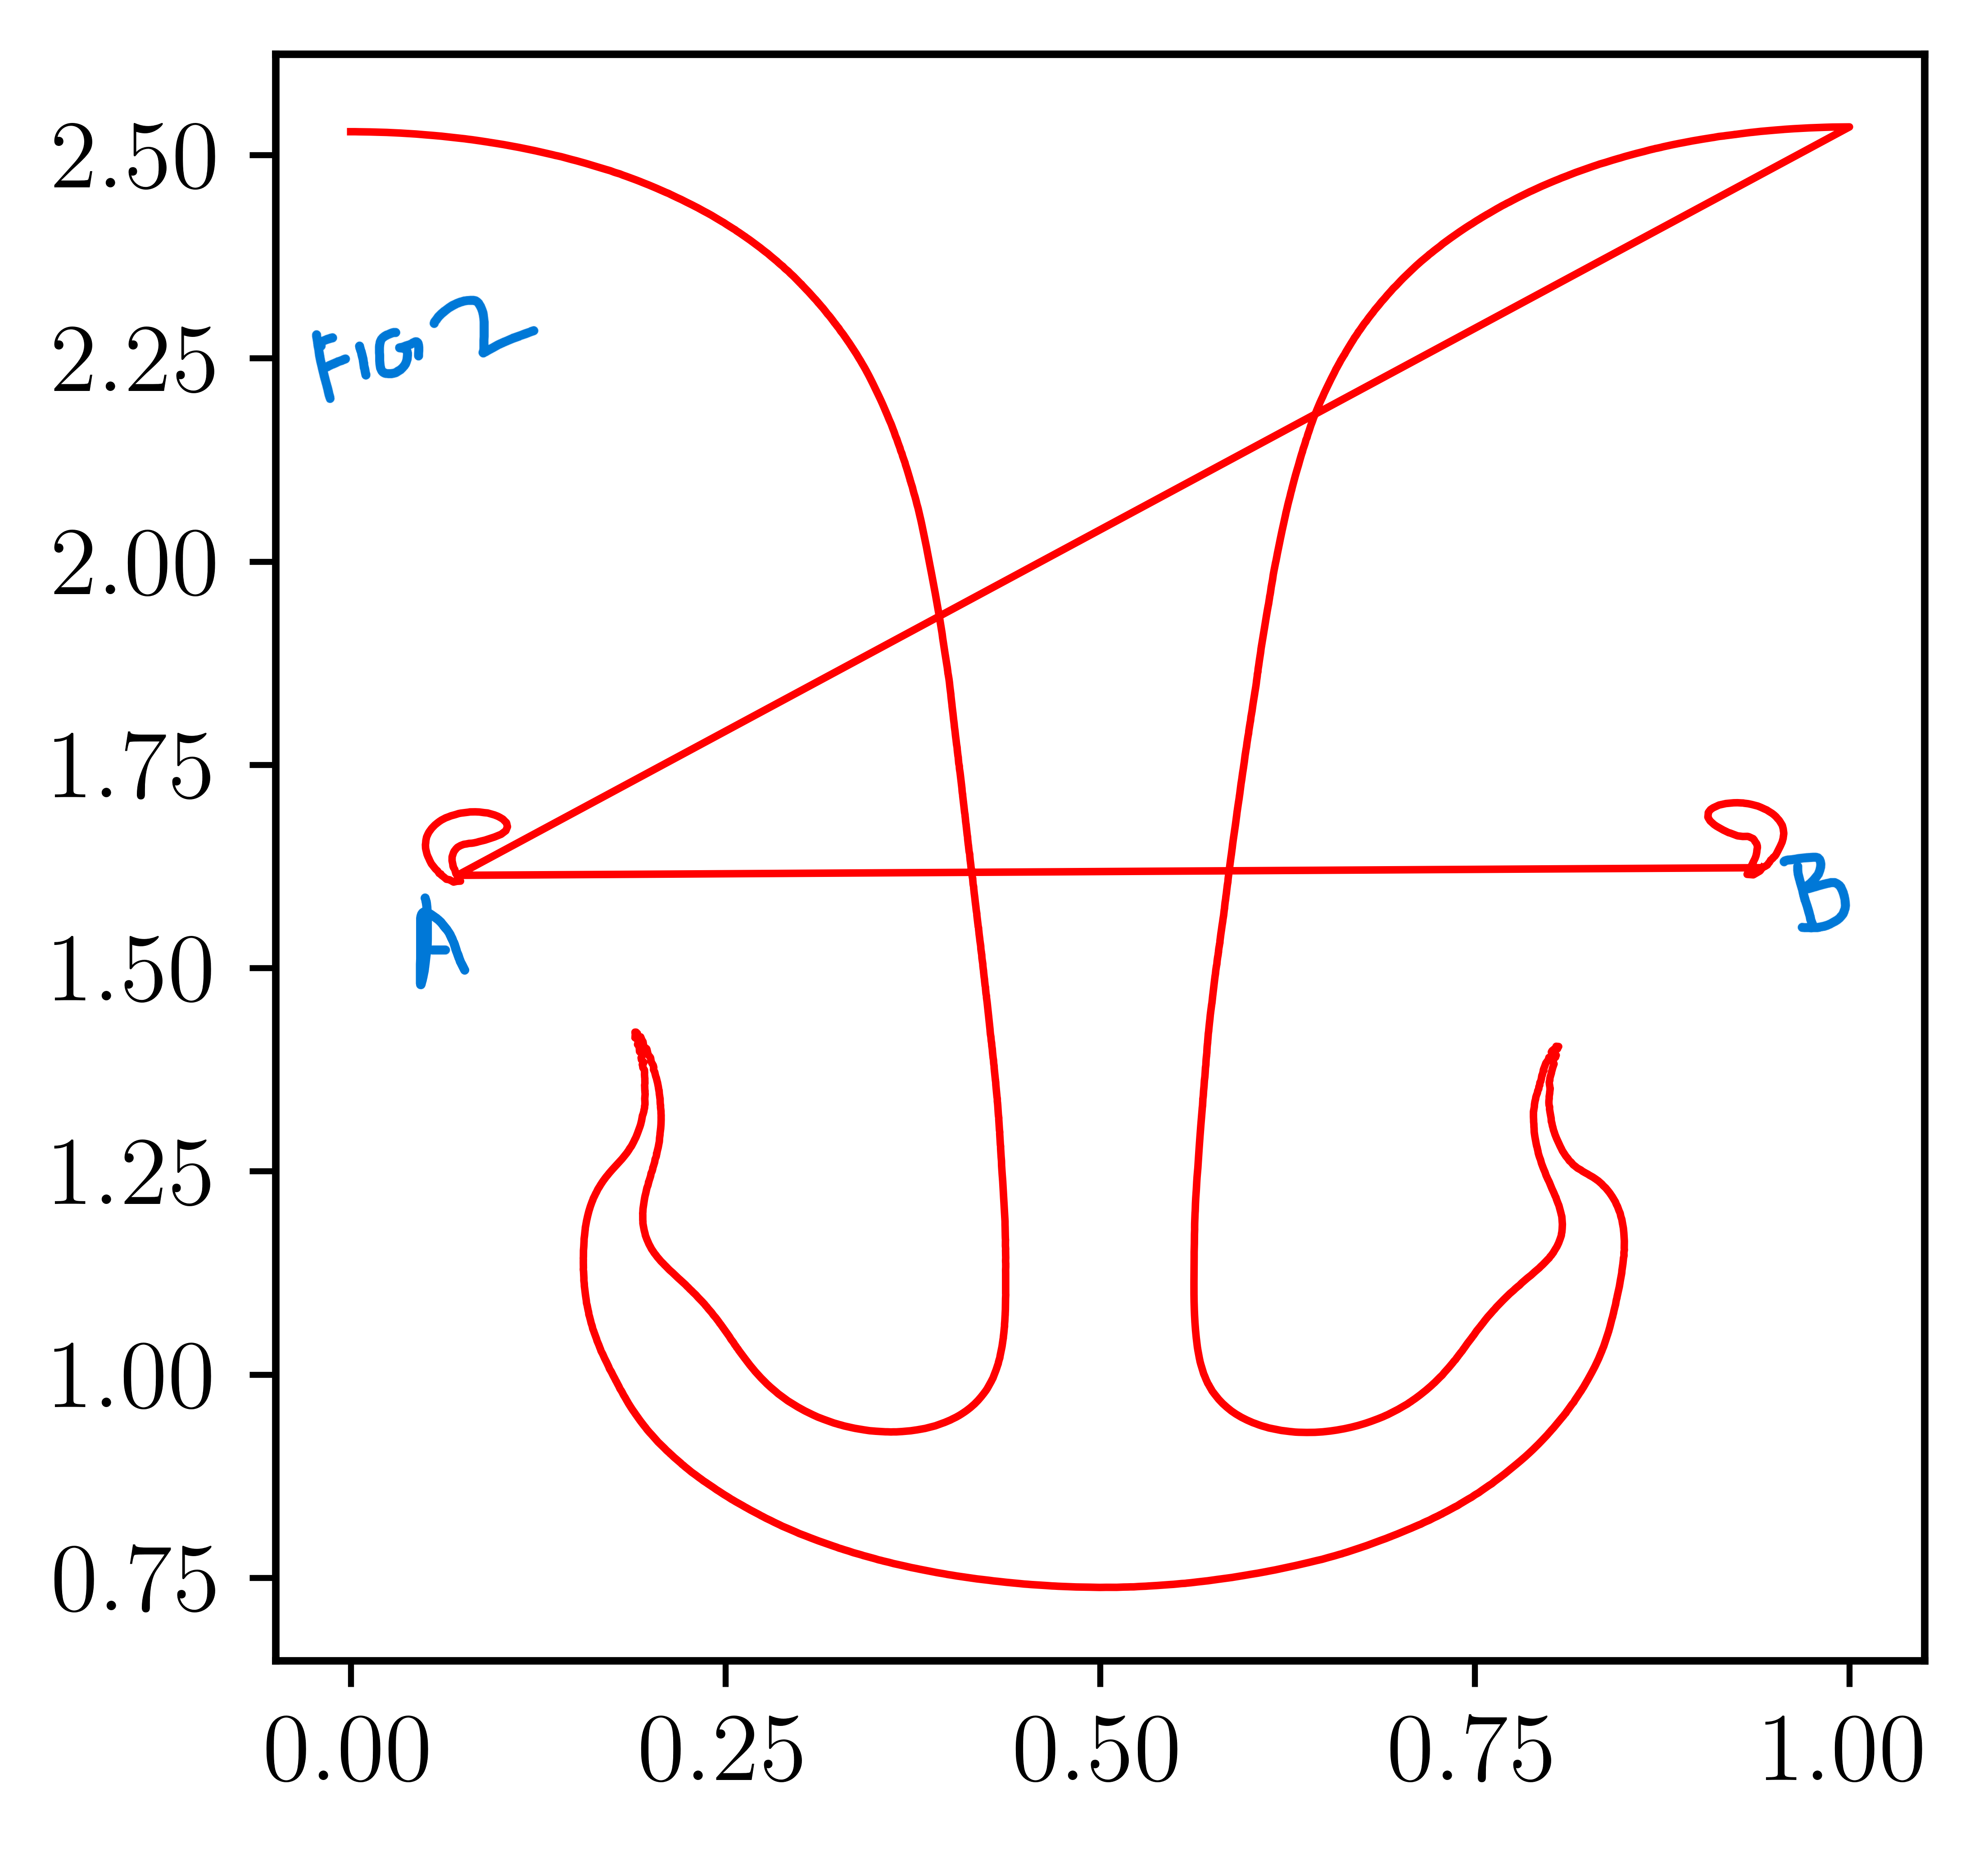
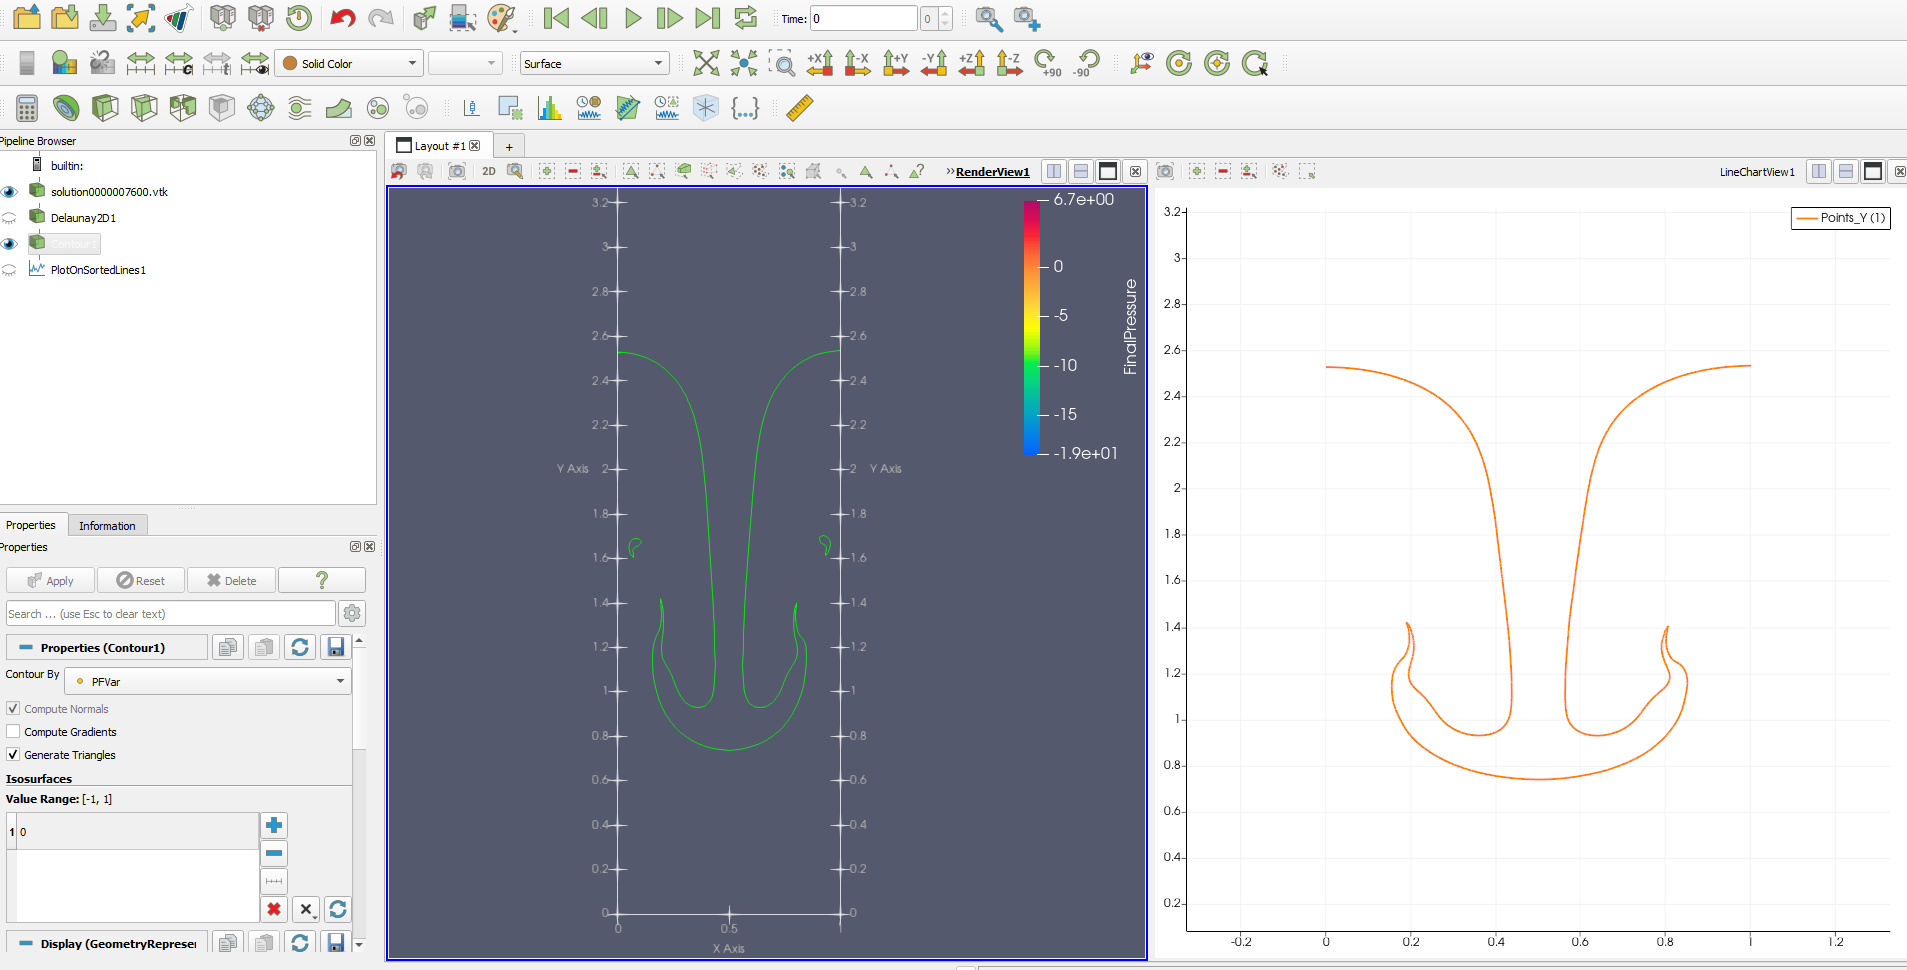
Thank you for your reply. but I am encountering a problem regarding my earlier question. For some of my vtk files (one example is attached in the zip file), there are some data points that are not connected with the remaining data but they are important for the results. Using plot on sorted line filter, these points didn’t appear in the plot (see paraview screenshot please). When I saved data, these points were anyhow written. Plotting (line plot) them in Python connected the vortices (scattered points) with the remaining data which is not ok. Is it possible to save data in a sense that the data sets at points A and B of the figure 2 go in a separate array?
[solution0000007600.zip](https://discourse.paraview.org/uploads/short-url/oogtxF1vbhhIuEbNg72Rx958EOg.zip) (896.3 KB)
---
### Author:  [@Kenneth\_Moreland](https://discourse.paraview.org/u/Kenneth_Moreland)
#### Post date: [January 5, 2024, 2:45pm UTC](https://discourse.paraview.org/t/plot-over-sorted-line/13629/6 "2024-01-05T14:45:29Z")
Again, this is discussed in [How do I obtain contour lines in a sequence. - #12 by ksugahar](https://discourse.paraview.org/t/how-do-i-obtain-contour-lines-in-a-sequence/8530/12). In that post, I suggested to run the `Connectivity` filter to identify the independent curves. However, your comment about the plotting made me realize that the `Plot On Sorted Lines` filter is already doing that for you.
The `Plot On Sorted Lines` filter identifies each connected curve and places the data for each one in its own block of a multi-block data set. By default, the line chart view plots only the first block, which is why that is the only curve you are seeing in ParaView. If you look at the top of the `Display` properties, you will see where you can turn on multiple blocks (labeled `segment_#`), which then allows you to control which series are plotted.
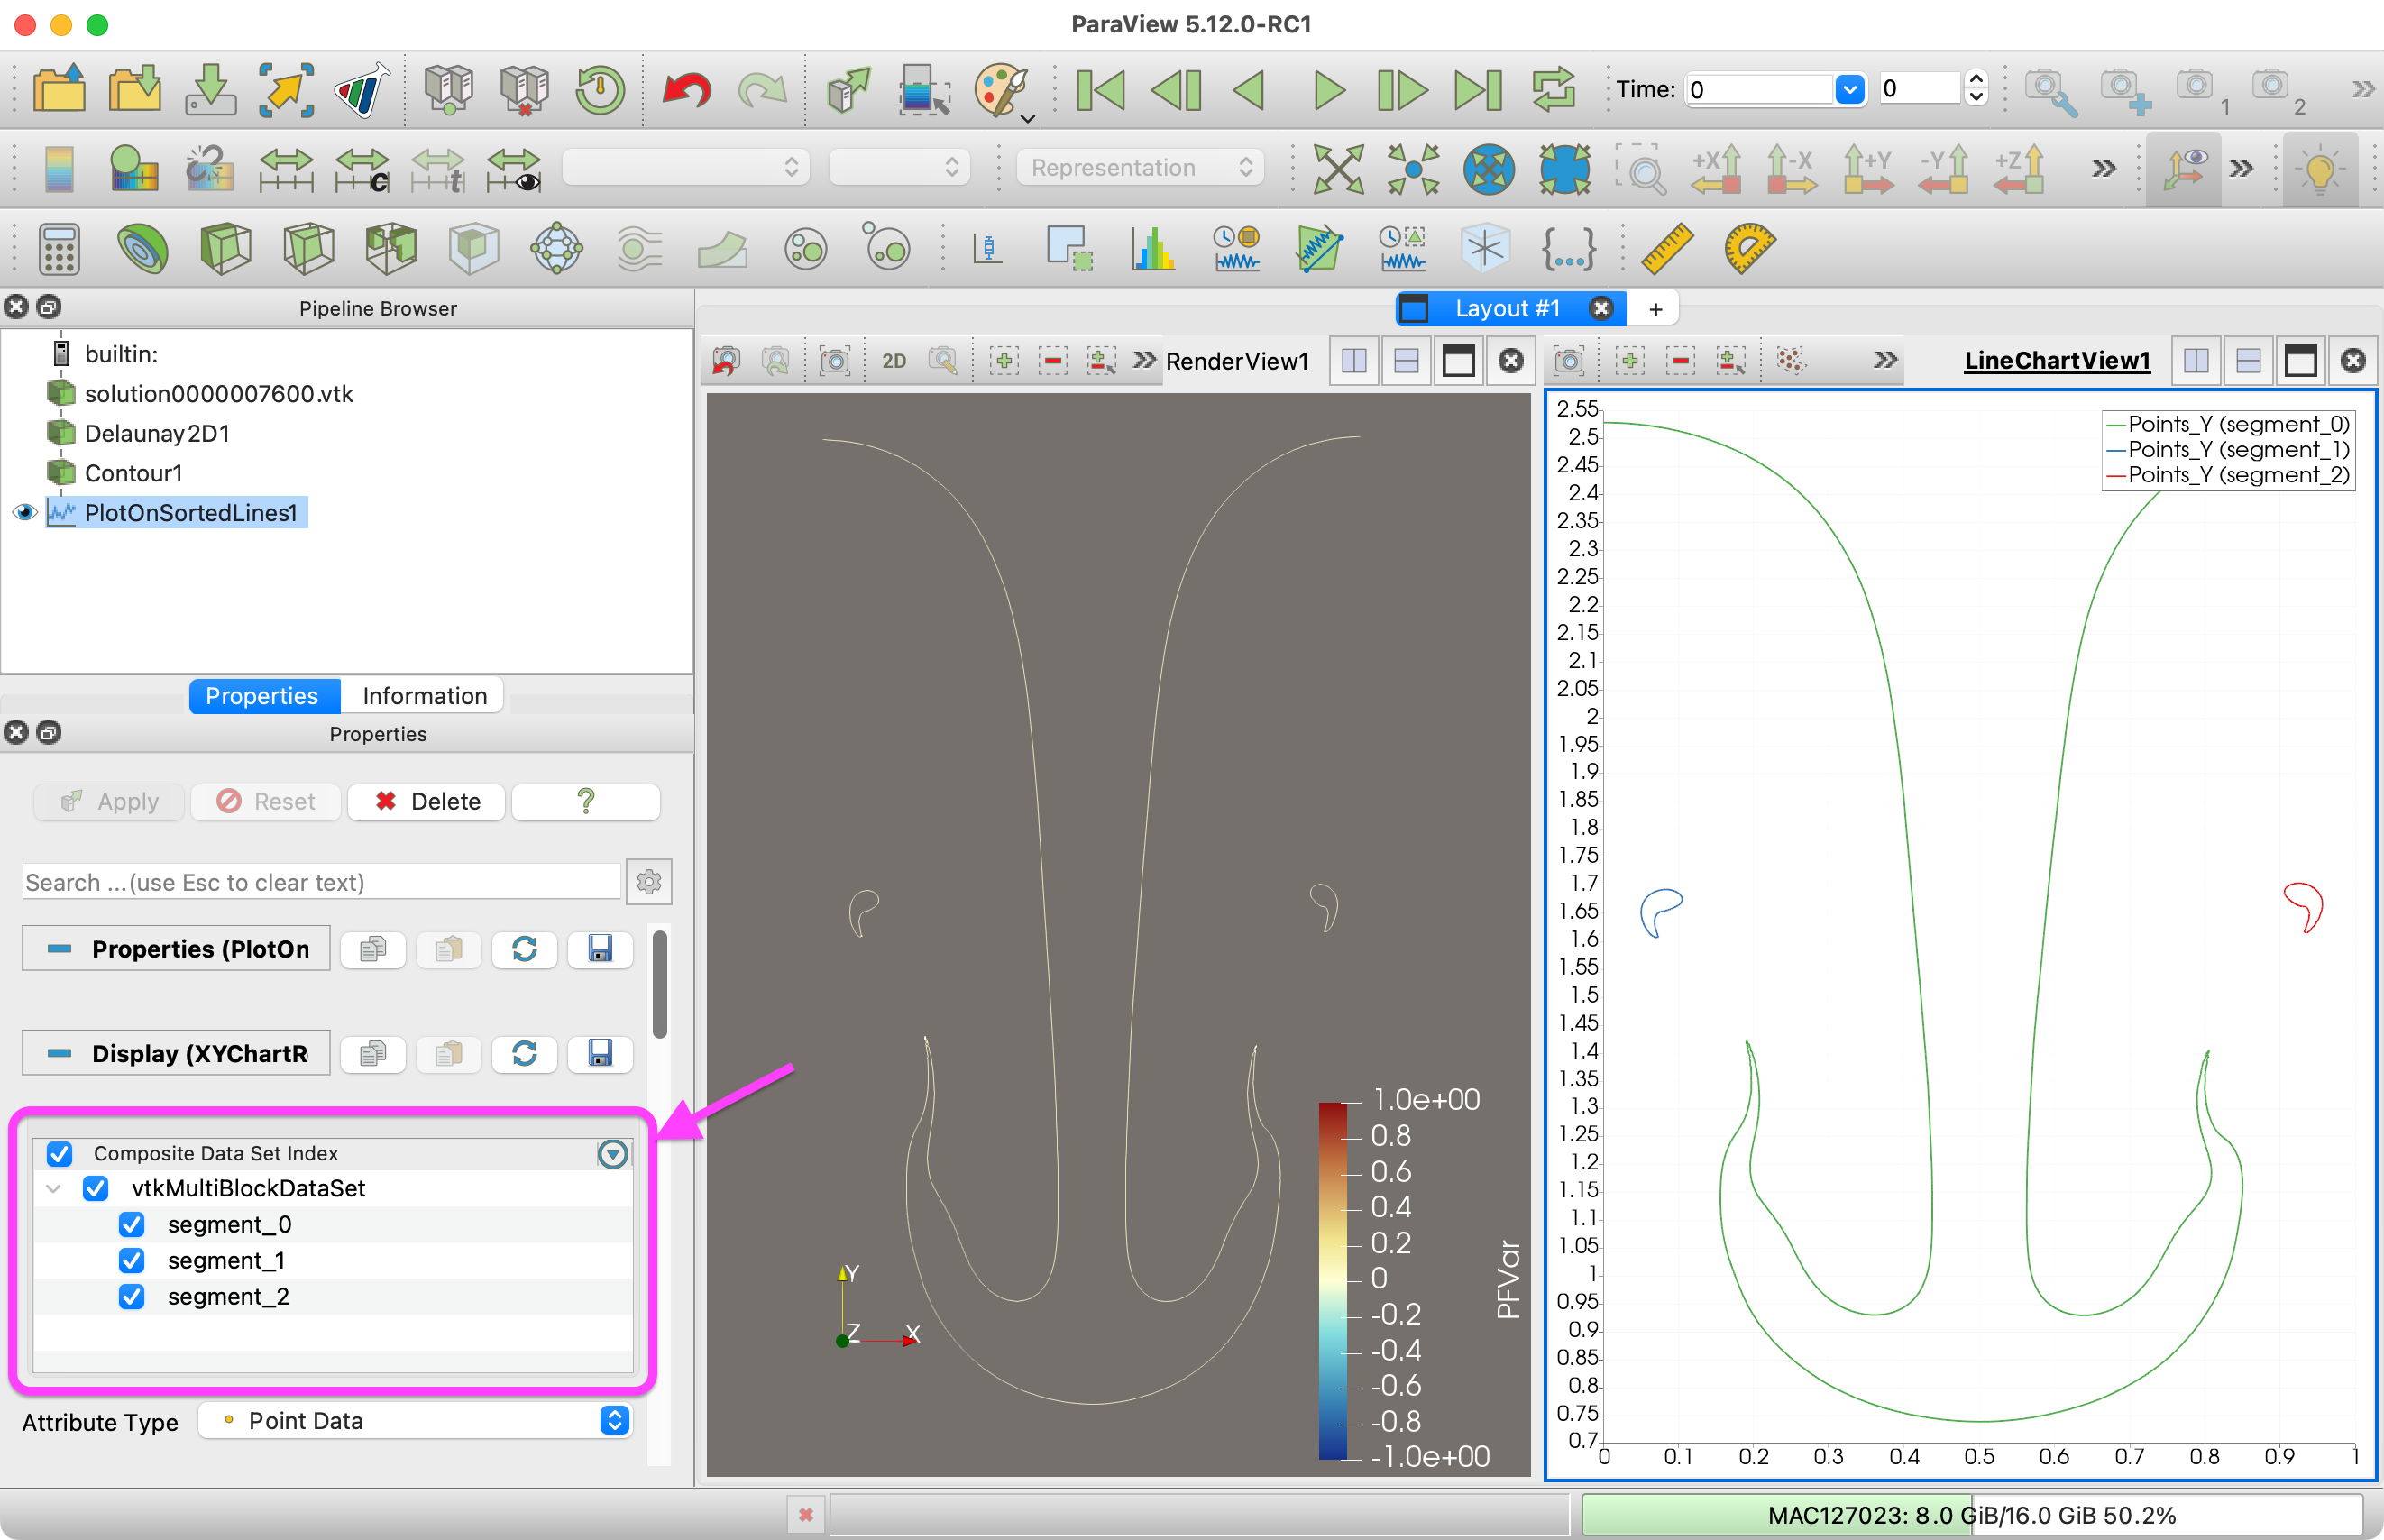
When you write out the data to a CSV file, it concatenates all of the blocks together, which is why you are seeing them all in your Python plot. There are a couple of things you can do to get around this.
The first is you can use the `Extract Block` filter  to extract a single block. Extract each block one by one and save them each in a separate CSV file. Then you can load each one into your Python script and plot each as a separate curve.
The second is to identify which block each curve is on. Run the result of `Plot On Sorted Lines` first through the `Block Scalars` filter and then through the `Cell Data to Point Data` filter. Save the result of that to a CSV file. Your CSV file will have a new column labeled `BlockIdScalars` that identifies which curve each point belongs to. In your Python script you can use a pivot table technique to pull out the points for each curve, or you can just suppress the plotting of lines between points that have different `BlockIdScalars` values.