# Plot variable over block number at a specific timestep
**URL:** https://discourse.paraview.org/t/plot-variable-over-block-number-at-a-specific-timestep/9956
**Category:** ParaView Support
**Tags:** vtk
**Created:** [July 1, 2022, 9:57am UTC](https://discourse.paraview.org/t/plot-variable-over-block-number-at-a-specific-timestep/9956 "2022-07-01T09:57:47Z")
**Posts on this page:** 5
**Page:** 1
### Author:  [@Jeremie](https://discourse.paraview.org/u/Jeremie)
#### Post date: [July 1, 2022, 9:57am UTC](https://discourse.paraview.org/t/plot-variable-over-block-number-at-a-specific-timestep/9956/1 "2022-07-01T09:57:47Z")
Hi all,
I have several vtk output files from 5 simulations, each with the same number of variables and timesteps. I grouped them together in a Multi-Block Dataset to visualize each simulation’s velocity over time on the same graph.
Now I want to visualize the steady-state velocity (velocity at the last timestep) over Block Number (1 to 5). I extracted the data at the last timestep from the Multi-Block Dataset using the Extract Timestep filter, but when I then use Plot Data it says that it cannot plot line with \<2 points.
Can someone help me figure out what I am doing wrong?
Best,
Jérémie
---
### Author:  [@Joachim\_P](https://discourse.paraview.org/u/Joachim_P)
#### Post date: [July 8, 2022, 11:23am UTC](https://discourse.paraview.org/t/plot-variable-over-block-number-at-a-specific-timestep/9956/2 "2022-07-08T11:23:49Z")
Jérémie,
So it looks like the Extract Timestep fails in some way and the output data is empty? Please check the Information Panel and inspect all the blocks. If it is the case, you might have configured the filter in the correct way. Please provide more details so we can help.
HTH
---
### Author:  [@Jeremie](https://discourse.paraview.org/u/Jeremie)
#### Post date: [July 13, 2022, 9:32am UTC](https://discourse.paraview.org/t/plot-variable-over-block-number-at-a-specific-timestep/9956/3 "2022-07-13T09:32:49Z")
Hi Joachim,
Sorry for the delay.
Here are my files and how I format them.
[file.tar.gz](https://discourse.paraview.org/uploads/short-url/tyVHVDPWvMPp1iI1j8O7bGZNLFc.gz) (4.0 MB)
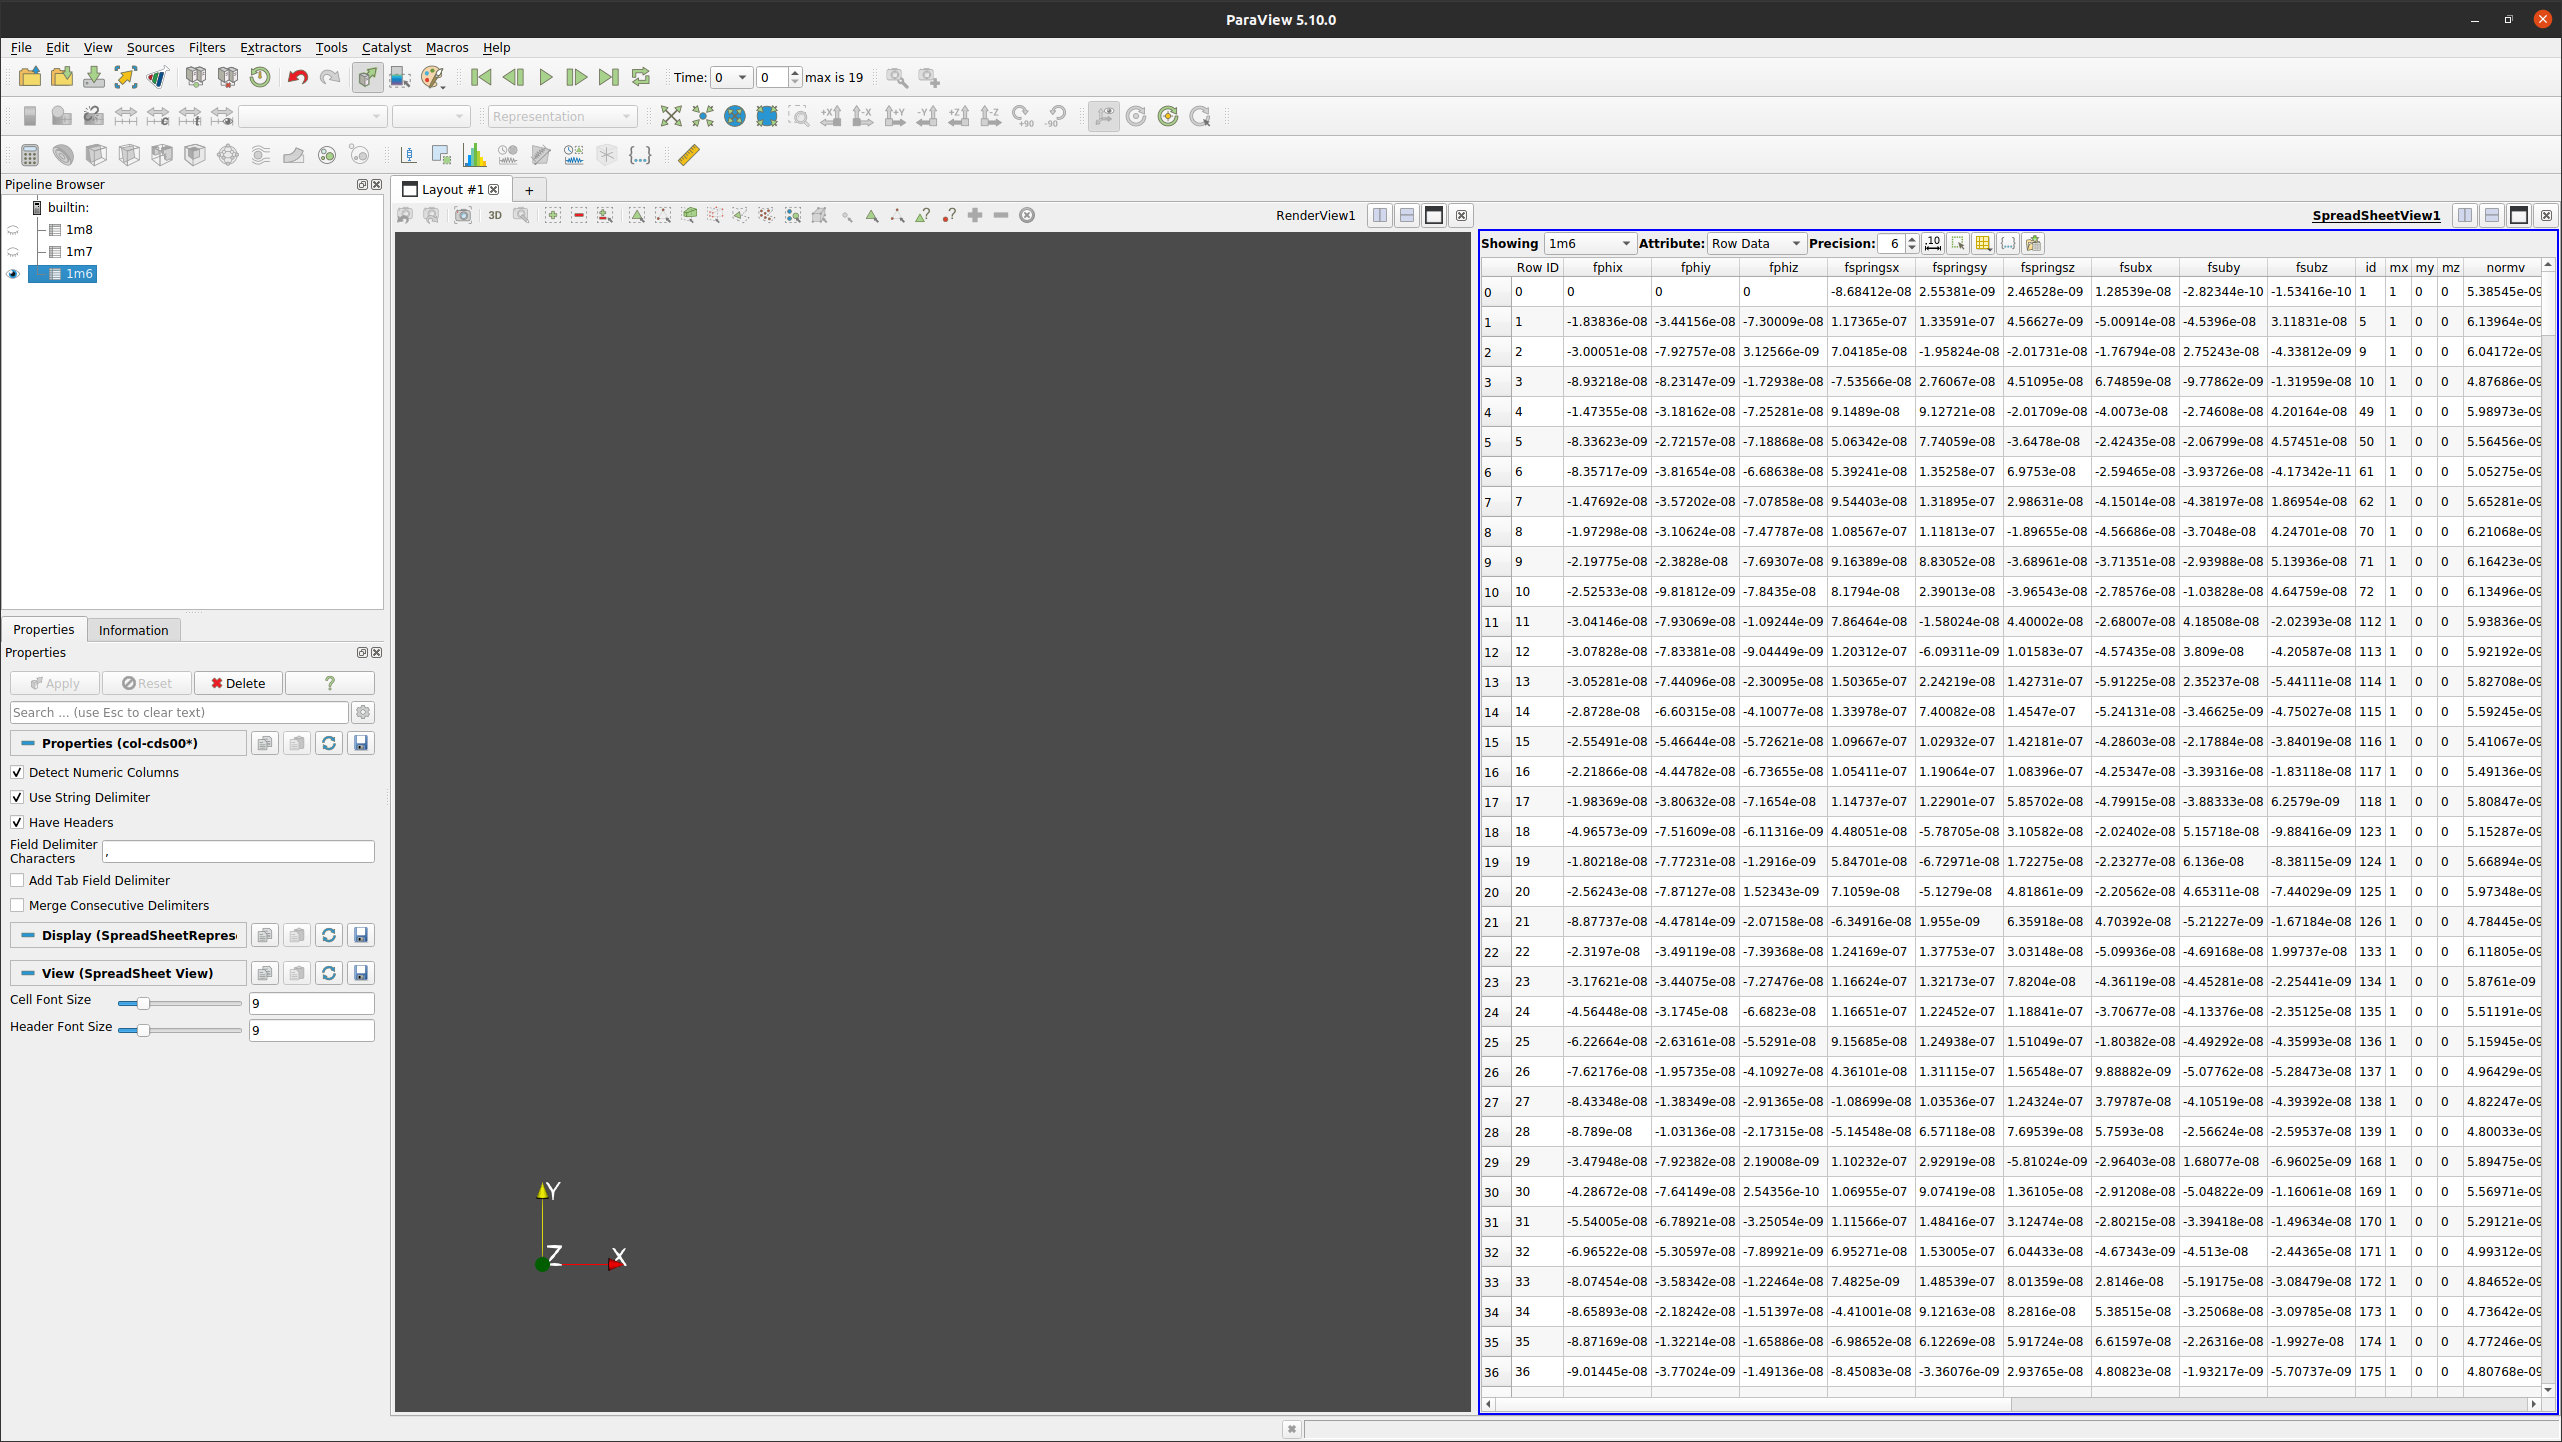
1. Import each sequence of data and rename them
1BIS. If you want to visualize the data first to understand better what I try to do, convert any sequence (e.g. 1m6) to TableToPoints using x y and z as columns.
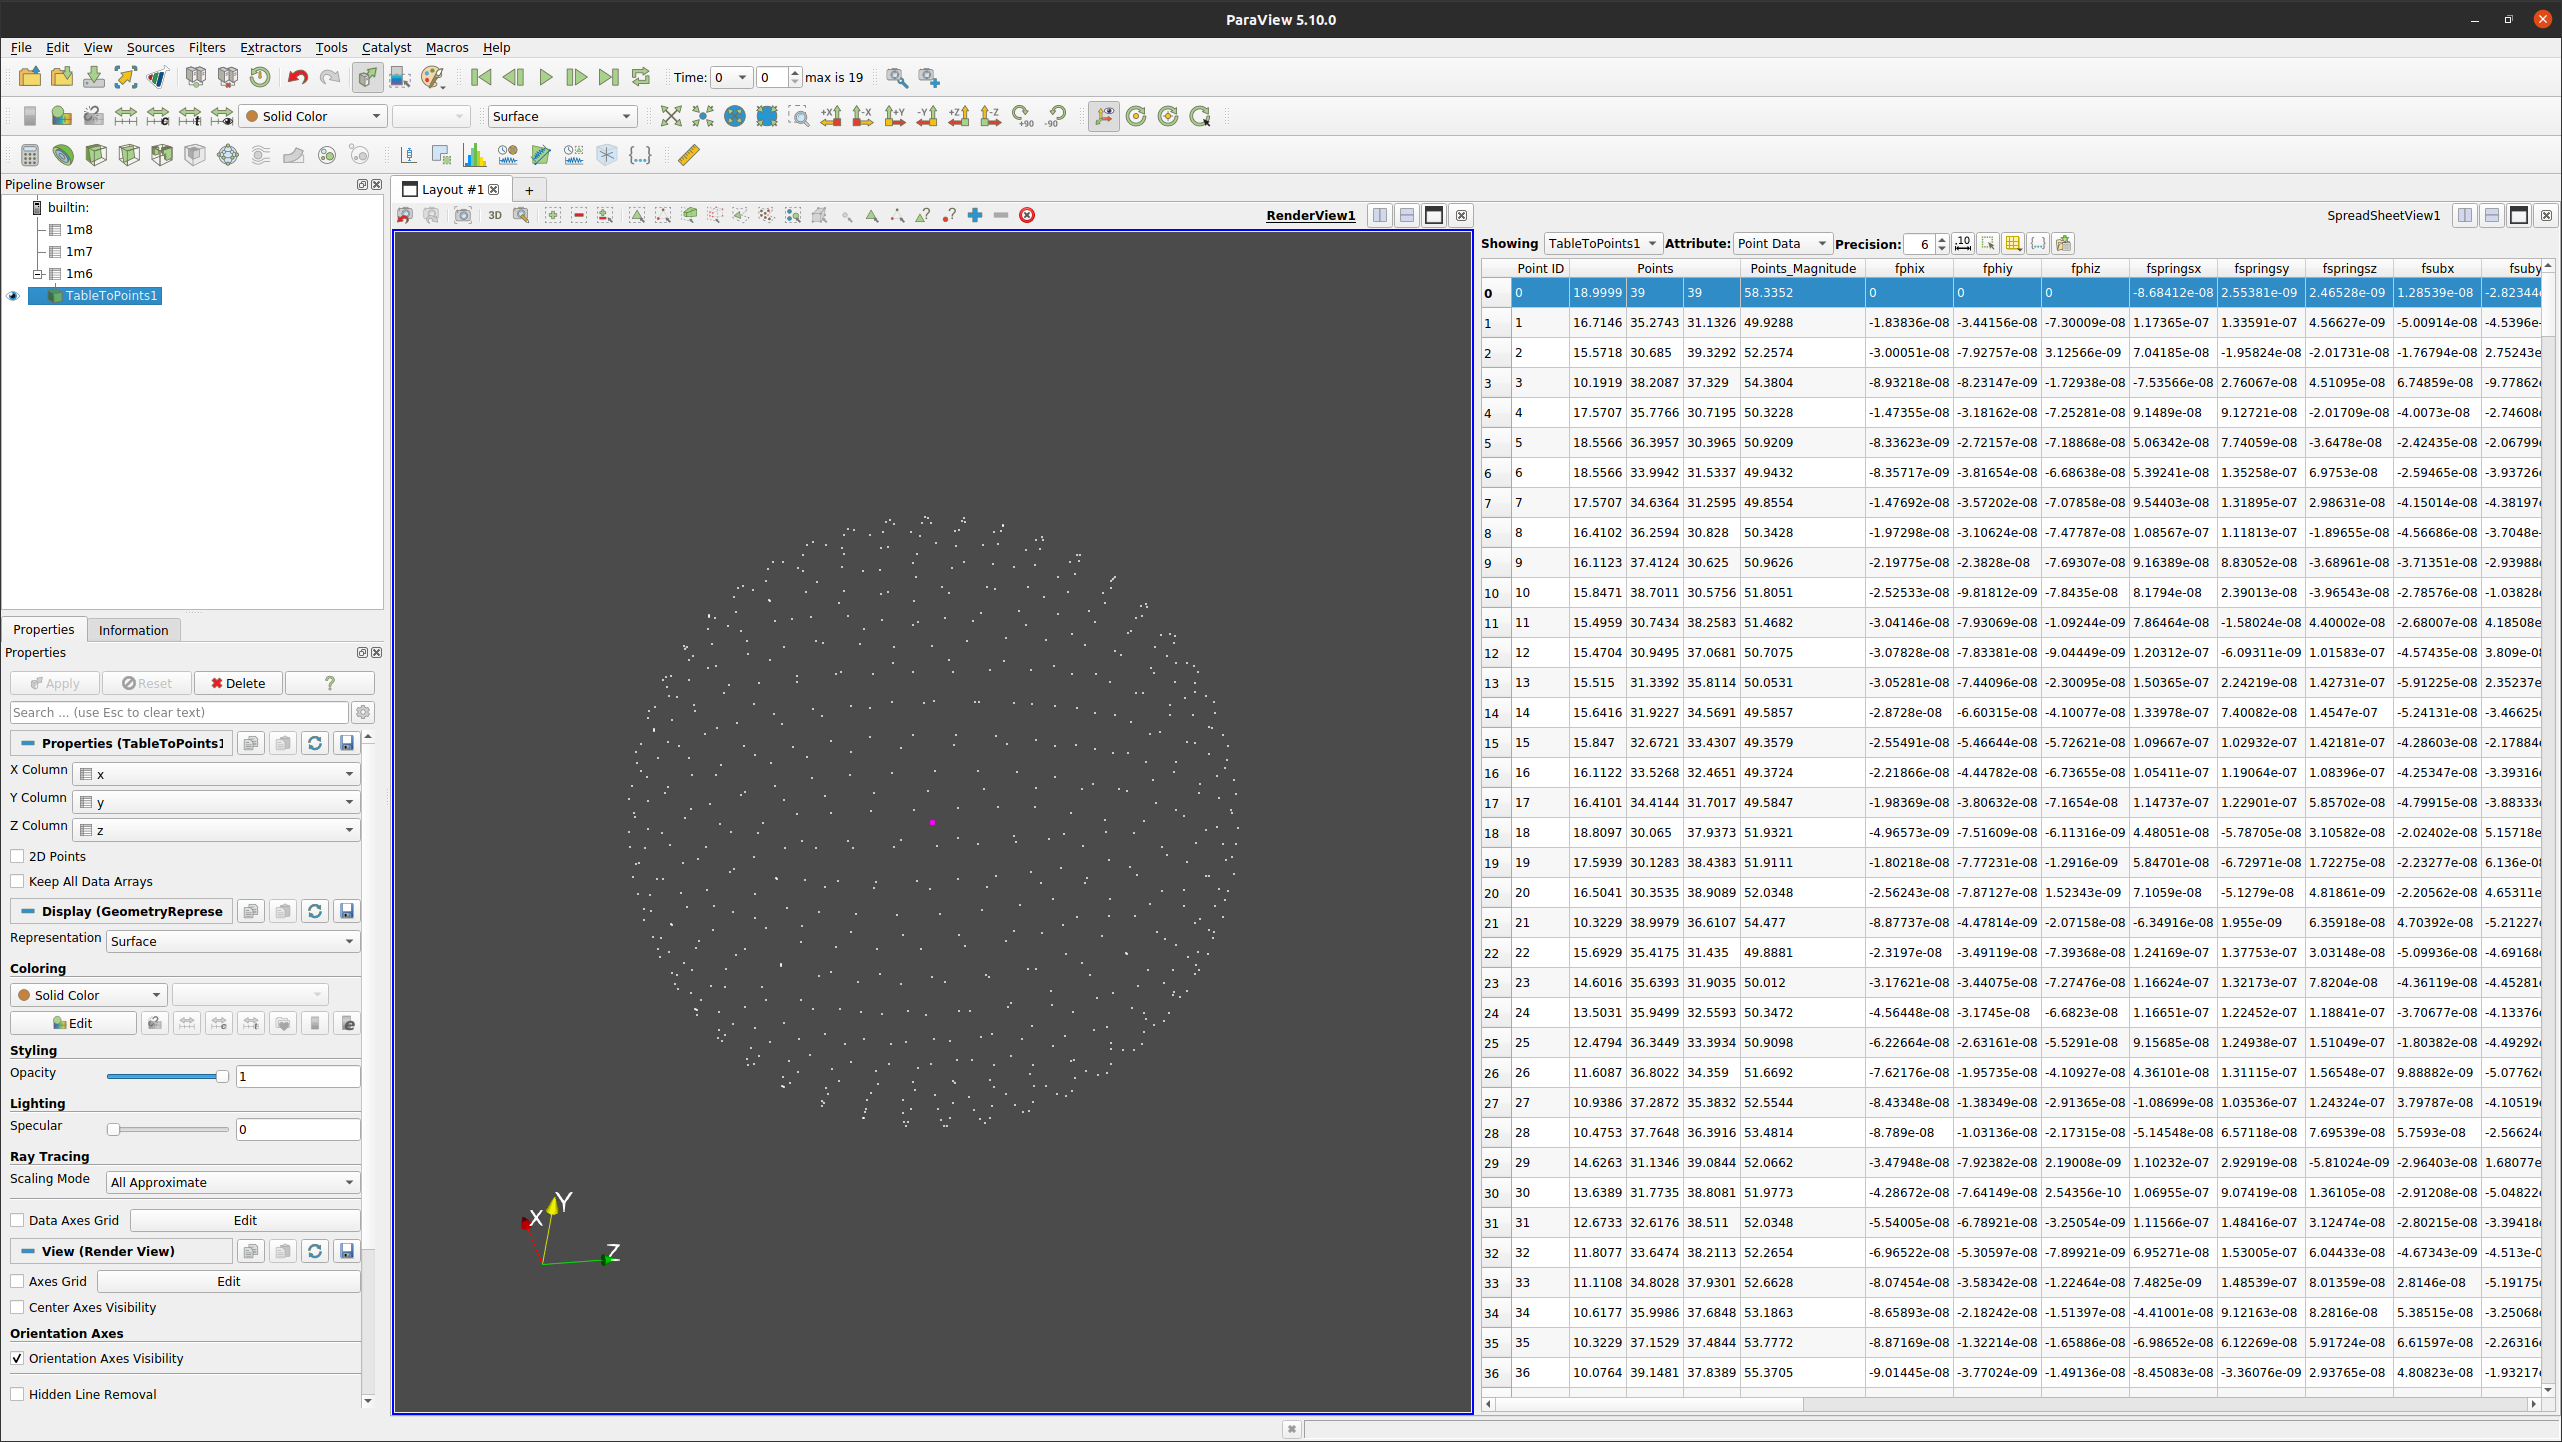
Each point of the spherical structure moves in time. I am interested in the velocity of the central point (INDEX = 1) which is highlighted in pink here.
1. Delete the TableToPoints (or ignore it) and group together the raw files
2. Filter for ID = 1 using Find Data
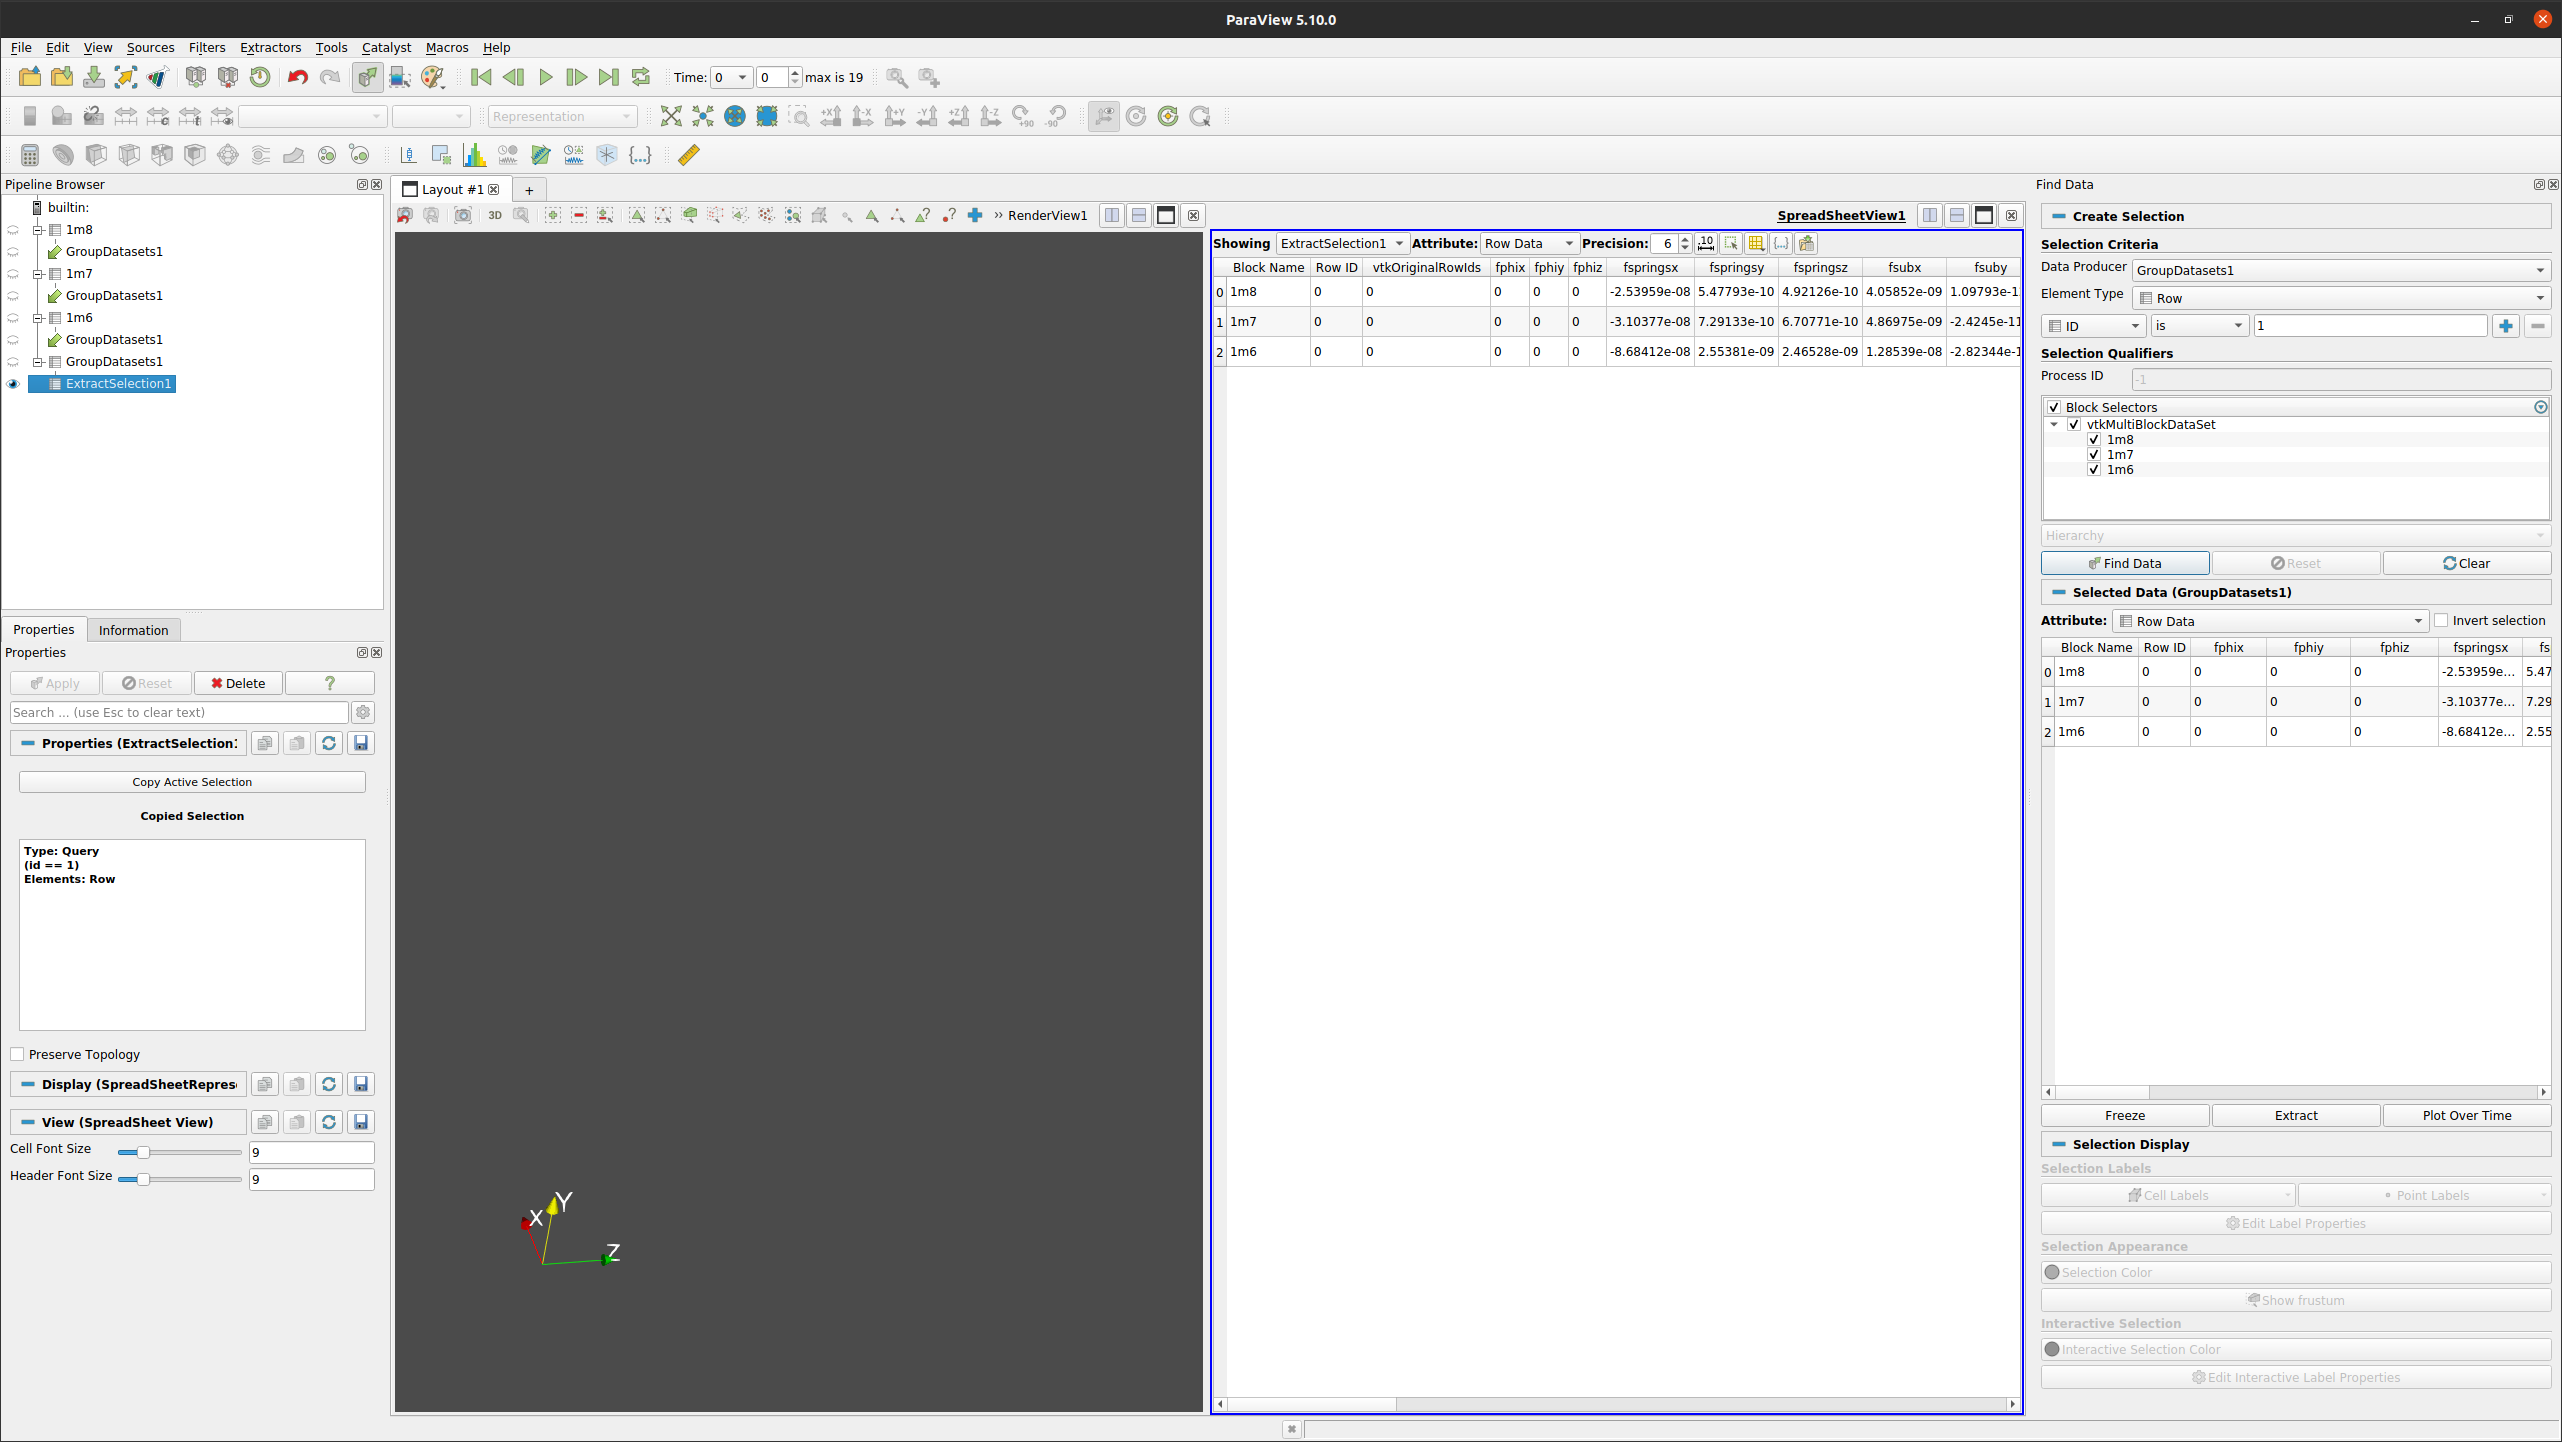
1. Plot extracted selection over time and only look at the “normv” attributes for each block, with log scales. This is what you should get

Now here is what I want to do:
I. Change the legend so that it shows Block name instead of Block number
II. Plot the steady-state velocity (aka the velocity at the last timestep as a function of the Block name)
Best,
Jérémie
---
### Author:  [@Jeremie](https://discourse.paraview.org/u/Jeremie)
#### Post date: [July 29, 2022, 2:19pm UTC](https://discourse.paraview.org/t/plot-variable-over-block-number-at-a-specific-timestep/9956/4 "2022-07-29T14:19:43Z")
I still haven’t found a way around this so any help is appreciated !
Best,
Jérémie
---
### Author:  [@mwestphal](https://discourse.paraview.org/u/mwestphal)
#### Post date: [August 8, 2022, 7:03am UTC](https://discourse.paraview.org/t/plot-variable-over-block-number-at-a-specific-timestep/9956/5 "2022-08-08T07:03:34Z")
> [@Jeremie](#):
>
> I. Change the legend so that it shows Block name instead of Block number
Sadly it looks like PlotSelectionOverTime do not consider block names, it should.
Could you open an issue on [https://gitlab.kitware.com/paraview/paraview/-/issues](https://gitlab.kitware.com/paraview/paraview/-/issues) ?
> Plot the steady-state velocity (aka the velocity at the last timestep as a function of the Block name)
Again, not out of the box as this would require merging the tables together to be able to be shown as single plot. A JoinTable filter is in developement and should let you do that, maybe in ParaView 5.11.
All that can be done using programmable filters if needed.