# Plotting a line ON TOP of a surface
**URL:** https://discourse.paraview.org/t/plotting-a-line-on-top-of-a-surface/11300
**Category:** ParaView Support
**Tags:** vtk
**Created:** [January 30, 2023, 11:34pm UTC](https://discourse.paraview.org/t/plotting-a-line-on-top-of-a-surface/11300 "2023-01-30T23:34:52Z")
**Posts on this page:** 6
**Page:** 1
### Author:  [@axelwang](https://discourse.paraview.org/u/axelwang)
#### Post date: [January 30, 2023, 11:34pm UTC](https://discourse.paraview.org/t/plotting-a-line-on-top-of-a-surface/11300/1 "2023-01-30T23:34:52Z")
Hey all,
I have been creating visualizations like below. It has two vtk files. The background wavefield+mesh is one vtk file created using
`pyvtk.UnstructuredGrid(list(zip(x, y, z)),quad=kwargs["connect"]) `
and the black line is another vtk file. Both are being displayed as “Surface”. This is what I want as the black line appears to be “on top” of the background surface and clearly visible.
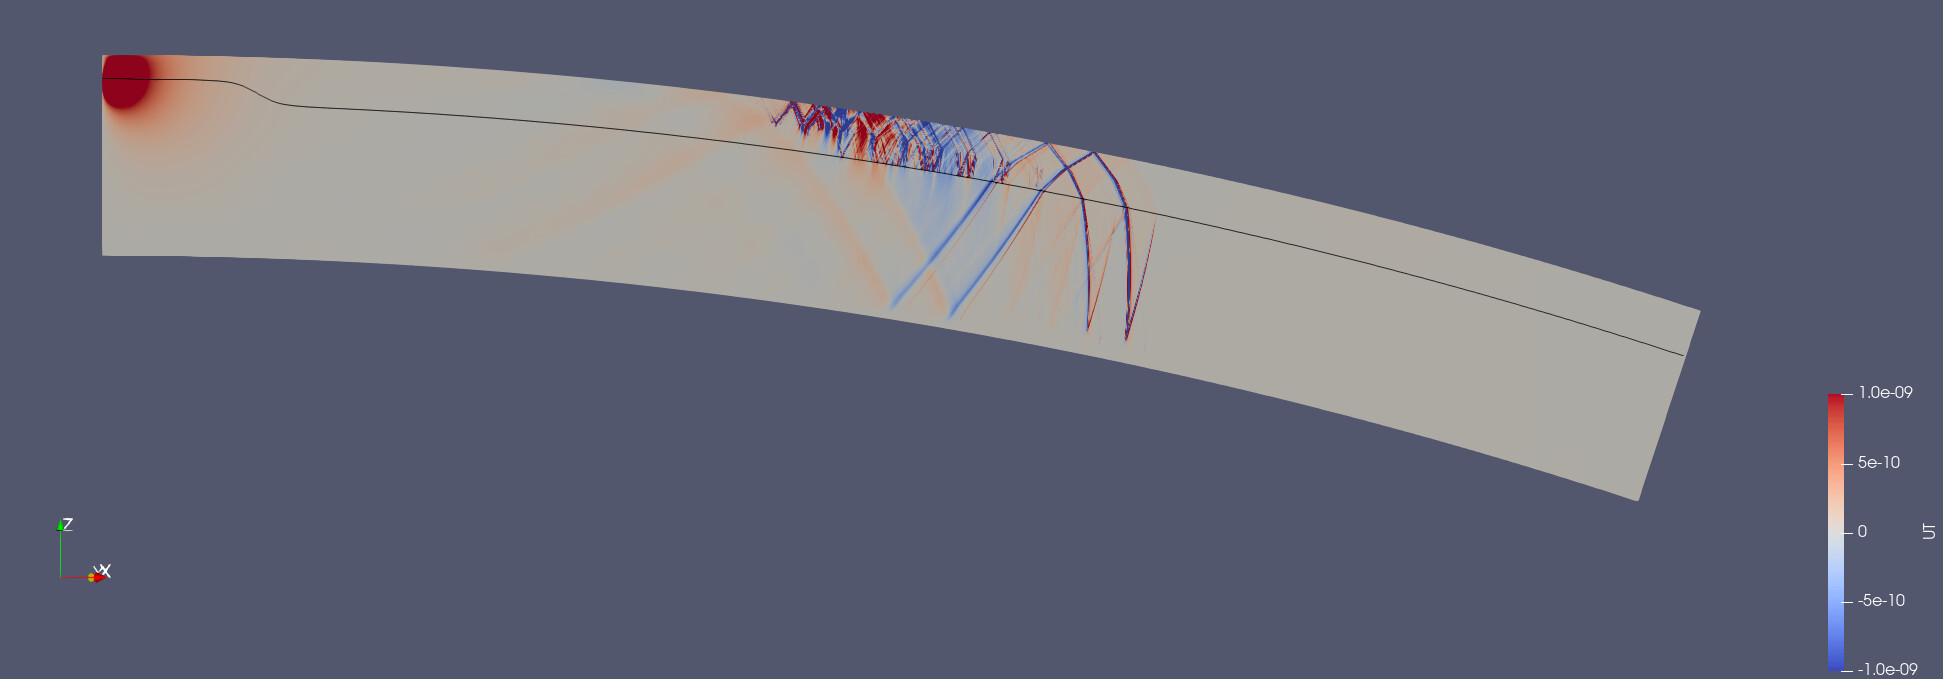
Now, I make a simple change to reduce the points needed to represent the mesh (just to make rendering faster). Hence, instead of using `quad`, I now simply use `vertex`, and I changed `connect` accordingly:
`pyvtk.UnstructuredGrid(list(zip(x, y, z)),vertex=kwargs["connect"]) `
everything seems fine, BUT, somehow the black line cannot be seen anymore!
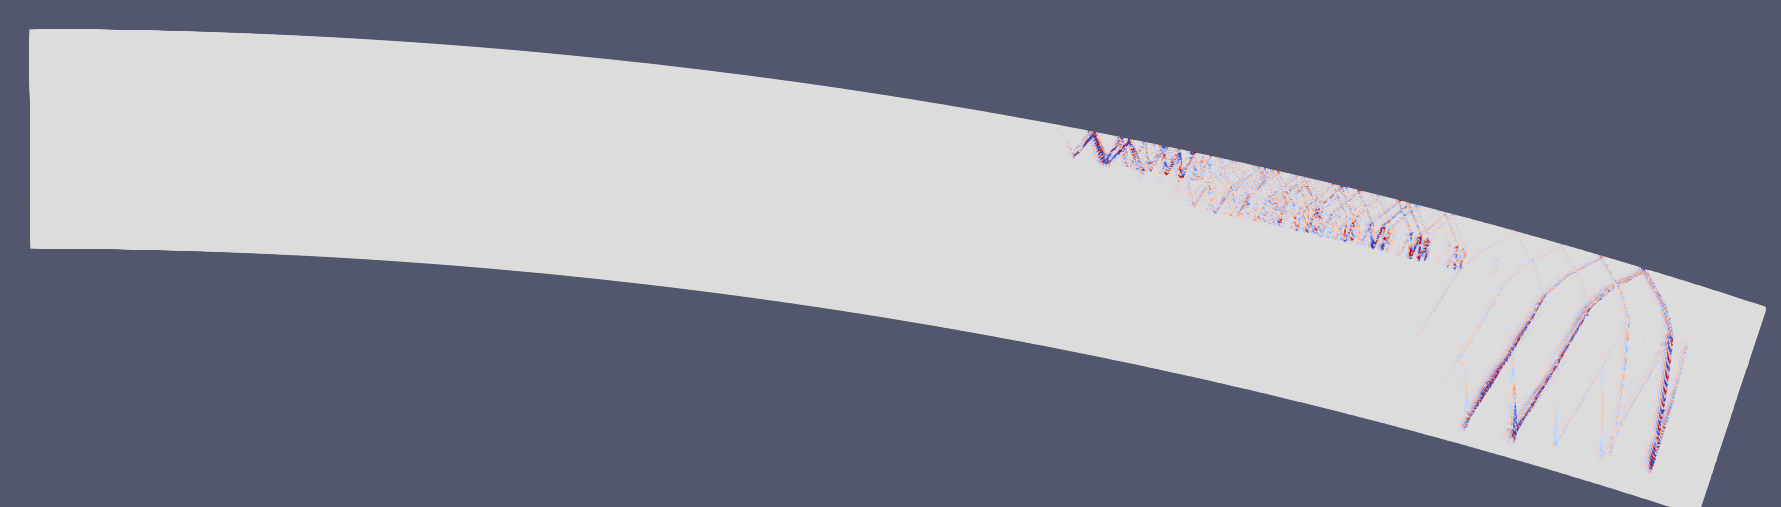
If I really zoom in, I can see it is there
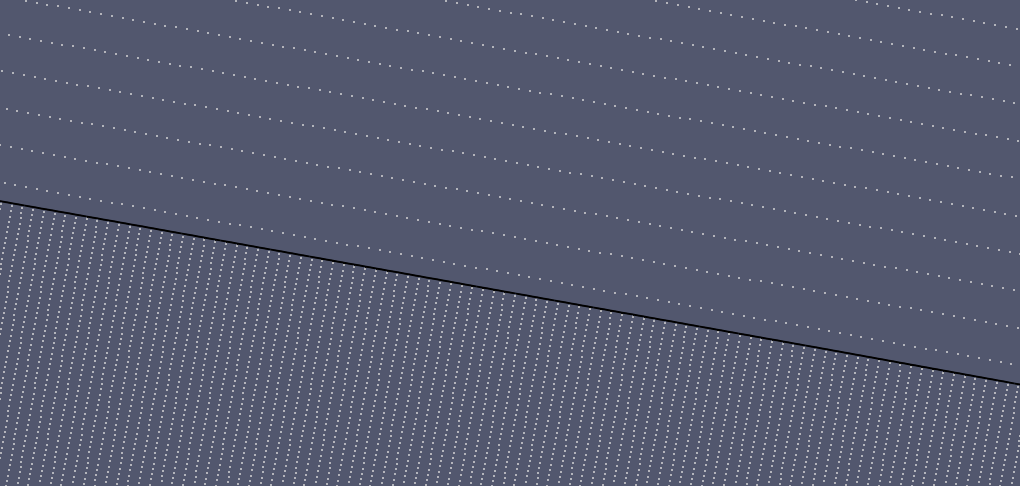
so it appears to be a line thickness issue. I then switched the line representation to wireframe, which gives me an option to increase the line thickness, but still, when zoomed out, the line is not visible, and appears to be covered by the dense points of the background mesh.
If I change the line representation to “Points”, this can be seen when zoomed out.
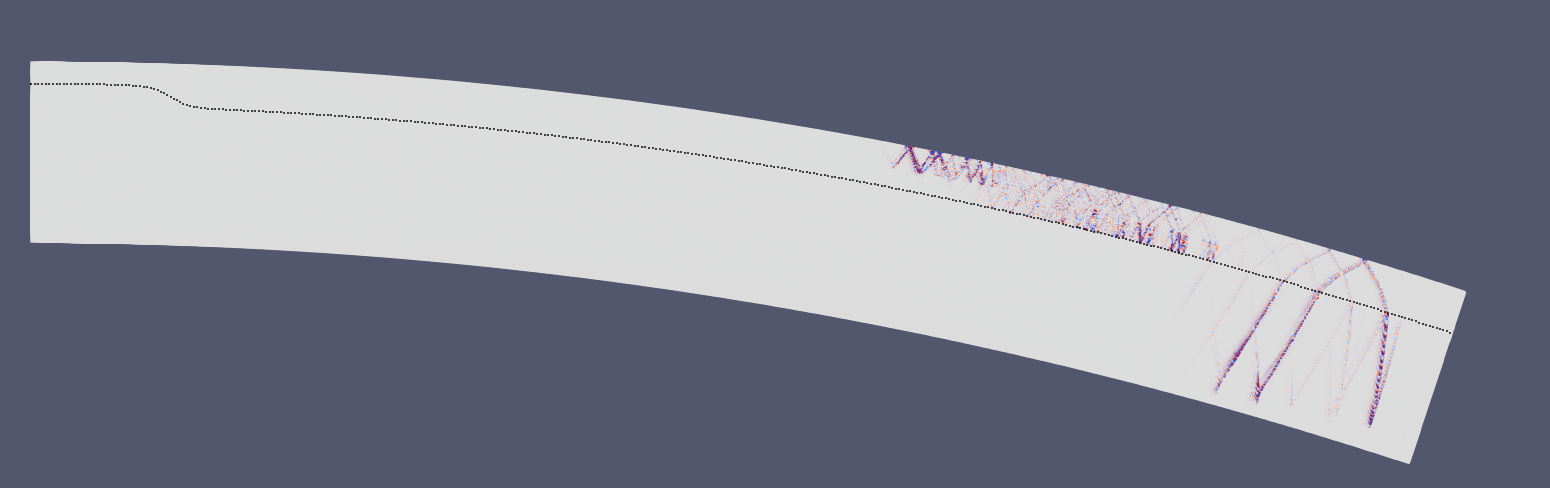
I am wondering is there a way for me to show the line on top of the mesh, when it is made of “Vertex” instead of “Quad” in Unstructured grid? Thanks!
---
### Author:  [@mwestphal](https://discourse.paraview.org/u/mwestphal)
#### Post date: [January 31, 2023, 8:11am UTC](https://discourse.paraview.org/t/plotting-a-line-on-top-of-a-surface/11300/2 "2023-01-31T08:11:07Z")
Hi @axelwang
Are you using pyvtk ?
If that is so, you may not be at the right place as this is the ParaView discourse.
You may want to open an issue there: [GitHub - pearu/pyvtk: Manupulate VTK files in Python](https://github.com/pearu/pyvtk).
Best,
---
### Author:  [@Kenneth\_Moreland](https://discourse.paraview.org/u/Kenneth_Moreland)
#### Post date: [January 31, 2023, 2:32pm UTC](https://discourse.paraview.org/t/plotting-a-line-on-top-of-a-surface/11300/3 "2023-01-31T14:32:59Z")
The problem is in the way ParaView renders items that are coincident (that is, at the same point in space). Even though you have selected things to be rendered as “surface”, ParaView uses a few tricks to render points and lines on top of polygons when they are actually in the same place in space. This is because it is common to extract point or line elements from a surface or volume, and to see them both at the same time ParaView has to do some rendering tricks to put the points and lines in the front.
The problem you are encountering is that when you write out your data as points, this trick of putting lines on top of surfaces no longer works because you are rendering points and lines. Points and lines are rendered at the same depth. There is no trick in ParaView’s rendering to put one on top of the other.
The easiest solution is probably to add the `Tube` filter to your lines with a thickness large enough for it to pop in front of the points.
---
### Author:  [@axelwang](https://discourse.paraview.org/u/axelwang)
#### Post date: [January 31, 2023, 7:17pm UTC](https://discourse.paraview.org/t/plotting-a-line-on-top-of-a-surface/11300/4 "2023-01-31T19:17:46Z")
Hey Mathieu,
Yes. I am indeed using pyvtk. Thanks for letting me know about the other channel.
---
### Author:  [@axelwang](https://discourse.paraview.org/u/axelwang)
#### Post date: [January 31, 2023, 7:47pm UTC](https://discourse.paraview.org/t/plotting-a-line-on-top-of-a-surface/11300/5 "2023-01-31T19:47:28Z")
Thanks! What you said makes a lot of sense. I have tried to play with the tube option, but the even when the tube is the thickest the line only pops out at the ends of the point cloud, but it’s not visible where it’s covered by the point cloud. I guess I have to revert back to making actual surfaces rather than just point cloud.
---
### Author:  [@axelwang](https://discourse.paraview.org/u/axelwang)
#### Post date: [January 31, 2023, 8:43pm UTC](https://discourse.paraview.org/t/plotting-a-line-on-top-of-a-surface/11300/6 "2023-01-31T20:43:23Z")
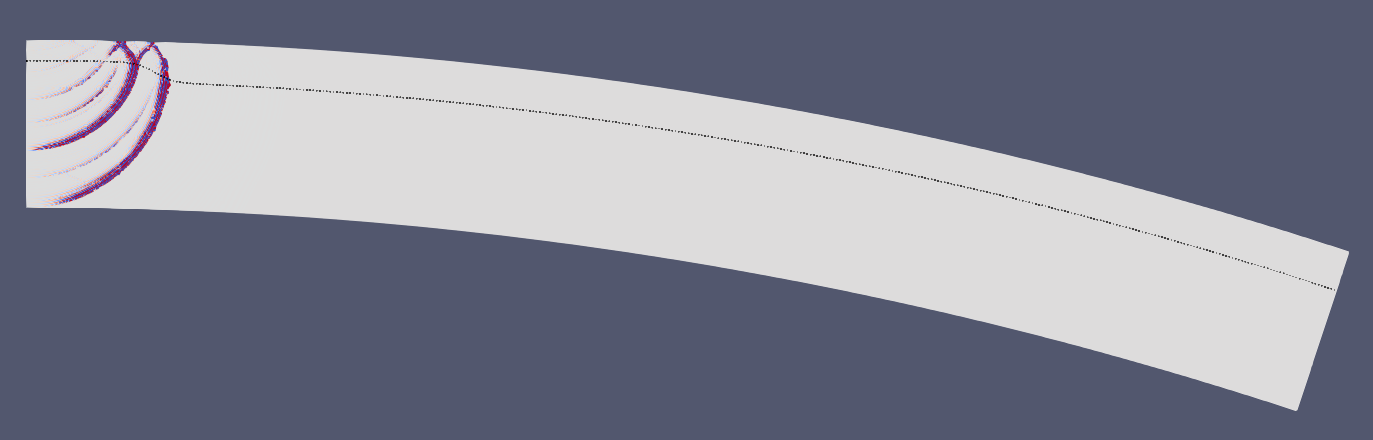


I personally think probably the easiest way is to display the “line” as points but fiddle with the point sizes. You can actually get it to look like a dotted, dashed or continuous line, but of course you can’t independently set the line thickness here.