# plotting data along curve
**URL:** https://discourse.paraview.org/t/plotting-data-along-curve/15662
**Category:** ParaView Support
**Created:** [October 30, 2024, 8:53pm UTC](https://discourse.paraview.org/t/plotting-data-along-curve/15662 "2024-10-30T20:53:45Z")
**Posts on this page:** 5
**Page:** 1
### Author:  [@dim14](https://discourse.paraview.org/u/dim14)
#### Post date: [October 30, 2024, 8:53pm UTC](https://discourse.paraview.org/t/plotting-data-along-curve/15662/1 "2024-10-30T20:53:45Z")
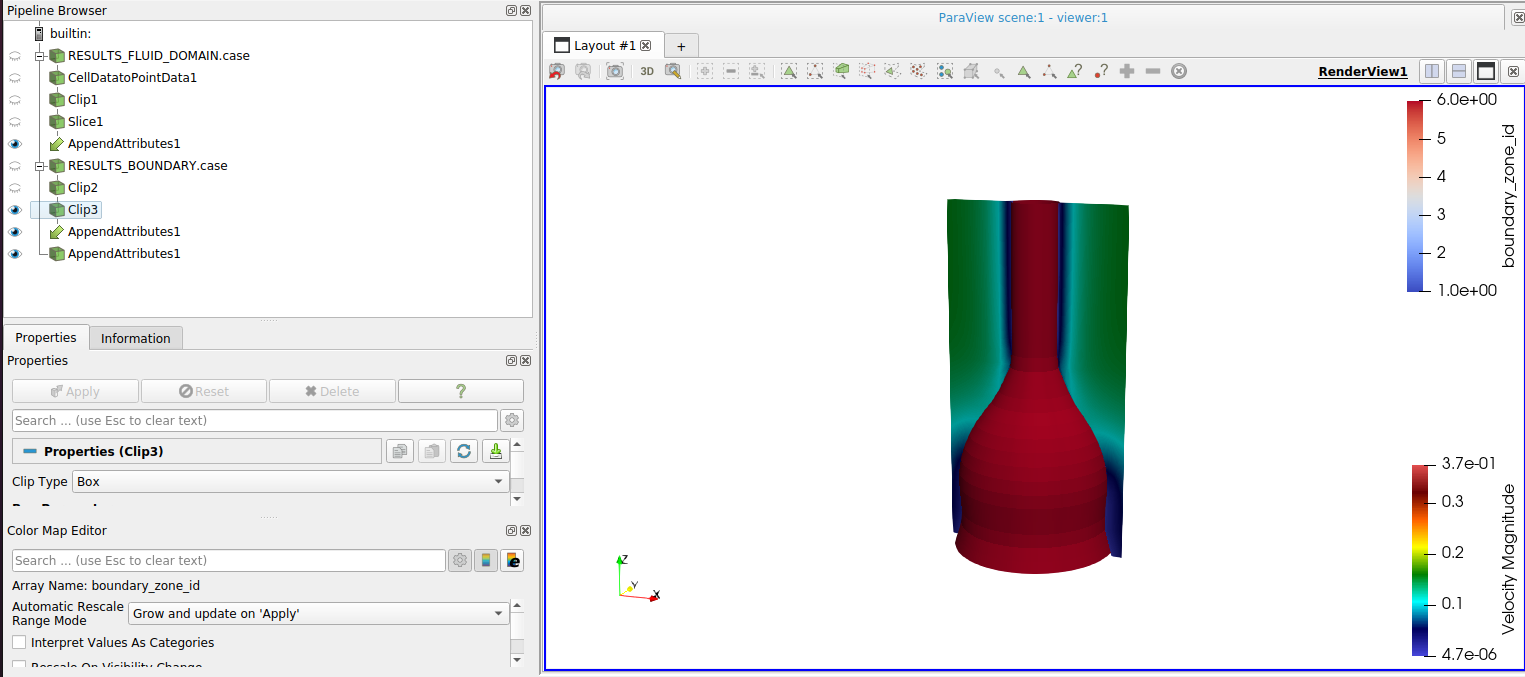
Hello, I’d liked to plot magnitude velocity along a boundary curve. As shown on the attached picture, i’d liked to plot this data at the intersection between red surface and the fluid slice. i was thinking a filter as plot over line but i can’t manage to create this intersection curve
Regards
---
### Author:  [@cory.quammen](https://discourse.paraview.org/u/cory.quammen)
#### Post date: [October 30, 2024, 9:23pm UTC](https://discourse.paraview.org/t/plotting-data-along-curve/15662/2 "2024-10-30T21:23:24Z")
The **Plot on Intersection Curves** filter may help out here.
---
### Author:  [@dim14](https://discourse.paraview.org/u/dim14)
#### Post date: [October 30, 2024, 9:40pm UTC](https://discourse.paraview.org/t/plotting-data-along-curve/15662/3 "2024-10-30T21:40:19Z")
Hello thanks for help
But i don’t think that will work cause this filter use only box, cylinder plane sphere shapes
Regarding my problem i need to extract data on red shape boundary which can be intersect with box or cylinder and so on
---
### Author:  [@cory.quammen](https://discourse.paraview.org/u/cory.quammen)
#### Post date: [October 31, 2024, 1:53am UTC](https://discourse.paraview.org/t/plotting-data-along-curve/15662/4 "2024-10-31T01:53:44Z")
I guess I’m not sure what you are trying to do then. The plane intersection the shape will result in a curve with data values that you can then plot. **Plot on Intersection Curves** computes the curve and takes care of the plotting. See the example below:
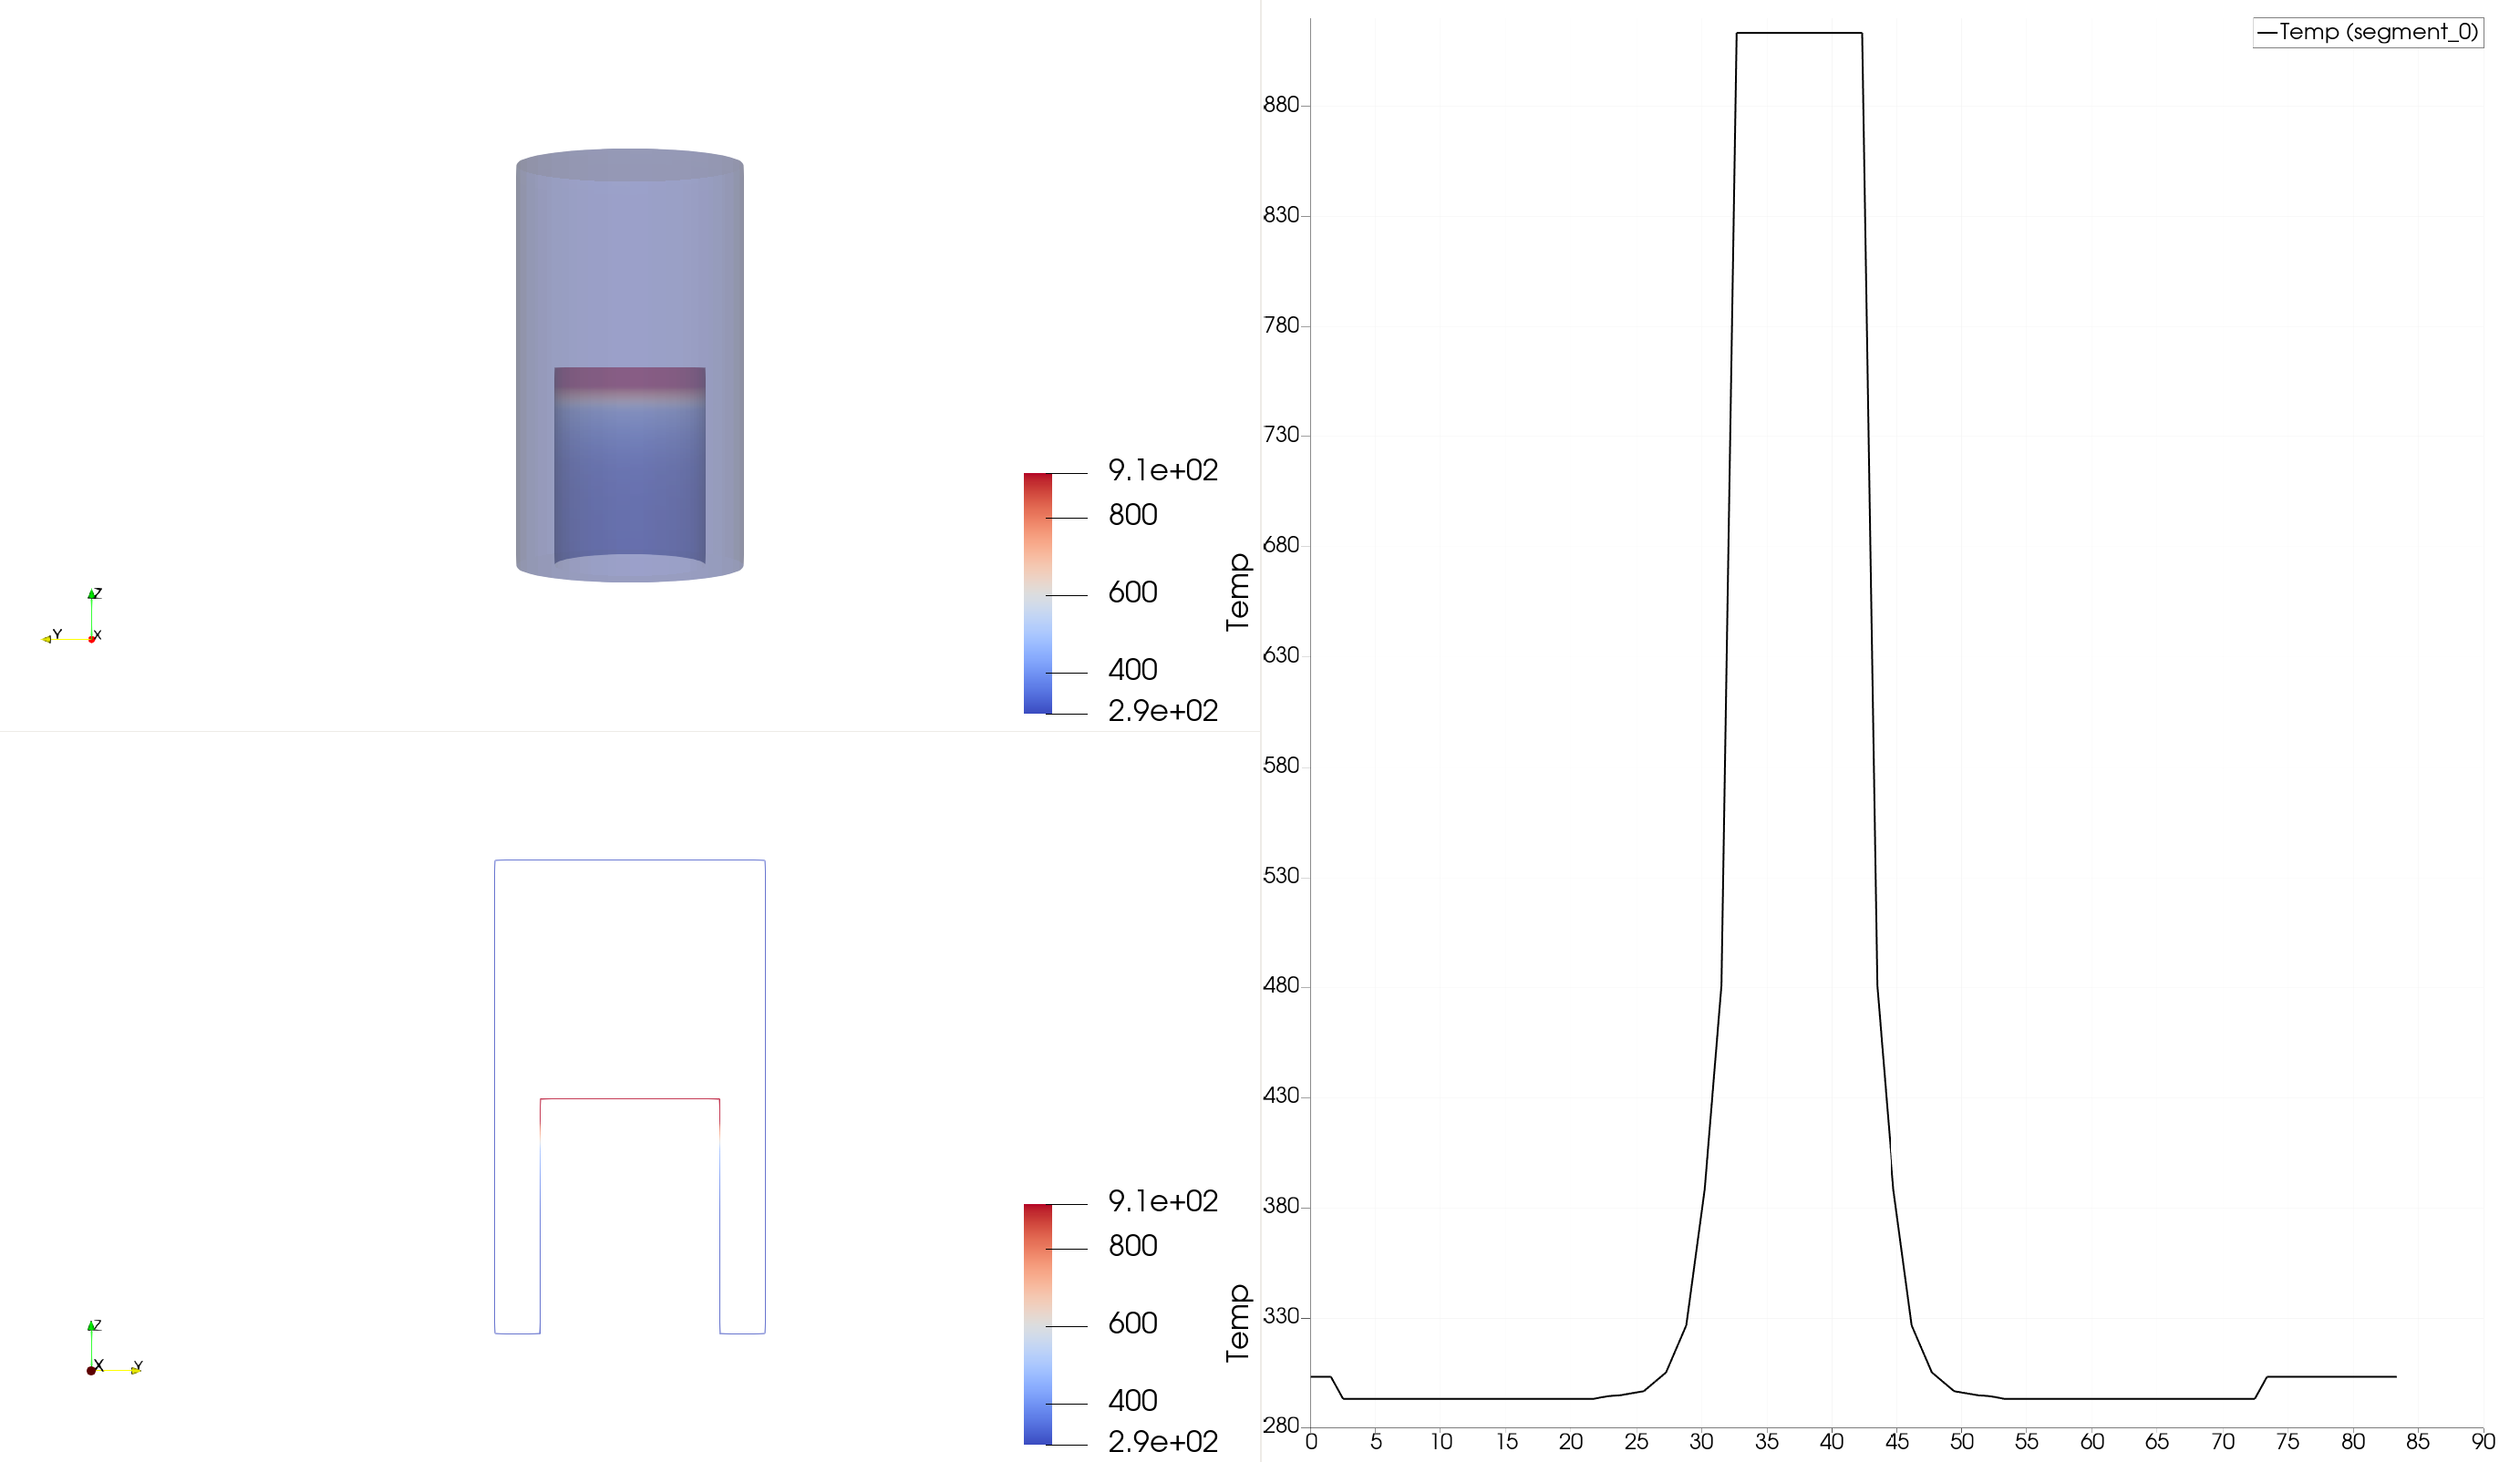
In the upper left is a geometry, the example disk\_out\_ref.ex2 file that is distributed with ParaView. In the lower left is the intersection of the geometry with a plane, colored by Temp. On the right is a plot of Temp following the curve, which starts at the top left corner of the intersection curve and proceeds counter-clockwise around it. The x-axis is arc length around the intersection and the y-axis is temperature.
Apologies if I’m misunderstanding what you are looking for.
---
### Author:  [@dim14](https://discourse.paraview.org/u/dim14)
#### Post date: [October 31, 2024, 12:40pm UTC](https://discourse.paraview.org/t/plotting-data-along-curve/15662/5 "2024-10-31T12:40:12Z")
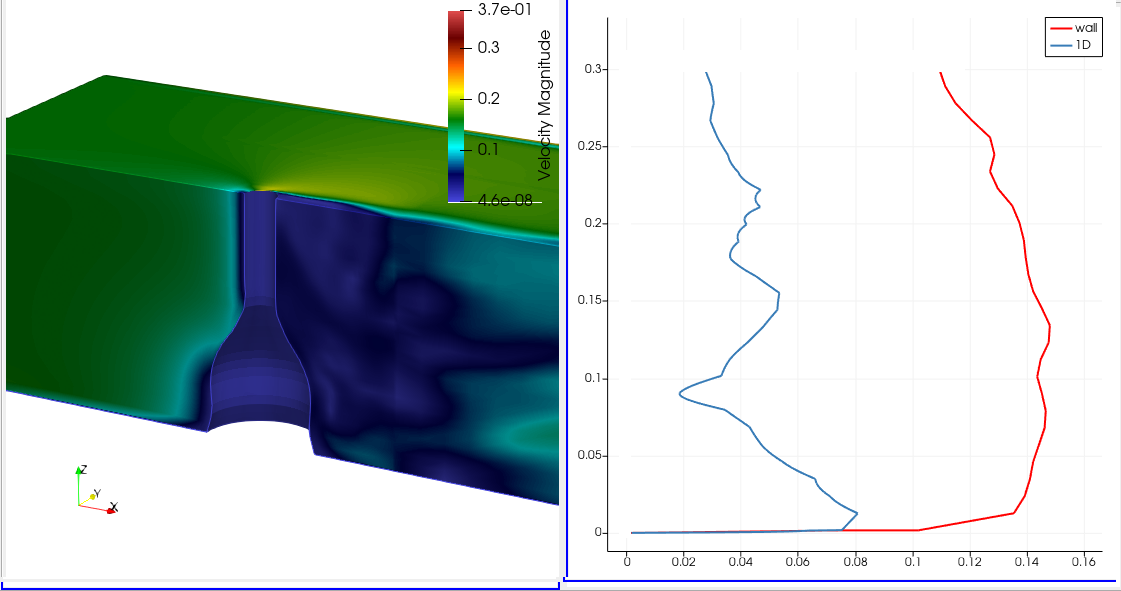
Thanks, you were right it works perfectly :
Thanks a lot
Regards