# Plotting integrated values over time
**URL:** https://discourse.paraview.org/t/plotting-integrated-values-over-time/13617
**Category:** ParaView Support
**Tags:** python
**Created:** [December 30, 2023, 7:50pm UTC](https://discourse.paraview.org/t/plotting-integrated-values-over-time/13617 "2023-12-30T19:50:12Z")
**Posts on this page:** 20
**Page:** 1
### Author:  [@primer](https://discourse.paraview.org/u/primer)
#### Post date: [December 30, 2023, 7:50pm UTC](https://discourse.paraview.org/t/plotting-integrated-values-over-time/13617/1 "2023-12-30T19:50:12Z")
Hi,
I see that a number of posts exists concerning this topic but I do not see anything that I can use. I can calculate the force on an object by integrating the pressure over a surface over time. I can not understand how to use the plot over time feature. Below is a script where I write out a csv file for each time step and plot this data outside of paraview. Very awkward.
How can I plot directly with paraview?
I have tried to access the individual cells in a spreadsheet in a script but it appears not readily done. Can you provide any guidance on this?
I can access the integrated values for a time step using this
x=integrateVariables1.CellData
y=x.GetArray(‘Result’)
in an attempt to get the desired data but this is awkward too.
Can one assign data to a cell in a spreadsheet manually?
Any thoughts regarding this is much appreciated.
```auto
#### import the simple module from the paraview
from paraview.simple import *
#### disable automatic camera reset on 'Show'
paraview.simple._DisableFirstRenderCameraReset()
# create a new OpenFOAMReader
pfoam = OpenFOAMReader(FileName=r'pv.foam')
pfoam.CaseType = 'Decomposed Case'
pfoam.Decomposepolyhedra = 0
# get active view
renderView1 = GetActiveViewOrCreate('RenderView')
renderView1.ResetActiveCameraToPositiveY()
# reset view to fit data
renderView1.ResetCamera()
# create a new 'Clean to Grid'
cleantoGrid1 = CleantoGrid(Input=pfoam)
# show data in view
cleantoGrid1Display = Show(cleantoGrid1, renderView1)
# hide data in view
Hide(pfoam, renderView1)
# get color transfer function/color map for 'U'
ULUT = GetColorTransferFunction('U')
# trace defaults for the display properties.
cleantoGrid1Display.ColorArrayName = ['POINTS', 'U']
cleantoGrid1Display.LookupTable = ULUT
cleantoGrid1Display.EdgeColor = [0.0, 0.0, 0.5]
cleantoGrid1Display.ScalarOpacityUnitDistance = 0.05
# get animation scene
animationScene1 = GetAnimationScene()
# update animation scene based on data timesteps
animationScene1.UpdateAnimationUsingDataTimeSteps()
# go to the final timestep of the simulation
timesteps = pfoam.TimestepValues
finalTime = timesteps[-1]
animationScene1.AnimationTime = finalTime
# rescale color and/or opacity maps used to exactly fit the current data range
cleantoGrid1Display.RescaleTransferFunctionToDataRange(False, True)
# update the view to ensure updated data information
renderView1.Update()
# reset view to fit data
renderView1.ResetCamera(False)
#### disable automatic camera reset on 'Show'
paraview.simple._DisableFirstRenderCameraReset()
spreadSheetView1 = GetActiveViewOrCreate('SpreadSheetView')
extractBlock1 = ExtractBlock(registrationName='ExtractBlock1', Input=cleantoGrid1)
extractBlock1.Selectors = ['/Root']
extractSurface1 = ExtractSurface(registrationName='ExtractSurface1', Input=extractBlock1)
generateSurfaceNormals1 = GenerateSurfaceNormals(registrationName='GenerateSurfaceNormals1', Input=extractSurface1)
generateSurfaceNormals1.ComputeCellNormals = 1
calculator1 = Calculator(registrationName='Calculator1', Input=generateSurfaceNormals1)
calculator1.AttributeType = 'Cell Data'
calculator1.Function = 'p*Normals_X'
integrateVariables1 = IntegrateVariables(registrationName='IntegrateVariables1', Input=calculator1)
integrateVariables1Display = Show(integrateVariables1, spreadSheetView1, 'SpreadSheetRepresentation')
spreadSheetView1.FieldAssociation = 'Cell Data'
spreadSheetView1.Update()
spreadSheetView1.HiddenColumnLabels = ['Cell ID', 'alphat', 'Area', 'Cell Type', 'k', 'Ma', 'Normals', 'Normals_Magnitude', 'nut', 'p', 'pseudoCoField', 'rho', 'T', 'U', 'U_Magnitude']
x=integrateVariables1.CellData
y=x.GetArray('Result')
print(y.GetRange(0)[0])
# get animation scene
animationScene1 = GetAnimationScene()
#for i in range(len(timesteps)):
for i in range(5):
animationScene1.AnimationTime = timesteps[i]
ExportView(str(timesteps[i])+'_f.csv', view=spreadSheetView1)
```
---
### Author:  [@mwestphal](https://discourse.paraview.org/u/mwestphal)
#### Post date: [January 2, 2024, 9:21am UTC](https://discourse.paraview.org/t/plotting-integrated-values-over-time/13617/2 "2024-01-02T09:21:36Z")
Use the “LineChartView”
---
### Author:  [@primer](https://discourse.paraview.org/u/primer)
#### Post date: [January 3, 2024, 12:45am UTC](https://discourse.paraview.org/t/plotting-integrated-values-over-time/13617/3 "2024-01-03T00:45:27Z")
Hi Mathieu,
Thank you for replying but I am still lost. I activate the view, specify the attribute type to “cell data”. Select series parameters to the integrated force parameter “Result”. But no data is available. I get this error
ERROR: In vtkContext2D.cxx, line 176
vtkContext2D (0x270880d0): Attempted to paint a line with \<2 points.
I can not find anything in the docs pertaining to this. Perhaps I missed it.
[https://docs.paraview.org/en/v5.11.1/Tutorials/ClassroomTutorials/beginningPlotting.html](https://docs.paraview.org/en/v5.11.1/Tutorials/ClassroomTutorials/beginningPlotting.html)
or
[https://docs.paraview.org/en/v5.11.1/Tutorials/ClassroomTutorials/targetedComputationFluidDynamics.html](https://docs.paraview.org/en/v5.11.1/Tutorials/ClassroomTutorials/targetedComputationFluidDynamics.html)
Thank you in advance for additional guidance.
Primer
---
### Author:  [@mwestphal](https://discourse.paraview.org/u/mwestphal)
#### Post date: [January 3, 2024, 8:40am UTC](https://discourse.paraview.org/t/plotting-integrated-values-over-time/13617/4 "2024-01-03T08:40:21Z")
Please share your data just before plotting (eg, the .csv files).
---
### Author:  [@primer](https://discourse.paraview.org/u/primer)
#### Post date: [January 3, 2024, 6:58pm UTC](https://discourse.paraview.org/t/plotting-integrated-values-over-time/13617/5 "2024-01-03T18:58:05Z")
Hi,
A couple of thoughts.
I had originally generated cvs files with the desired information since I plotted the data outside of paraview. I knew no other way. I consider this approach awkward.
It would be cleaner if paraview could plot this data with out creating individual cvs files for each time step.
Ideally, I would like to create a pipeline so I would not have to create a cvs file (one data point per time step) for each time step. Does paraview allow the creation of an array or spreadsheet which would contain all the calculated force values for each time step?
Your comment about “sharing the data before plotting” is reasonable but I have no clue how to acheive this based upon the documentation and examples I have seen. Can you please provide insight one how to do this or provide a link illustrating this?
Thanks.
primer
---
### Author:  [@mwestphal](https://discourse.paraview.org/u/mwestphal)
#### Post date: [January 4, 2024, 10:43am UTC](https://discourse.paraview.org/t/plotting-integrated-values-over-time/13617/6 "2024-01-04T10:43:37Z")
> [@primer](#):
>
> Ideally, I would like to create a pipeline so I would not have to create a cvs file
Of course
> Your comment about “sharing the data before plotting” is reasonable but I have no clue how to acheive
- Select the data you want to plot in the pipeline browser
- File → SaveData
Alternatively, share your original data and a statefile.
---
### Author:  [@primer](https://discourse.paraview.org/u/primer)
#### Post date: [January 8, 2024, 2:24pm UTC](https://discourse.paraview.org/t/plotting-integrated-values-over-time/13617/7 "2024-01-08T14:24:29Z")
Thank you for your advice.
primer
---
### Author:  [@primer](https://discourse.paraview.org/u/primer)
#### Post date: [January 14, 2024, 8:35pm UTC](https://discourse.paraview.org/t/plotting-integrated-values-over-time/13617/8 "2024-01-14T20:35:12Z")
I have posted in the recent past to get advice on plotting calculated force values in paraview.
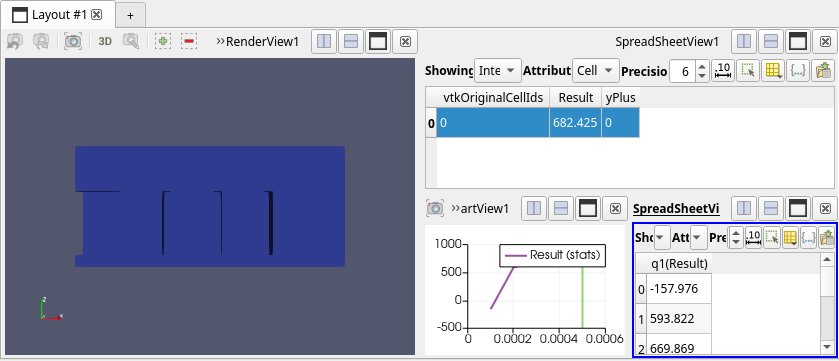
I have now realized that if I select data from the integrated results presented in a spreadsheet view that I can use the filter “Plot Selection Over Time” to acheive the desired result. I can also write the plotted values to disk.
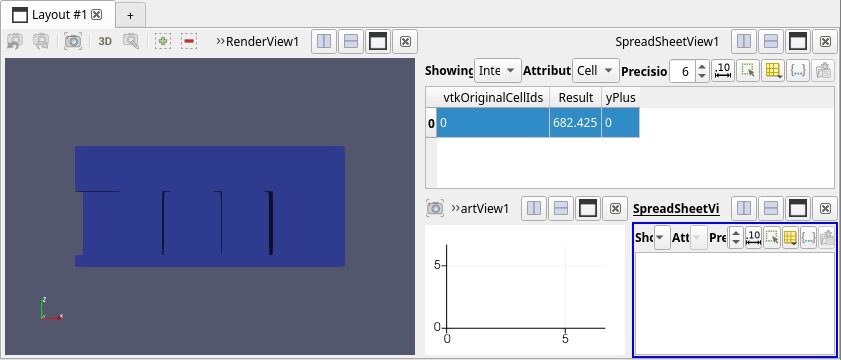
However, when I trace the manual steps, the resulting output does not reflect all the necessary components. For instance, the resulting script generates an error indicating that “plotSelectionOverTime1” is not defined. Defining this variable as “plotSelectionOverTime1 = PlotSelectionOverTime(Input=integrateVariables1)” removes the error but I can not achieve in the script what I am able to achieve manually.
I am using paraview 5.11.1. Do you have any advice or can you direct me to any references that might assist me?
Thank you.
primer
---
### Author:  [@mwestphal](https://discourse.paraview.org/u/mwestphal)
#### Post date: [January 16, 2024, 9:13am UTC](https://discourse.paraview.org/t/plotting-integrated-values-over-time/13617/9 "2024-01-16T09:13:48Z")
please share your faulty script
---
### Author:  [@primer](https://discourse.paraview.org/u/primer)
#### Post date: [January 16, 2024, 12:26pm UTC](https://discourse.paraview.org/t/plotting-integrated-values-over-time/13617/10 "2024-01-16T12:26:56Z")
Hi,
Thank you for looking at the script. Included are two images showing the results of manually selecting the data and using the “Plot selection over time” filter and the other from running the script generated from the “script tool”.
[pvScript\_force.py](https://discourse.paraview.org/uploads/short-url/eTQOc3GvTqPb763lAogw72JGVil.py) (22.7 KB)
primer
---
### Author:  [@mwestphal](https://discourse.paraview.org/u/mwestphal)
#### Post date: [January 16, 2024, 12:28pm UTC](https://discourse.paraview.org/t/plotting-integrated-values-over-time/13617/11 "2024-01-16T12:28:31Z")
> [@primer](#):
>
> plotSelectionOverTime1
Indeed plotSelectionOverTime1 is missing, how did you generate this script ?
---
### Author:  [@primer](https://discourse.paraview.org/u/primer)
#### Post date: [January 16, 2024, 2:35pm UTC](https://discourse.paraview.org/t/plotting-integrated-values-over-time/13617/12 "2024-01-16T14:35:11Z")
Hi,
I cut and past a base script into the python shell the code with read the data and generated the integrated data. I then turned on the trace feature followed by manually selecting the data and using the Plot Selection Over Time filter followed by opening a spreadsheet to obtain the plotted data.
I then took the trace information and appended it to the base script. This final script is what I sent to you.
Running this script fails. I attempted to correct the script but defining the missing variable as
plotSelectionOverTime1 = PlotSelectionOverTime(Input=integrateVariables1)
This corrected missing variable error but the desired result was not generated. I assume more is missing but I am unsure what else is required.
Thanks.
primer
---
### Author:  [@mwestphal](https://discourse.paraview.org/u/mwestphal)
#### Post date: [January 16, 2024, 2:39pm UTC](https://discourse.paraview.org/t/plotting-integrated-values-over-time/13617/13 "2024-01-16T14:39:09Z")
> [@primer](#):
>
> I then turned on the trace feature followed by manually selecting the data and using the Plot Selection Over Time filter followed by opening a spreadsheet to obtain the plotted data.
Instead of using the trace mechanism, just File → SaveState (python) when you are happy with the results in ParaView GUI.
---
### Author:  [@primer](https://discourse.paraview.org/u/primer)
#### Post date: [January 17, 2024, 12:57am UTC](https://discourse.paraview.org/t/plotting-integrated-values-over-time/13617/14 "2024-01-17T00:57:18Z")
Hi,
Thanks for the tip. Yes, reloading the state does recover the layout. Loading the state in another directory also does load the available data an renders it. It does not place a blue vertical line to indicate the end of the data correctly though. It places it where the original data ended.
I was hoping to analyze the xml state file to find out what is being missed in the script file but it is beyond my novice appreciation. If I was not such a novice, I would be able to debug the script file to begin with.
If you are aware of a script file that successfully uses the plot selection over time, please send it my way.
The script file is very intuitive in understanding the process flow.
primer
---
### Author:  [@mwestphal](https://discourse.paraview.org/u/mwestphal)
#### Post date: [January 17, 2024, 7:43am UTC](https://discourse.paraview.org/t/plotting-integrated-values-over-time/13617/15 "2024-01-17T07:43:21Z")
> [@primer](#):
>
> If you are aware of a script file that successfully uses the plot selection over time, please send it my way.
File → Save State → Select Python → state.py
---
### Author:  [@primer](https://discourse.paraview.org/u/primer)
#### Post date: [January 17, 2024, 9:44am UTC](https://discourse.paraview.org/t/plotting-integrated-values-over-time/13617/16 "2024-01-17T09:44:41Z")
Hi,
I should have examined the save state options. I tried your suggestion of
File → Save State → Select Python → state.py
but I get this error:
Generic Warning: In vtkSMTrace.cxx, line 114
Tracing is active. Cannot save state.
Generic Warning: In vtkSMTrace.cxx, line 137
Failed to generate state.
I tried googling it to find an answer and I could not find anything.
Almost there.
Thanks.
primer
---
### Author:  [@mwestphal](https://discourse.paraview.org/u/mwestphal)
#### Post date: [January 17, 2024, 9:51am UTC](https://discourse.paraview.org/t/plotting-integrated-values-over-time/13617/17 "2024-01-17T09:51:15Z")
Do not use the python trace.
- Open ParaView
- Do the operations
- Save a python state file
---
### Author:  [@primer](https://discourse.paraview.org/u/primer)
#### Post date: [January 17, 2024, 11:25am UTC](https://discourse.paraview.org/t/plotting-integrated-values-over-time/13617/18 "2024-01-17T11:25:45Z")
Hi,
I did not use the python trace. I broke the problem into two.
1. I first read in the data and generated the pipeline for the force calculations. I then did save state for the python option. It worked.
2. Then I restarted paraview. Read in the data and did the force calculations. I then did the plot selection over time and opened a spread sheet. I attempted to save state as in 1. It did not work. The complete error message is
Generic Warning: In vtkSMTrace.cxx, line 137
Failed to generate state.
Traceback (most recent call last):
File “/home/adi/OpenFOAM/ParaView-5.11.1-MPI-Linux-Python3.9-x86\_64/lib/python3.9/site-packages/paraview/smtrace.py”, line 174, in get\_accessor
return cls.\_\_REGISTERED\_ACCESSORS[obj]
KeyError: \
During handling of the above exception, another exception occurred:
Traceback (most recent call last):
File “/home/adi/OpenFOAM/ParaView-5.11.1-MPI-Linux-Python3.9-x86\_64/lib/python3.9/site-packages/paraview/smstate.py”, line 233, in get\_state
traceitem.finalize()
File “/home/adi/OpenFOAM/ParaView-5.11.1-MPI-Linux-Python3.9-x86\_64/lib/python3.9/site-packages/paraview/smtrace.py”, line 986, in finalize
trace.append(accessor.trace\_ctor(ctor, filter\_type, ctor\_args=ctor\_args))
File “/home/adi/OpenFOAM/ParaView-5.11.1-MPI-Linux-Python3.9-x86\_64/lib/python3.9/site-packages/paraview/smtrace.py”, line 560, in trace\_ctor
ctor\_props\_trace = self.trace\_properties(ctor\_props, in\_ctor=True)
File “/home/adi/OpenFOAM/ParaView-5.11.1-MPI-Linux-Python3.9-x86\_64/lib/python3.9/site-packages/paraview/smtrace.py”, line 552, in trace\_properties
return joiner.join([x.get\_property\_trace(in\_ctor) for x in props])
File “/home/adi/OpenFOAM/ParaView-5.11.1-MPI-Linux-Python3.9-x86\_64/lib/python3.9/site-packages/paraview/smtrace.py”, line 552, in
return joiner.join([x.get\_property\_trace(in\_ctor) for x in props])
File “/home/adi/OpenFOAM/ParaView-5.11.1-MPI-Linux-Python3.9-x86\_64/lib/python3.9/site-packages/paraview/smtrace.py”, line 670, in get\_property\_trace
if in\_ctor: return "%s=s" (varname, self.get\_value())
File “/home/adi/OpenFOAM/ParaView-5.11.1-MPI-Linux-Python3.9-x86\_64/lib/python3.9/site-packages/paraview/smtrace.py”, line 693, in get\_value
data = [str(Trace.get\_accessor(x)) for x in data]
File “/home/adi/OpenFOAM/ParaView-5.11.1-MPI-Linux-Python3.9-x86\_64/lib/python3.9/site-packages/paraview/smtrace.py”, line 693, in
data = [str(Trace.get\_accessor(x)) for x in data]
File “/home/adi/OpenFOAM/ParaView-5.11.1-MPI-Linux-Python3.9-x86\_64/lib/python3.9/site-packages/paraview/smtrace.py”, line 181, in get\_accessor
raise Untraceable(
paraview.smtrace.Untraceable: “\ is not ‘known’ at this point. Hence, we cannot trace it. Skipping this action.”
Your thoughts?
primer
---
### Author:  [@mwestphal](https://discourse.paraview.org/u/mwestphal)
#### Post date: [January 17, 2024, 1:01pm UTC](https://discourse.paraview.org/t/plotting-integrated-values-over-time/13617/19 "2024-01-17T13:01:32Z")
please share data and steps to reproduce
---
### Author:  [@primer](https://discourse.paraview.org/u/primer)
#### Post date: [January 17, 2024, 3:55pm UTC](https://discourse.paraview.org/t/plotting-integrated-values-over-time/13617/20 "2024-01-17T15:55:40Z")
Hi,
I have provided a data.zip file that contains the data and a python script file which reads in the data and
generates the force data. My paraview version is 5.11.1.
1. Make new directory.
2. Unzip data.zip
in this directory. Four directories are created with data.
3. Run paraview.
4. Paste the python script contents in the python shell and run.
5. Select data in SpreadSheetView1
6. Filters → Plot Selection Over Time
7. Vertically split QuartileChartView2 and create SpreadSheetView2
8. File → Save State → Python state file; Enter File name as state; Hit OK
Does not create state.py file. A state file is created if I do it before applying the Plot Selection Over Time filter.
primer
[pvScript\_force0.py](https://discourse.paraview.org/uploads/short-url/o6AuoS2y6nxAWcnBaXM4nUuPTzS.py) (2.7 KB)
[data.zip](https://discourse.paraview.org/uploads/short-url/oKyvTeO4cU6peKps0VTxj05lTCn.zip) (3.6 MB)
[Next page](https://discourse.paraview.org/t/plotting-integrated-values-over-time/13617.md?page=2)