# Plotting mass with the coordinates
**URL:** https://discourse.paraview.org/t/plotting-mass-with-the-coordinates/3141
**Category:** ParaView Support
**Tags:** vtk, python
**Created:** [December 8, 2019, 8:40pm UTC](https://discourse.paraview.org/t/plotting-mass-with-the-coordinates/3141 "2019-12-08T20:40:09Z")
**Posts on this page:** 7
**Page:** 1
### Author:  [@Samanvith\_A](https://discourse.paraview.org/u/Samanvith_A)
#### Post date: [December 8, 2019, 8:40pm UTC](https://discourse.paraview.org/t/plotting-mass-with-the-coordinates/3141/1 "2019-12-08T20:40:09Z")
Hello everyone,
I have a.CSV file, which contains coordinate data i.e X, Y, Z. Each coordinate has a mass M. I want to plot this mass for each coordinate in ParaView. Also,I want a color code for Mass.
Is there any way to do it?
I have attached the file too.
[Coordinate\_w\_Mass.csv](https://discourse.paraview.org/uploads/short-url/611mGhi02uC9QxFRAS5qXtnBhbH.csv) (1.3 MB)
Ex: Say I have X : 1, Y : 2, Z : 3, Mass: 5. So the mass should be located at 1, 2,3.
---
### Author:  [@mwestphal](https://discourse.paraview.org/u/mwestphal)
#### Post date: [December 9, 2019, 10:29am UTC](https://discourse.paraview.org/t/plotting-mass-with-the-coordinates/3141/2 "2019-12-09T10:29:16Z")
Filters -\> TableToPoints
---
### Author:  [@Samanvith\_A](https://discourse.paraview.org/u/Samanvith_A)
#### Post date: [December 10, 2019, 6:48pm UTC](https://discourse.paraview.org/t/plotting-mass-with-the-coordinates/3141/3 "2019-12-10T18:48:34Z")
Hey, that worked really fine.
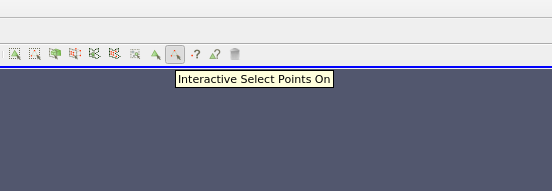
I wanted to know, is there any way I can display the values, if I click on the 3D view that I got from the data.
Say if I click on some coordinate on the 3D view, the value of mass at that point should be displayed, Can it be done ?
Thank you
Samanvith A
M.Sc Astronomy
DAASE
IIT Indore, Indore.
---
### Author:  [@mwestphal](https://discourse.paraview.org/u/mwestphal)
#### Post date: [December 11, 2019, 9:15am UTC](https://discourse.paraview.org/t/plotting-mass-with-the-coordinates/3141/4 "2019-12-11T09:15:50Z")
Use the “Interactive Select points on” feature.
---
### Author:  [@veenak](https://discourse.paraview.org/u/veenak)
#### Post date: [April 9, 2020, 9:41pm UTC](https://discourse.paraview.org/t/plotting-mass-with-the-coordinates/3141/5 "2020-04-09T21:41:20Z")
Hi I am working on the similar requirement. I have a CSV file with x y and z values.
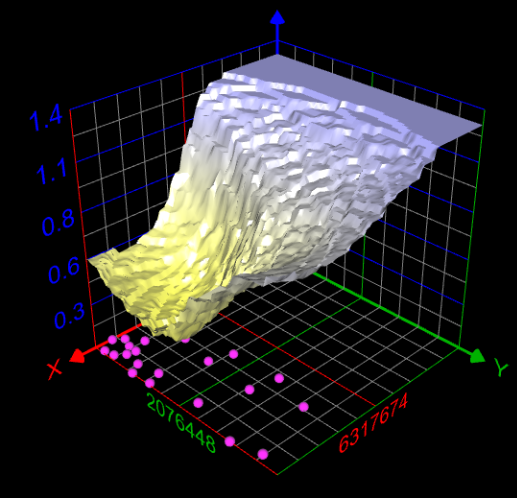
I just need the meshgrid plot for this file using paraview. I did the import csv -\>tabletopoints however I am not getting the required 3 D view. it is the csv for 6000 x 6000x 6000 points. Can you please guide to obtain the 3D view similar to just like in meshgrid. fig.

---
### Author:  [@mwestphal](https://discourse.paraview.org/u/mwestphal)
#### Post date: [April 10, 2020, 2:00am UTC](https://discourse.paraview.org/t/plotting-mass-with-the-coordinates/3141/6 "2020-04-10T02:00:26Z")
Please open your own topic.
---
### Author:  [@mwestphal](https://discourse.paraview.org/u/mwestphal)
#### Post date: [April 10, 2020, 2:00am UTC](https://discourse.paraview.org/t/plotting-mass-with-the-coordinates/3141/7 "2020-04-10T02:00:28Z")