# Plotting points on a rectangular grid with Paraview
**URL:** https://discourse.paraview.org/t/plotting-points-on-a-rectangular-grid-with-paraview/3146
**Category:** ParaView Support
**Created:** [December 9, 2019, 11:34am UTC](https://discourse.paraview.org/t/plotting-points-on-a-rectangular-grid-with-paraview/3146 "2019-12-09T11:34:10Z")
**Posts on this page:** 6
**Page:** 1
### Author:  [@sequence](https://discourse.paraview.org/u/sequence)
#### Post date: [December 9, 2019, 11:34am UTC](https://discourse.paraview.org/t/plotting-points-on-a-rectangular-grid-with-paraview/3146/1 "2019-12-09T11:34:10Z")
I was wondering if someone who works with gnuplot also knows how to make a similar plot in Paraview. I would like to plot the points contained in [this file](https://pastebin.com/Ese22k8R) with Paraview, but can’t seem to figure out how to do so. Each column in this file corresponds to a set of 2048 points on a 64x32 grid. Each column contains sequences of points, one point per grid cell, each sequence is separated by an empty line space and corresponds to going over the width of the grid once (moving towards the y-direction and filling the x-points at each y-step). I would need to at least plot one column at a time, not necessarily all columns at once. In gnuplot, the needed plot is done with the command `splot "dat.25" us 1 wi li, "dat.25" us 2 wi li` (this command plots the points in the first two columns) and the plot looks like this:
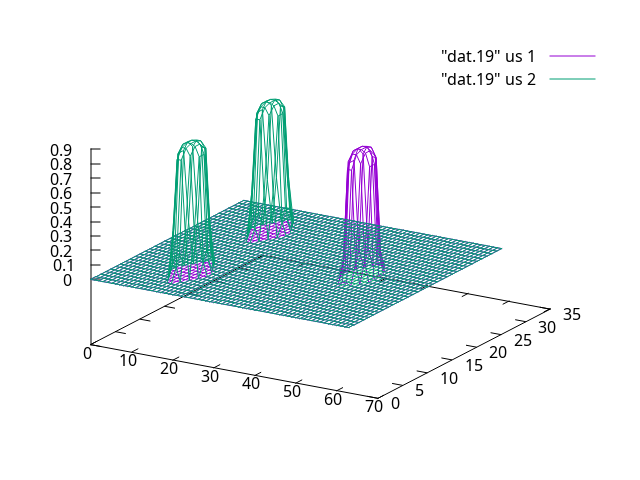
This way gnuplot puts one point into one grid cell. So this grid is 64x32 and therefore there are 2048 entries per column.
I would very much appreciate if someone could please help with doing this sort of plots in Paraview. I’ve tried to experiment with all Plot filters, but have not so far found how to actually make a grid plot. But there should be a way.
---
### Author:  [@mwestphal](https://discourse.paraview.org/u/mwestphal)
#### Post date: [December 9, 2019, 12:28pm UTC](https://discourse.paraview.org/t/plotting-points-on-a-rectangular-grid-with-paraview/3146/2 "2019-12-09T12:28:15Z")
There is no native 3D plots in ParaView.
If you can figure out how to do that with matplotlib, you can use a PythonView to show it in ParaView.
---
### Author:  [@sequence](https://discourse.paraview.org/u/sequence)
#### Post date: [December 10, 2019, 4:01am UTC](https://discourse.paraview.org/t/plotting-points-on-a-rectangular-grid-with-paraview/3146/3 "2019-12-10T04:01:46Z")
I guess I’m probably missing something, but in sample plots of Paraview we can see 3D objects in render view?
---
### Author:  [@mwestphal](https://discourse.paraview.org/u/mwestphal)
#### Post date: [December 10, 2019, 9:38am UTC](https://discourse.paraview.org/t/plotting-points-on-a-rectangular-grid-with-paraview/3146/4 "2019-12-10T09:38:26Z")
Well, what you can do is create a 3D geometry that will look like a 3D plot. No ideal but that may work for you.
---
### Author:  [@sequence](https://discourse.paraview.org/u/sequence)
#### Post date: [December 10, 2019, 4:47pm UTC](https://discourse.paraview.org/t/plotting-points-on-a-rectangular-grid-with-paraview/3146/5 "2019-12-10T16:47:03Z")
Actually a 3D plot is not necessary in my case. I’m wondering, if I want to make a 2D (contour map) plot out of that file, how would I go about doing that in Paraview? It is still not clear how to make grid plots in Paraview. I’d appreciate your help with this.
---
### Author:  [@mwestphal](https://discourse.paraview.org/u/mwestphal)
#### Post date: [December 10, 2019, 5:00pm UTC](https://discourse.paraview.org/t/plotting-points-on-a-rectangular-grid-with-paraview/3146/6 "2019-12-10T17:00:23Z")
You can definitely do that. But first you need to be able to open your file in ParaView.
Your file format in not standard. You may want to read it using a Programmable Source.