# Plotting Segments from CSV file
**URL:** https://discourse.paraview.org/t/plotting-segments-from-csv-file/4644
**Category:** ParaView Support
**Created:** [June 22, 2020, 3:00pm UTC](https://discourse.paraview.org/t/plotting-segments-from-csv-file/4644 "2020-06-22T15:00:01Z")
**Posts on this page:** 3
**Page:** 1
### Author:  [@nico\_C](https://discourse.paraview.org/u/nico_C)
#### Post date: [June 22, 2020, 3:00pm UTC](https://discourse.paraview.org/t/plotting-segments-from-csv-file/4644/1 "2020-06-22T15:00:01Z")
Hi all,
I would like to plot individual segments, using a CSV file formatted as:
X1 Y1 Z1 X2 Y2 Z2 Intensity
I managed to import the CSV file, then convert it using **TableToPoints**. Then, thanks to **Python Calculator** ([How do I use three different arrays as components of one vector field?](https://discourse.paraview.org/t/how-do-i-use-three-different-arrays-as-components-of-one-vector-field/4637)) , I built a V vector of coordinates (X2-X1,Y2-Y1, Z2-Z1). Finally, with Glyph filter, I am almost done, using the correct scaling, mimicking what I can obtain with GnuPlot (see attached picture: here data is simplified with Z1=Z2=0)

I guess I could use _Line_ glyph type instead of _Arrow_, but then Line is “centered” on X1,Y1,Z1 point. How can I translate each glyph ?
(the other option I can think of use Arrow glyphes, without head and with the same diameter)
Using Paraview v5.8.0
Thank you for you help.
Nicolas
[X1Y1Z1\_X2Y2Z2\_I\_pour\_Paraview.zip](https://discourse.paraview.org/uploads/short-url/z1pLnK3868VLoGQzCB4yFj9rxps.zip) (141.9 KB)
---
### Author:  [@Kenichiro-Yoshimi](https://discourse.paraview.org/u/Kenichiro-Yoshimi)
#### Post date: [June 23, 2020, 12:34am UTC](https://discourse.paraview.org/t/plotting-segments-from-csv-file/4644/2 "2020-06-23T00:34:44Z")
Hello,
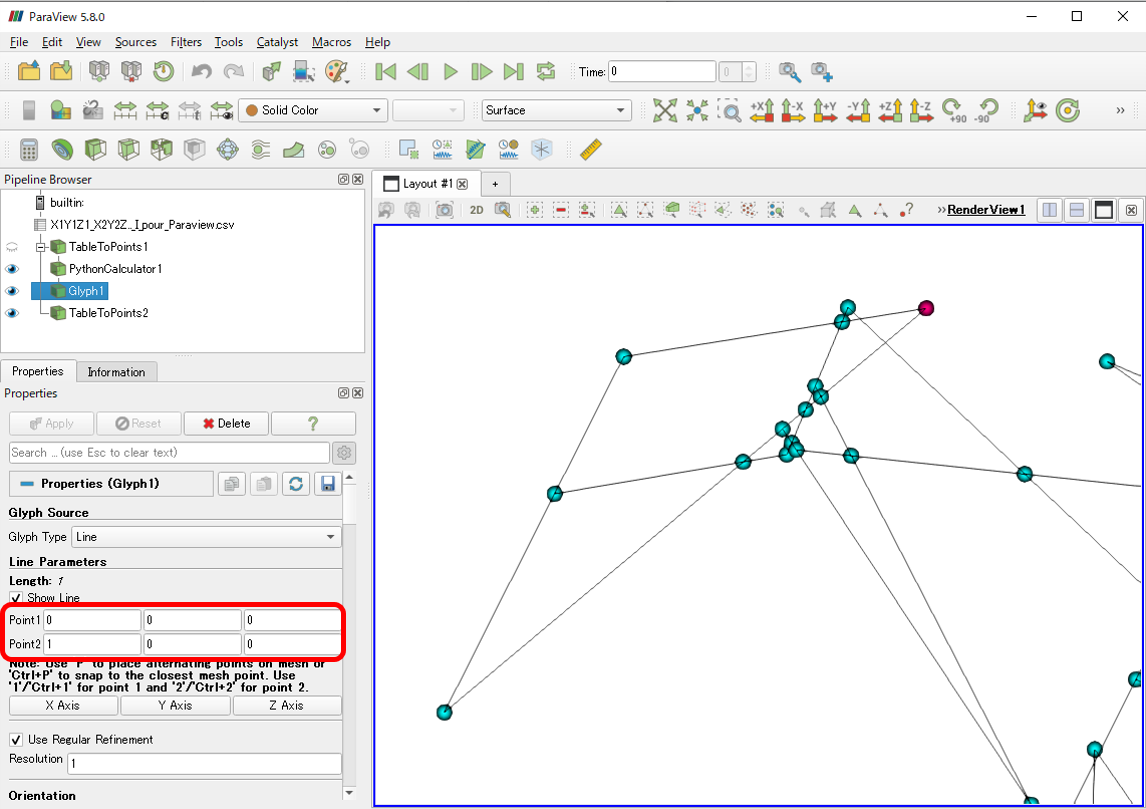
Would you try to change the Line Parameters as below? Thereby, the starting points of the seeding lines can be moved as you want.
Point1: 0 0 0
Point2: 1 0 0
I attached the state file:
[line\_segments.pvsm](https://discourse.paraview.org/uploads/short-url/89QqfSJv8HWkSzAc7DPV2kVxhlA.pvsm) (544.0 KB)
---
### Author:  [@nico\_C](https://discourse.paraview.org/u/nico_C)
#### Post date: [June 23, 2020, 12:35pm UTC](https://discourse.paraview.org/t/plotting-segments-from-csv-file/4644/3 "2020-06-23T12:35:14Z")
Hi Kyoshimi
Thanks a lot, it works perfectly.
Regards,