# Plotting selected cells with variable
**URL:** https://discourse.paraview.org/t/plotting-selected-cells-with-variable/1588
**Category:** ParaView Support
**Created:** [April 2, 2019, 4:22pm UTC](https://discourse.paraview.org/t/plotting-selected-cells-with-variable/1588 "2019-04-02T16:22:04Z")
**Posts on this page:** 6
**Page:** 1
### Author:  [@KJ\_Chuah](https://discourse.paraview.org/u/KJ_Chuah)
#### Post date: [April 2, 2019, 4:22pm UTC](https://discourse.paraview.org/t/plotting-selected-cells-with-variable/1588/1 "2019-04-02T16:22:04Z")
Hi there, I am trying to plot selected cells with its variable.
I have selected few cells randomly.
The number of each cell is plotted on the x-axis, but how could I recognize which cell belongs to which number? Is it following the sequence when I selected the cells?
Thank you.
---
### Author:  [@mwestphal](https://discourse.paraview.org/u/mwestphal)
#### Post date: [April 4, 2019, 6:05pm UTC](https://discourse.paraview.org/t/plotting-selected-cells-with-variable/1588/2 "2019-04-04T18:05:17Z")
Hello, welcome to the community.
Can you precise what you want to do with a screenshot maybe ?
---
### Author:  [@KJ\_Chuah](https://discourse.paraview.org/u/KJ_Chuah)
#### Post date: [April 5, 2019, 1:06pm UTC](https://discourse.paraview.org/t/plotting-selected-cells-with-variable/1588/3 "2019-04-05T13:06:22Z")
Hello, thanks for replying.
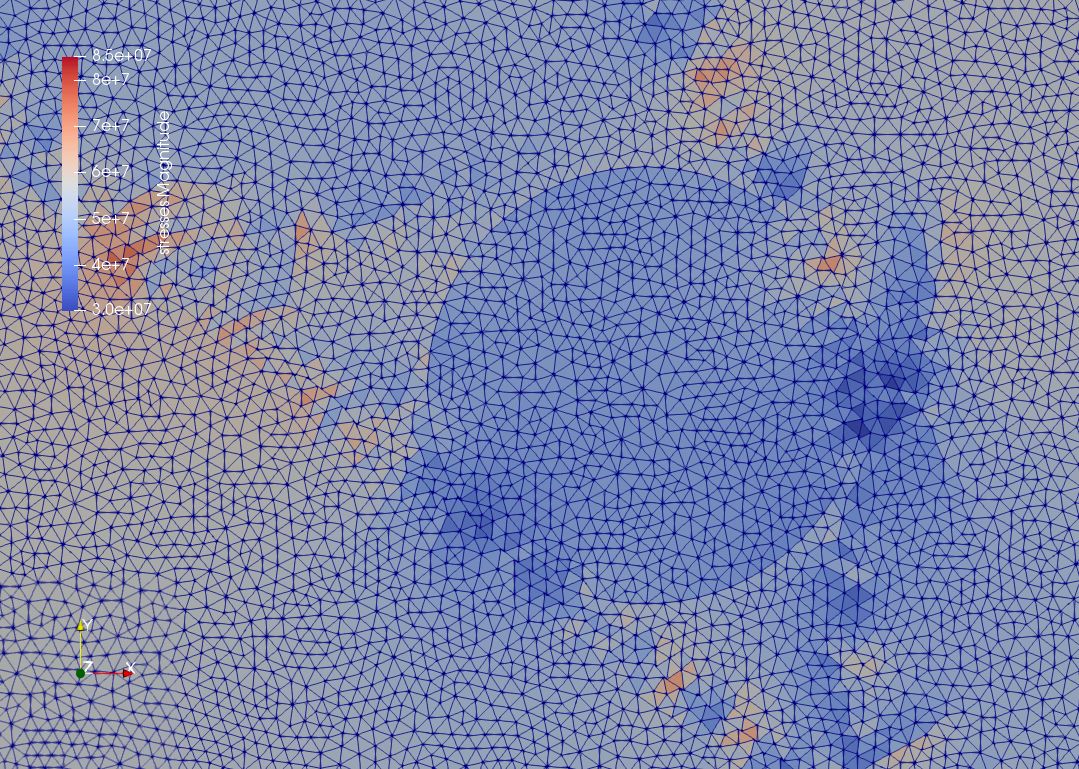
I wanted to plot the stress magnitude versus the orientation around the circular borehole.
May i know how can i do that?
Thank you.
Best regards.
---
### Author:  [@Kenneth\_Moreland](https://discourse.paraview.org/u/Kenneth_Moreland)
#### Post date: [April 8, 2019, 2:32pm UTC](https://discourse.paraview.org/t/plotting-selected-cells-with-variable/1588/4 "2019-04-08T14:32:41Z")
I still do not understand.
What is “orientation”? Is that another variable that you can color by?
And when you say you want to plot stress vs orientation, are you talking about something like a [scatter plot](https://en.wikipedia.org/wiki/Scatter_plot)?
---
### Author:  [@KJ\_Chuah](https://discourse.paraview.org/u/KJ_Chuah)
#### Post date: [April 8, 2019, 4:08pm UTC](https://discourse.paraview.org/t/plotting-selected-cells-with-variable/1588/5 "2019-04-08T16:08:56Z")
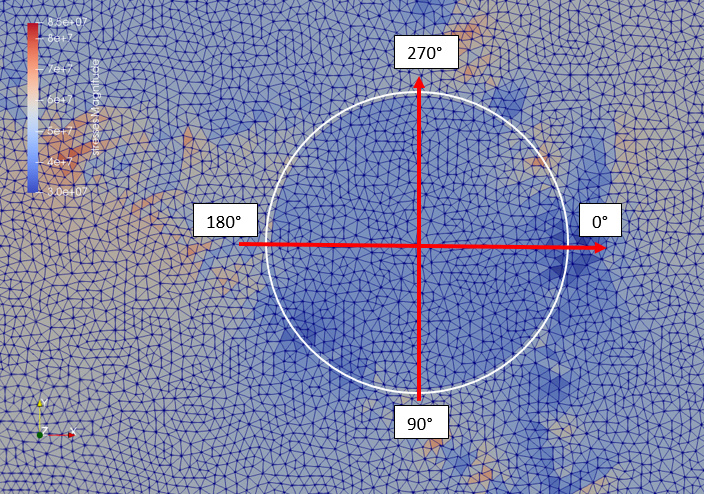
Hi Kenneth, ya I want to make a plot of stress versus the angle orientation around the circle in white.
Hope to hear from you soon…
Thank you.
---
### Author:  [@Kenneth\_Moreland](https://discourse.paraview.org/u/Kenneth_Moreland)
#### Post date: [April 8, 2019, 7:26pm UTC](https://discourse.paraview.org/t/plotting-selected-cells-with-variable/1588/6 "2019-04-08T19:26:27Z")
Plotting on a circle in ParaView is tricky but can be done. The easiest way to do it is to use the `Plot On Intersection Curves` filter. This filter only works on surfaces. I cannot tell from your screenshot whether your mesh is a 2D mesh on a plane or the top of a 3D block. If you have a 3D mesh, you will first have to use the `Slice` filter to extract a surface from your mesh.
Once you have a surface, add the `Plot On Intersection Curves` filter. Change the `Slice Type` to `Sphere`. Then change the `Center` to be in the center of your borehole and the `Radius` to be whatever size around you want the plot to be. The `Apply` and you have your plot.