# Plotting x, y, z, resistivity (csv)
**URL:** https://discourse.paraview.org/t/plotting-x-y-z-resistivity-csv/9275
**Category:** ParaView Support
**Created:** [March 24, 2022, 6:05pm UTC](https://discourse.paraview.org/t/plotting-x-y-z-resistivity-csv/9275 "2022-03-24T18:05:31Z")
**Posts on this page:** 6
**Page:** 1
### Author:  [@Crown](https://discourse.paraview.org/u/Crown)
#### Post date: [March 24, 2022, 6:05pm UTC](https://discourse.paraview.org/t/plotting-x-y-z-resistivity-csv/9275/1 "2022-03-24T18:05:31Z")
Hello All,
I have a file in csv format which has x, y, z, and resistivity. I want to display this data in 3D in paraview. I will appreciate if anyone can help me out.
Thank you.
Here is the example of the data:
[Resistivity data.csv](https://discourse.paraview.org/uploads/short-url/ahimenpH14tKvofZO74HUsVSAx8.csv) (46.3 KB)
---
### Author:  [@Christos\_Tsolakis](https://discourse.paraview.org/u/Christos_Tsolakis)
#### Post date: [March 24, 2022, 6:21pm UTC](https://discourse.paraview.org/t/plotting-x-y-z-resistivity-csv/9275/2 "2022-03-24T18:21:28Z")
Hi Seun and welcome to the forum !
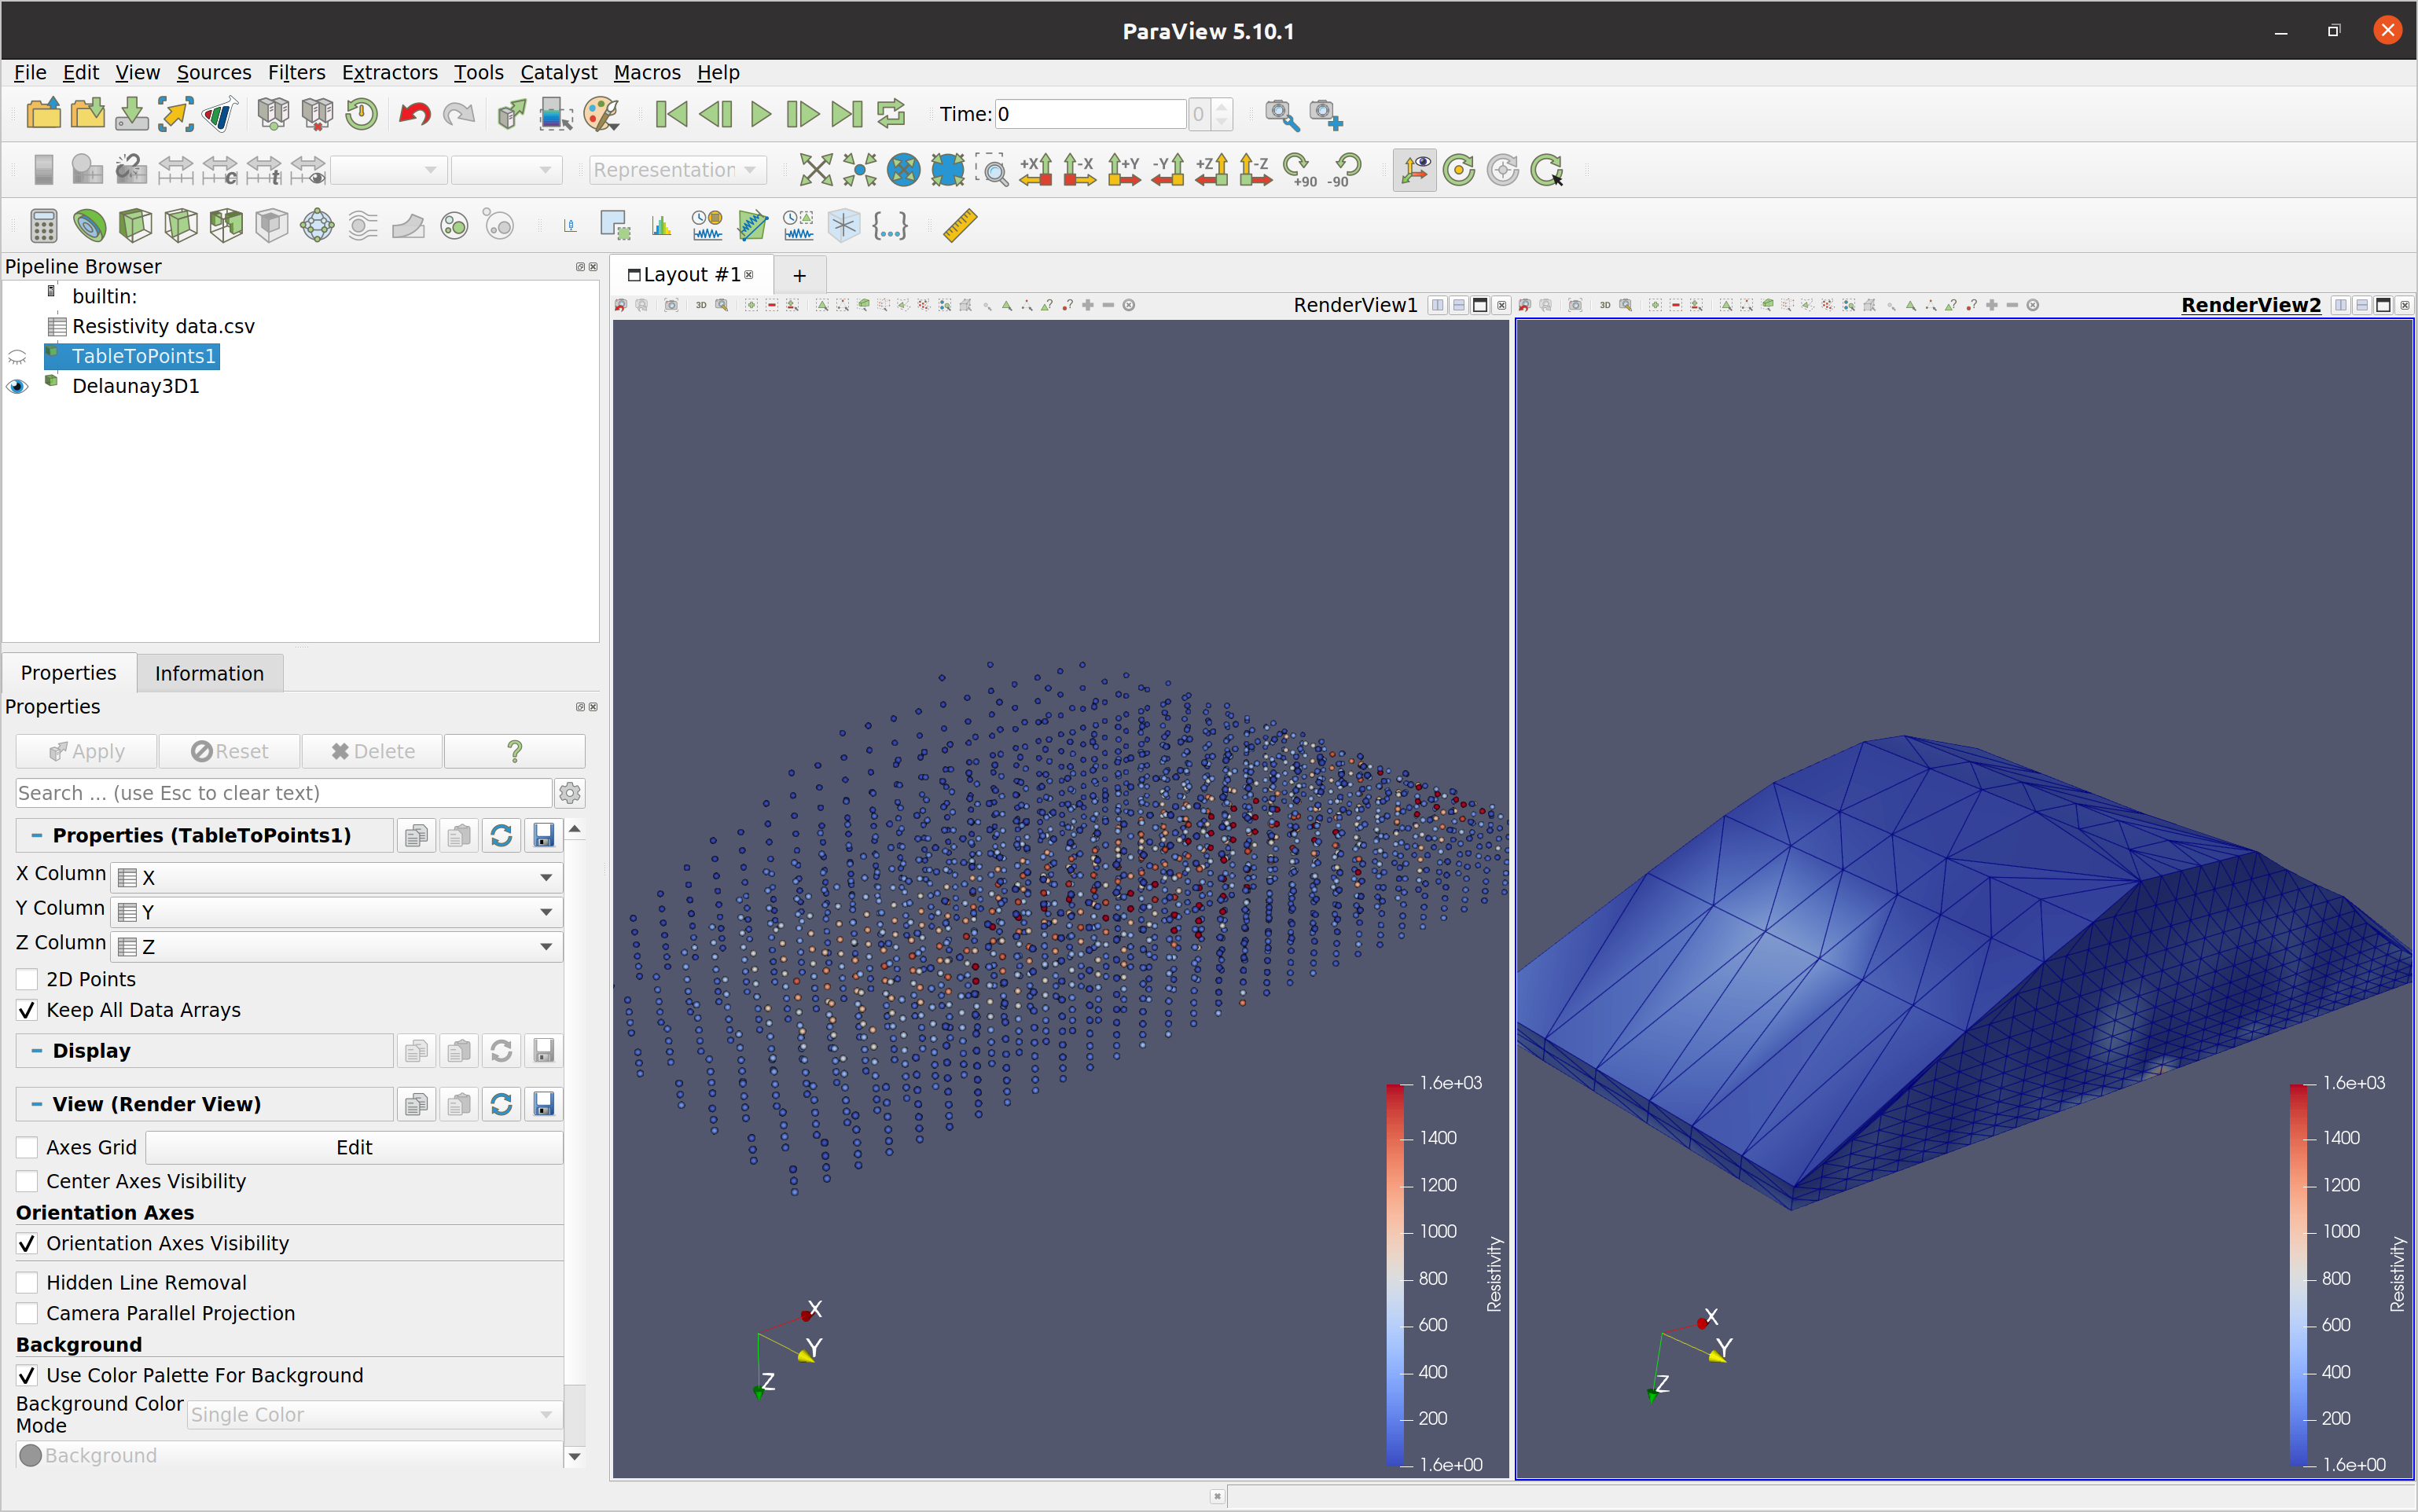
You can convert your table to to points using the `Table To Points` filter from the Filters menu color them by resistivity instead of the default solid color. I also suggest using `Point Gaussian` as representation to make the points more visible (see left below). If it makes sense for your dataset you can also try the `Delaunay3D` filter and produce a (convex) 3D representation or your data (see right below).
---
### Author:  [@Crown](https://discourse.paraview.org/u/Crown)
#### Post date: [March 24, 2022, 6:52pm UTC](https://discourse.paraview.org/t/plotting-x-y-z-resistivity-csv/9275/3 "2022-03-24T18:52:08Z")
Christos,
Thank you for your response. Regarding the data format, do I need to keep x, and y negative and z positive? Which is the better way to keep the data.
Thank you.
Seun
---
### Author:  [@Christos\_Tsolakis](https://discourse.paraview.org/u/Christos_Tsolakis)
#### Post date: [March 24, 2022, 7:03pm UTC](https://discourse.paraview.org/t/plotting-x-y-z-resistivity-csv/9275/4 "2022-03-24T19:03:58Z")
There is no need to constrain your values you can keep them as they are.
---
### Author:  [@Crown](https://discourse.paraview.org/u/Crown)
#### Post date: [March 26, 2022, 8:42am UTC](https://discourse.paraview.org/t/plotting-x-y-z-resistivity-csv/9275/5 "2022-03-26T08:42:28Z")
Thank you so much Christos
---
### Author:  [@Crown](https://discourse.paraview.org/u/Crown)
#### Post date: [March 30, 2022, 1:37am UTC](https://discourse.paraview.org/t/plotting-x-y-z-resistivity-csv/9275/6 "2022-03-30T01:37:29Z")
Hi All,
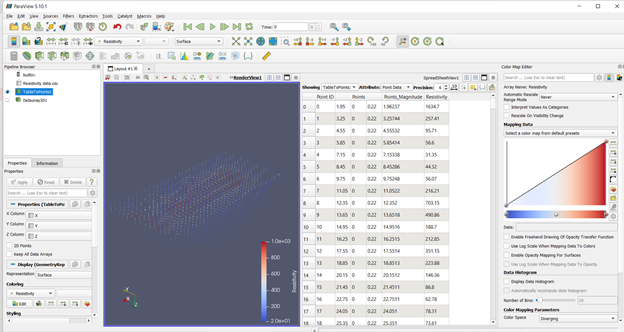
I generated 7 2D lines as points as shown in the attached. Is it possible to make those points thick lines? I know I can display the data as Delaunay3D but I still want to keep all the 7 separately.
Thank you