# programmable filter to evaluate field at some points and visualize it
**URL:** https://discourse.paraview.org/t/programmable-filter-to-evaluate-field-at-some-points-and-visualize-it/12433
**Category:** ParaView Support
**Tags:** python
**Created:** [July 1, 2023, 3:02pm UTC](https://discourse.paraview.org/t/programmable-filter-to-evaluate-field-at-some-points-and-visualize-it/12433 "2023-07-01T15:02:29Z")
**Posts on this page:** 2
**Page:** 1
### Author:  [@simonw](https://discourse.paraview.org/u/simonw)
#### Post date: [July 1, 2023, 3:02pm UTC](https://discourse.paraview.org/t/programmable-filter-to-evaluate-field-at-some-points-and-visualize-it/12433/1 "2023-07-01T15:02:29Z")
I applied the programmable filter to two active sources which both contain a scalar field called energy:
source1= inputs[0]
source2= inputs[1]
field1 = source1.PointData[“energy”]
field2 = source2.PointData[“energy”]
err = (field1 - field2)/field1
I want to evaluate the error “err” at some points that I read from file and then visualize the error at these points.
If I do
output.PointData.append(err , “errEnergy”)
I get a new field that contains the entire domain, not only the sampled points. However, I want to get something like a “scatter plot”.
How can I do this? Is programmable filter the right tool for me?
Thank you!
---
### Author:  [@Christos\_Tsolakis](https://discourse.paraview.org/u/Christos_Tsolakis)
#### Post date: [July 6, 2023, 4:36pm UTC](https://discourse.paraview.org/t/programmable-filter-to-evaluate-field-at-some-points-and-visualize-it/12433/2 "2023-07-06T16:36:58Z")
> I want to evaluate the error “err” at some points
One way to achieve this is by resampling your initial data onto the points of interest and then calculate the error. Check the [Resample to Dataset](https://docs.paraview.org/en/latest/UsersGuide/filteringData.html#resample-with-dataset) filter .
> However, I want to get something like a “scatter plot”.
> Depending on the dataset you pass in the above filter you can achieve any distribution you want.
For example, here I am evaluating the wavelet field only at some points .
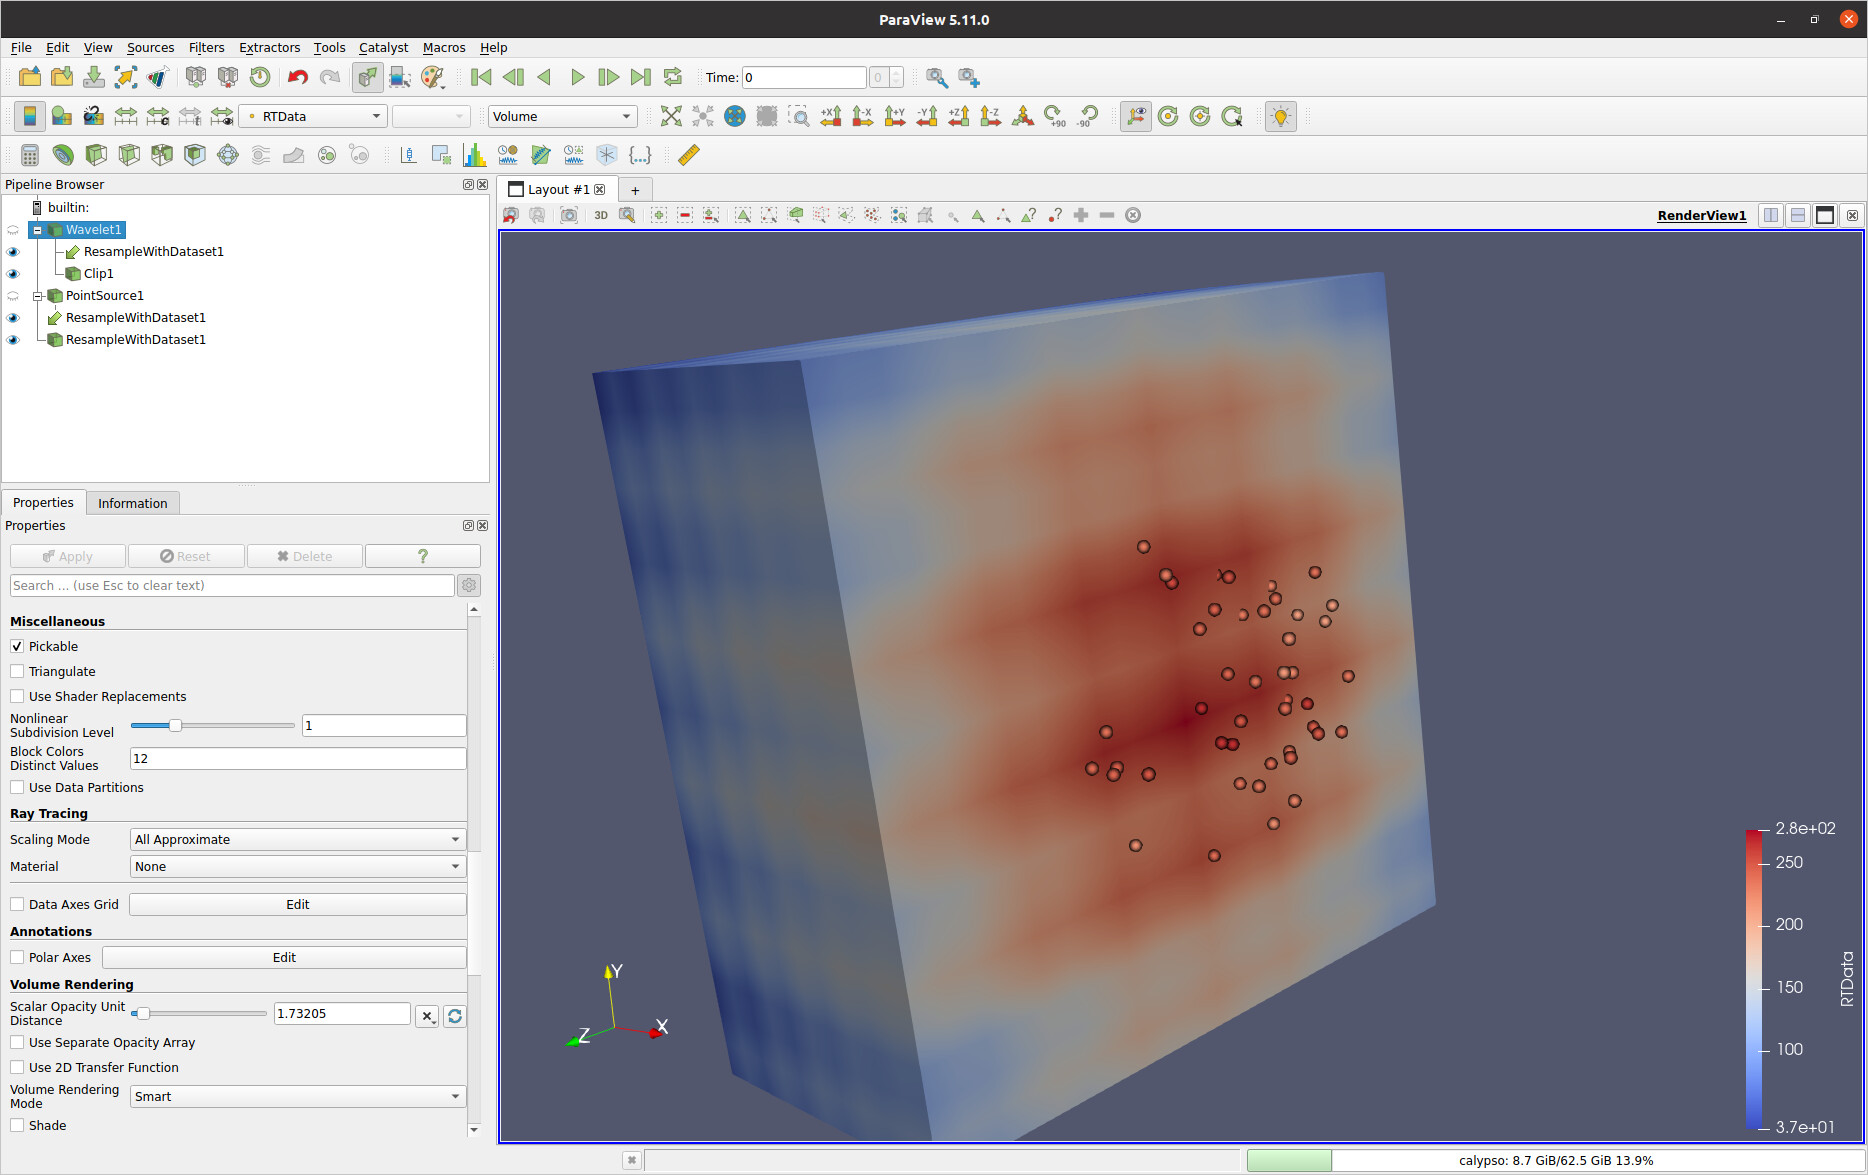
By supplying as input the `output` dataset from above and as seeds the points of interest you should have the result you are looking for.