# Re-scaling X axis and fitting it to data cube
**URL:** https://discourse.paraview.org/t/re-scaling-x-axis-and-fitting-it-to-data-cube/8844
**Category:** ParaView Support
**Created:** [January 26, 2022, 5:48pm UTC](https://discourse.paraview.org/t/re-scaling-x-axis-and-fitting-it-to-data-cube/8844 "2022-01-26T17:48:53Z")
**Posts on this page:** 7
**Page:** 1
### Author:  [@Victor\_Koehne\_Ramalh](https://discourse.paraview.org/u/Victor_Koehne_Ramalh)
#### Post date: [January 26, 2022, 5:48pm UTC](https://discourse.paraview.org/t/re-scaling-x-axis-and-fitting-it-to-data-cube/8844/1 "2022-01-26T17:48:53Z")
Hello all, after re-scaling the X-axis, I get the correct labels, but it stretches outside the data:

All labels are correct, but now the X axis don’t fit the data cube anymore. Any tips on how to make it start at 0 and end at 4.0 (and not -2 to 6, as shown)
---
### Author:  [@pavel](https://discourse.paraview.org/u/pavel)
#### Post date: [January 26, 2022, 8:17pm UTC](https://discourse.paraview.org/t/re-scaling-x-axis-and-fitting-it-to-data-cube/8844/2 "2022-01-26T20:17:53Z")
Hi Victor,
when I use _Transform_ filter (ParaView 5.9.1) to scale the model view with the data, sometimes I have the same issue. To correct it, I just check/uncheck the _Show box_ checkbox (which is close to _Scale_ fields on the same _Properties_ panel). If this is not a solution in your case, please describe how you re-scale X-axis.
Best Regards,
Pavel
---
### Author:  [@Victor\_Koehne\_Ramalh](https://discourse.paraview.org/u/Victor_Koehne_Ramalh)
#### Post date: [January 26, 2022, 8:49pm UTC](https://discourse.paraview.org/t/re-scaling-x-axis-and-fitting-it-to-data-cube/8844/3 "2022-01-26T20:49:49Z")
Hello Pavel,
Thanks for the reply, I am using Paraview 5.4.1, and unfortunately check/unchecking Show box did not solve the problem
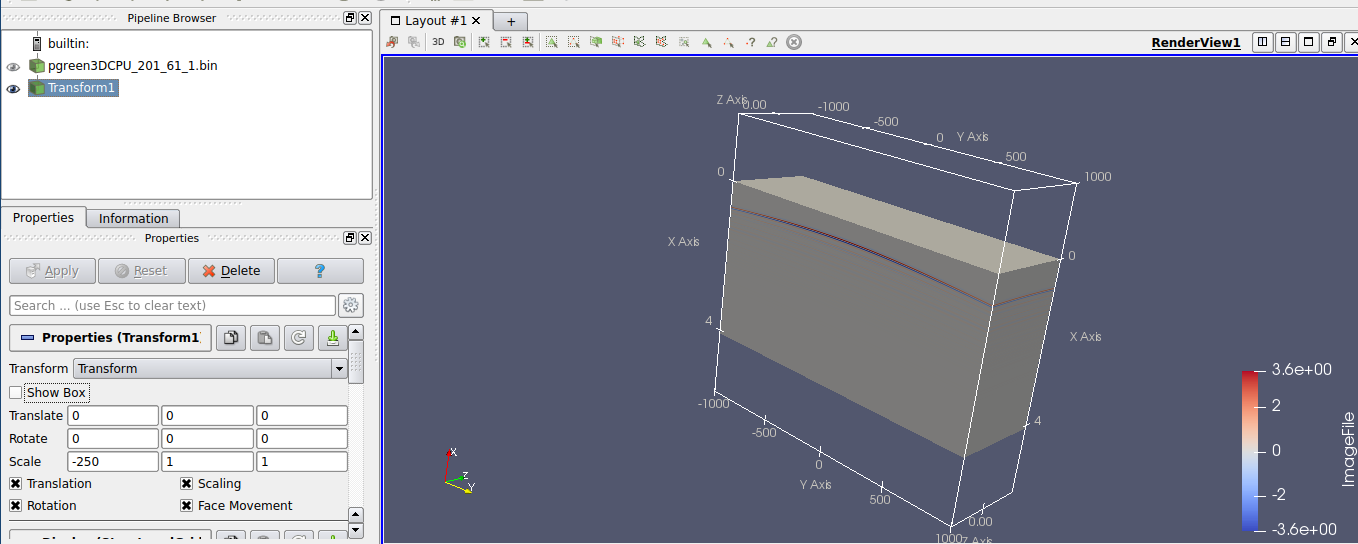
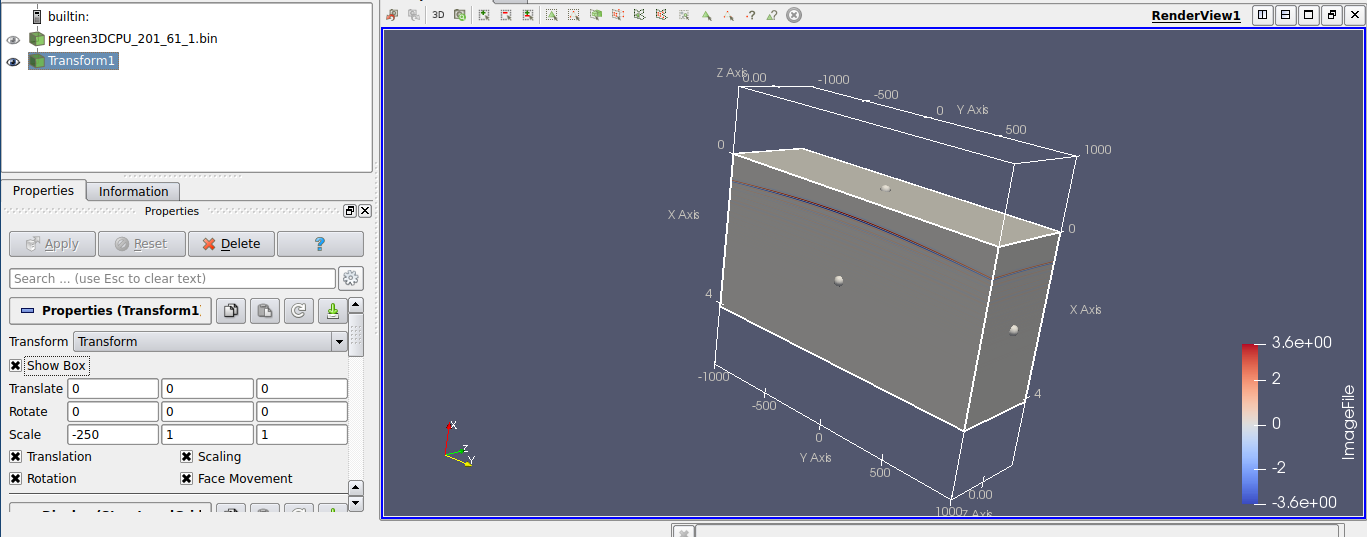
Maybe if I describe all the steps we can figure it out. First let me describe an example without scaling the X-axis. First I load a raw binary dataset, where the vertical dimension X is the fastest, and positive down; the horizontal dimesion Y is second fastest and positive to the right; and the crossline dimension Z is the slowest and positive inwards (this needs left-handed axes). So the first step would be getting left-handed axes with Transform and Edit the Axes Grid window. My sampling rates are dx,dy,dz=(0.004,10,10); if we focus on only the lef-handed axes plotting and leave dx,dz,dy=(1,10,10) we get, on the Load data Properties (eye deactivated):
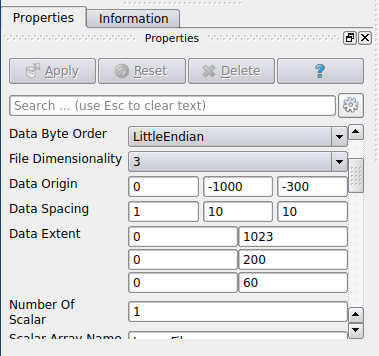
With Transform Properties (eye icon activated):
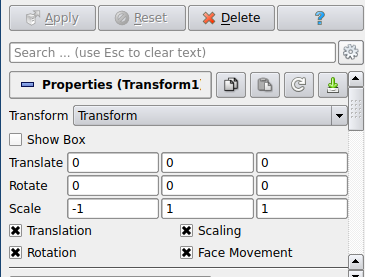
and the Axes Window Edit as:
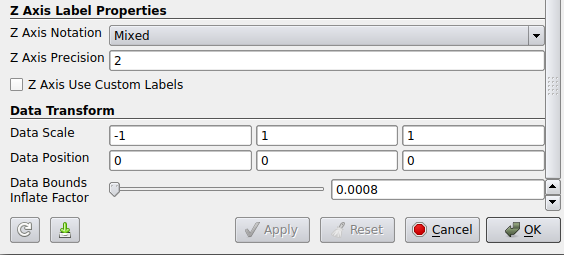
we get a final result with all the Axes labels close to the data cube, as below:
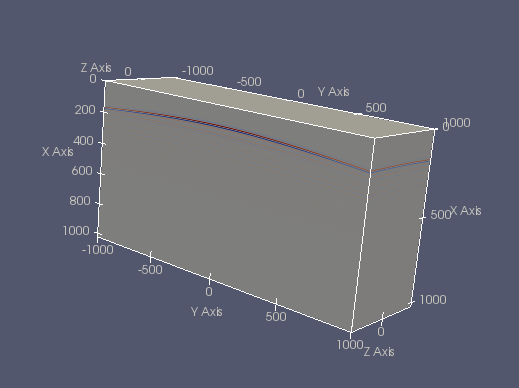
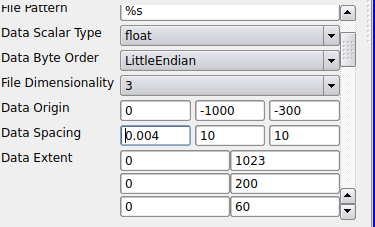
The thing is, the X-axis shows 0 to 1023, but I wanted it to be 0 to 4. Hence, the re-scaling part, as below (I mentioned the left-handed axes conversion because maybe it influenced something…)
Now doing both the left-handed axes adaptation and X-axis rescaling (dx=0.004), the steps would be, on the load data Properties window:
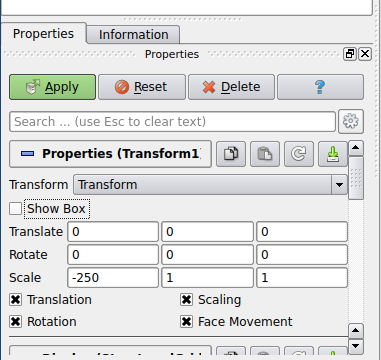
And on the Transform Properties window:
With Axes Grid “Edit” as:
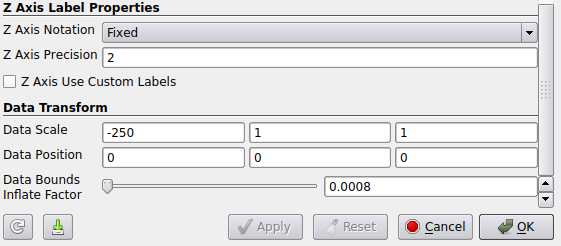
But this gives the box away from the data cube, as in the first message. Any hints?
Regards,
Victor
---
### Author:  [@pavel](https://discourse.paraview.org/u/pavel)
#### Post date: [January 26, 2022, 10:05pm UTC](https://discourse.paraview.org/t/re-scaling-x-axis-and-fitting-it-to-data-cube/8844/4 "2022-01-26T22:05:51Z")
Thanks for the detailed description! I’ll try to look around for some hints tomorrow.
---
### Author:  [@Venke](https://discourse.paraview.org/u/Venke)
#### Post date: [January 27, 2022, 7:52am UTC](https://discourse.paraview.org/t/re-scaling-x-axis-and-fitting-it-to-data-cube/8844/5 "2022-01-27T07:52:02Z")
Just a guess… but maybe the “Data bounds inflate factor” (last option in your screenshots) plays a trick on you with the large scaling values? I noticed that the default value is 1.0008 in the current ParaView version - probably due to updates. Maybe it could help to work with PV 5.10 instead of 5.4?
Good luck…
Venke
---
### Author:  [@pavel](https://discourse.paraview.org/u/pavel)
#### Post date: [January 27, 2022, 8:11am UTC](https://discourse.paraview.org/t/re-scaling-x-axis-and-fitting-it-to-data-cube/8844/6 "2022-01-27T08:11:57Z")
I have the same opinion as Venke about PV version. Do you have any specifics to use PV 5.4?
---
### Author:  [@Victor\_Koehne\_Ramalh](https://discourse.paraview.org/u/Victor_Koehne_Ramalh)
#### Post date: [January 27, 2022, 2:08pm UTC](https://discourse.paraview.org/t/re-scaling-x-axis-and-fitting-it-to-data-cube/8844/7 "2022-01-27T14:08:13Z")
Hello Pavel and Venke, thanks for the help! I am using Paraview 5.4.1 because it is the version available on the Linux Mint package manager. The time spent on installing the newest version manually will probably pay off (as in problems like this…) so will definitely try installing it today.
Data bounds inflate factor solved the problem; 1.0008 exacerbated the problem, while 0.0000125 produced the desired result
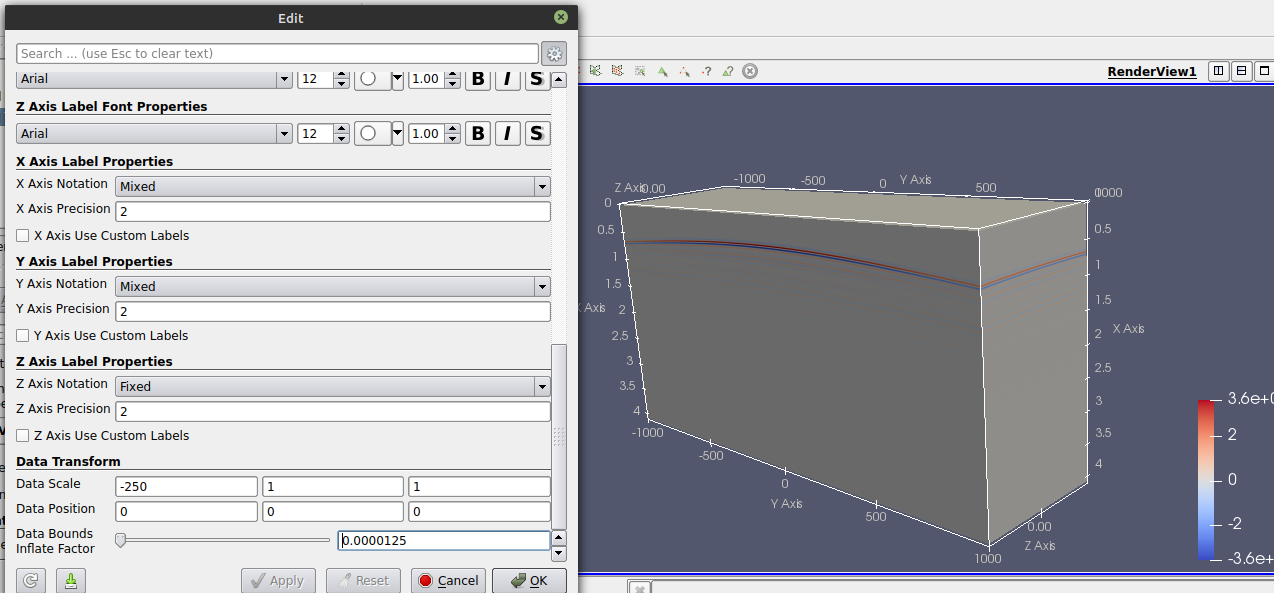
Thanks again guys, best regards,
Victor