# Regarding legend of a plot
**URL:** https://discourse.paraview.org/t/regarding-legend-of-a-plot/14585
**Category:** ParaView Support
**Created:** [May 9, 2024, 10:32am UTC](https://discourse.paraview.org/t/regarding-legend-of-a-plot/14585 "2024-05-09T10:32:23Z")
**Posts on this page:** 2
**Page:** 1
### Author:  [@Stayal](https://discourse.paraview.org/u/Stayal)
#### Post date: [May 9, 2024, 10:32am UTC](https://discourse.paraview.org/t/regarding-legend-of-a-plot/14585/1 "2024-05-09T10:32:24Z")
Hello everyone
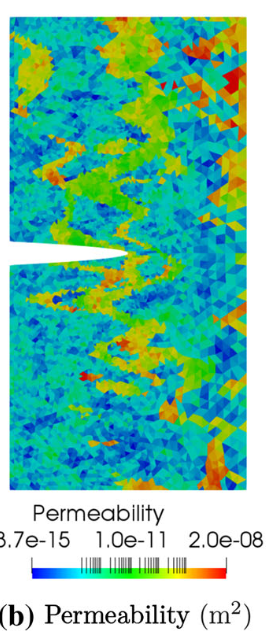
I am a beginner on paraview. I plot this diagram in paraview but my plot doesn’t seem like that. Below I attached a screenshot taken from a paper. I find out some lines on the legend. Can someone tell me what these lines indicates. How can I mark these lines in my plots. Maybe after that I will get the plot similar to that. Hope to hear from you soon. Thank you in advance.
---
### Author:  [@Kenichiro-Yoshimi](https://discourse.paraview.org/u/Kenichiro-Yoshimi)
#### Post date: [May 9, 2024, 12:39pm UTC](https://discourse.paraview.org/t/regarding-legend-of-a-plot/14585/2 "2024-05-09T12:39:01Z")
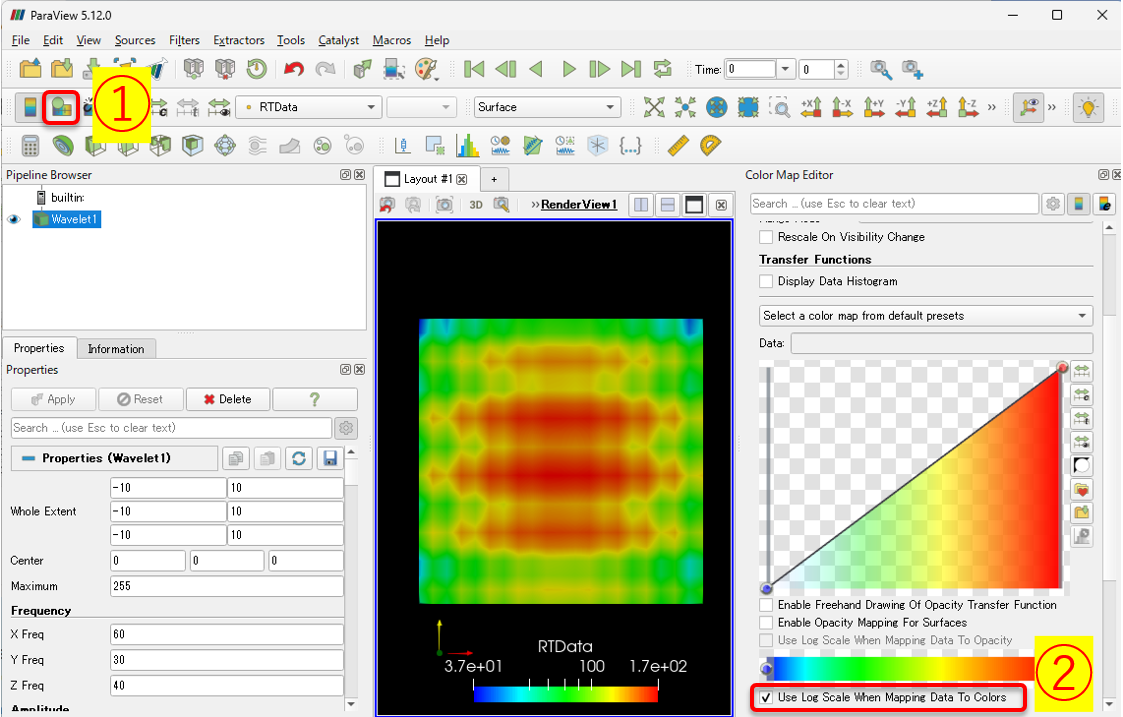
In the `Color Map Editor`, you should enable the option `Use Log Scale When Mapping Data to Colors` and create the color map with a logarithmic scale.