# Regarding streamlines
**URL:** https://discourse.paraview.org/t/regarding-streamlines/14852
**Category:** ParaView Support
**Created:** [June 16, 2024, 5:51am UTC](https://discourse.paraview.org/t/regarding-streamlines/14852 "2024-06-16T05:51:47Z")
**Posts on this page:** 8
**Page:** 1
### Author:  [@Stayal](https://discourse.paraview.org/u/Stayal)
#### Post date: [June 16, 2024, 5:51am UTC](https://discourse.paraview.org/t/regarding-streamlines/14852/1 "2024-06-16T05:51:47Z")
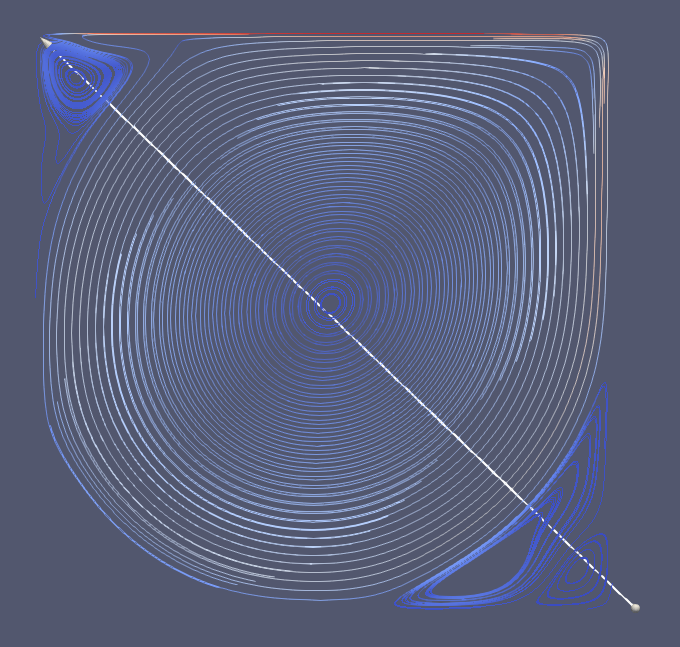
Hello everyone
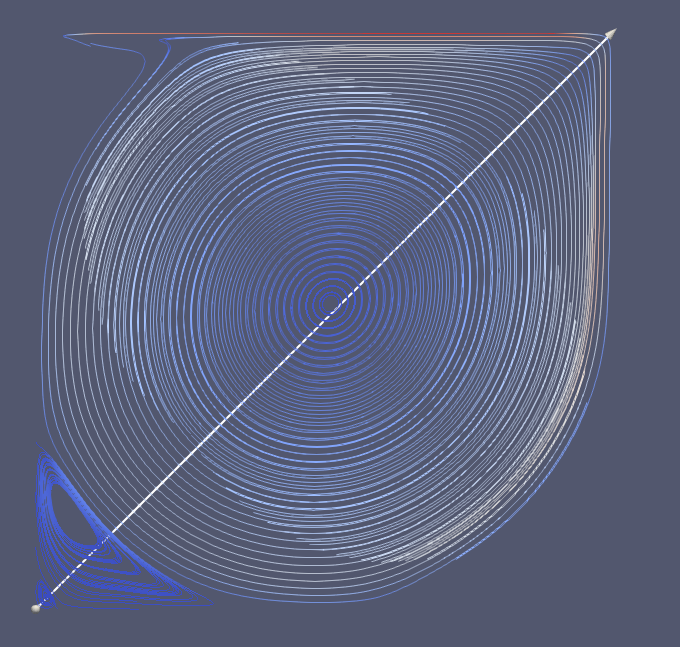
In the second figure, we see that two secondary vortices are in the bottom left. When I flip the center of the axis, the first figure shows that the bottom left vortex is removed, and three vortices appear at the bottom right and top left.
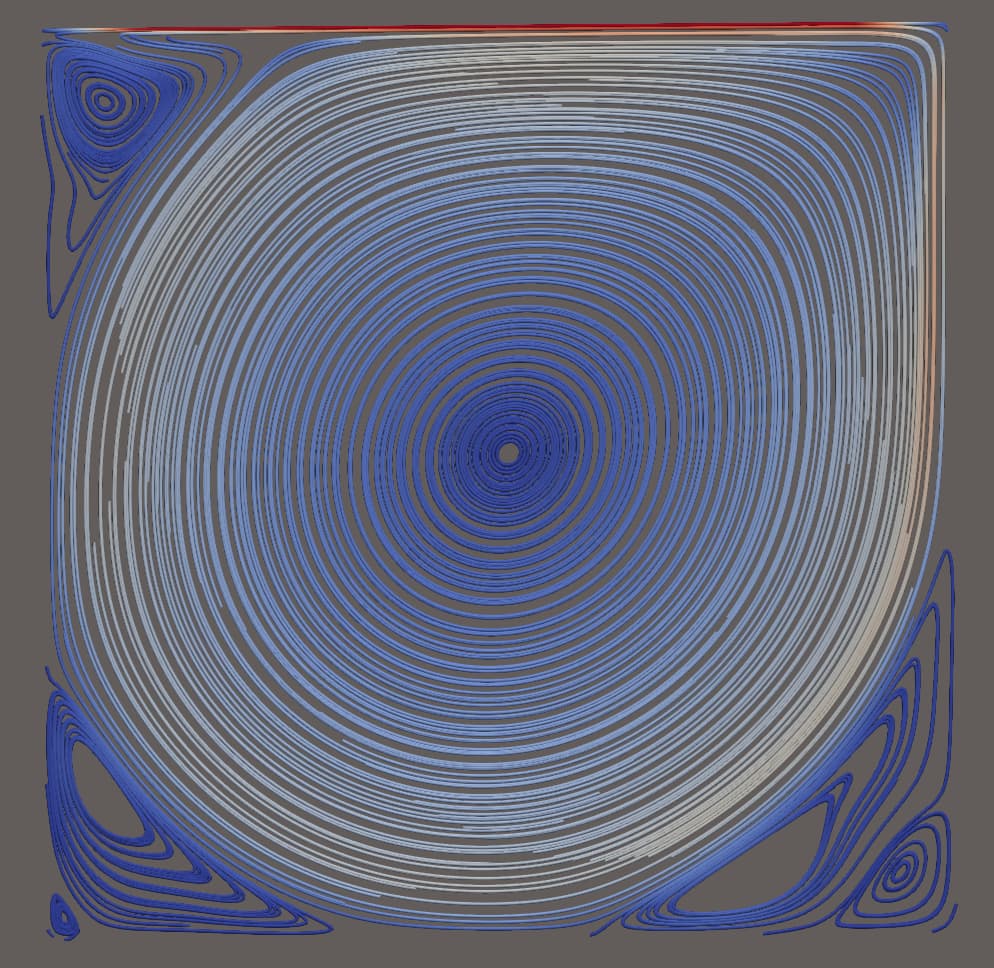
Is there a way to display all six vortices in a single picture? Please help me with this. How can we improve he presentation of these pictures ?
[velocity\_noslip.pvd](https://discourse.paraview.org/uploads/short-url/eC4QPIe3xSKdHRXAQJjYy1asQpn.pvd) (177 Bytes)
[velocity\_noslip000000.vtu](https://discourse.paraview.org/uploads/short-url/hsEFRv1BAITih6Cqe293fLZyHmQ.vtu) (2.2 MB)
---
### Author:  [@sherin.sugathan](https://discourse.paraview.org/u/sherin.sugathan)
#### Post date: [June 16, 2024, 8:57am UTC](https://discourse.paraview.org/t/regarding-streamlines/14852/2 "2024-06-16T08:57:24Z")
> [@Stayal](#):
>
> y to display all six vortices in a single picture? Please help me with this. How can we improve he presentation of these pictures ?
You can make use of **StreamTracerWithCustomSource** , which allows you make use of any arbitrary source as a seed. To align with your usage of line source, you may consider combining two line sources into one (using AppendDataset) and then use the combined lines as a source for the StreamTracer. Changing the resolution of the lines to a desired value can help you adjust the density of the streamlines that appear. Please mark the reply as a solution if the method works for you.
---
### Author:  [@Stayal](https://discourse.paraview.org/u/Stayal)
#### Post date: [June 16, 2024, 9:18am UTC](https://discourse.paraview.org/t/regarding-streamlines/14852/3 "2024-06-16T09:18:20Z")
I want the same solution as you provided. Can you explain me in detail ?
Using append data set I will combine both the line source and get the desired result. I didn’t understand what is the use of **StreamTracerWithCustomSource**?
---
### Author:  [@sherin.sugathan](https://discourse.paraview.org/u/sherin.sugathan)
#### Post date: [June 16, 2024, 9:52am UTC](https://discourse.paraview.org/t/regarding-streamlines/14852/4 "2024-06-16T09:52:30Z")
In your case, a single line is the seed source.
In my solution, two lines together is a seed source. So it is a custom source I can use with the **StreamTracerWithCustomSource**
---
### Author:  [@Stayal](https://discourse.paraview.org/u/Stayal)
#### Post date: [June 16, 2024, 10:12am UTC](https://discourse.paraview.org/t/regarding-streamlines/14852/5 "2024-06-16T10:12:53Z")
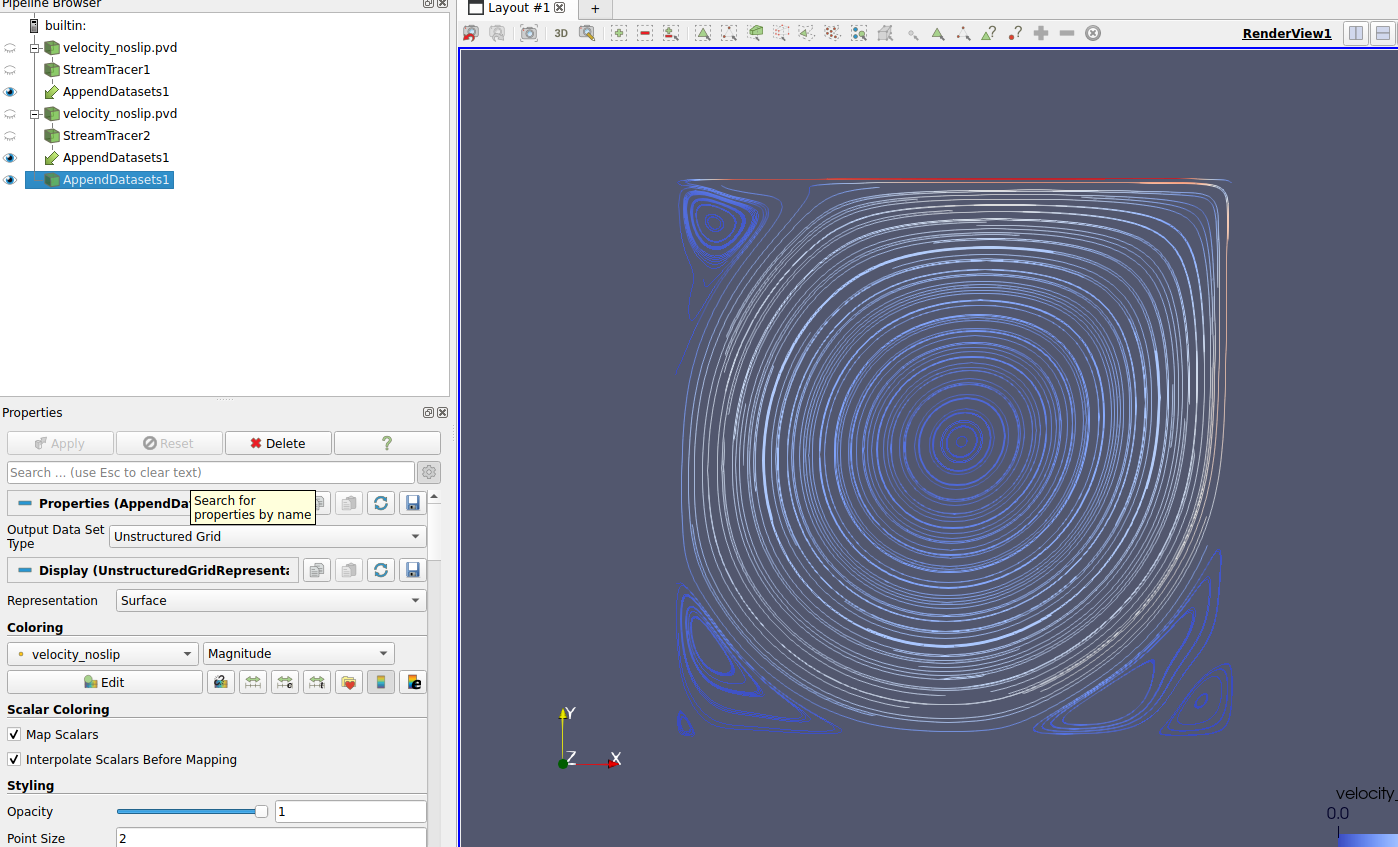
I tried the steps attached on the above screenshot (top-left) but didn’t understand the use of **StreamTracerWithCustomSource**. I don’t need this. Please look into it. Is I am doing correctly ?
Thank you so much for your help!
---
### Author:  [@sherin.sugathan](https://discourse.paraview.org/u/sherin.sugathan)
#### Post date: [June 16, 2024, 10:37am UTC](https://discourse.paraview.org/t/regarding-streamlines/14852/6 "2024-06-16T10:37:03Z")
yes, both works. but **StreamTracerWithCustomSource** can take custom sources like a curve instead of a line as the point source. Can be useful in some scenarios. Good work!
---
### Author:  [@Stayal](https://discourse.paraview.org/u/Stayal)
#### Post date: [June 16, 2024, 11:11am UTC](https://discourse.paraview.org/t/regarding-streamlines/14852/7 "2024-06-16T11:11:32Z")
One more thing: as in my plot some streamlines break. Can I do something about that? Below, I also attach the diagram and I want streamlines similar to that.
Should I put the colored square to mark the position of the vortex?
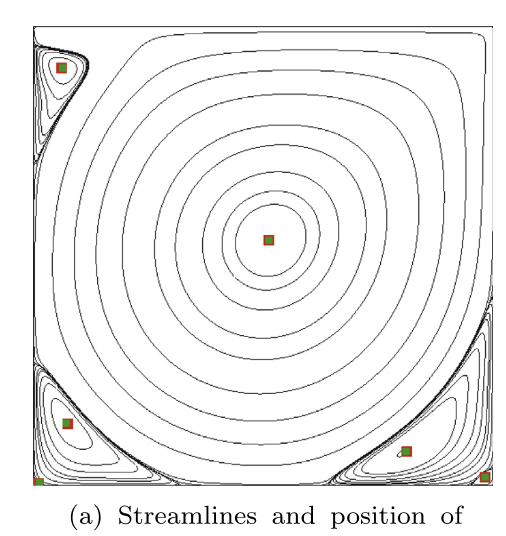
Please help me in this regard as well !
---
### Author:  [@sherin.sugathan](https://discourse.paraview.org/u/sherin.sugathan)
#### Post date: [June 16, 2024, 11:27am UTC](https://discourse.paraview.org/t/regarding-streamlines/14852/8 "2024-06-16T11:27:53Z")
> [@Stayal](#):
>
> One more thing: as in my plot some streamlines break. Can I do something about that? Below, I also attach the diagram and I want streamlines similar to that.
This is purely dependent on the data and also streamtracer settings. Possible reasons could be insufficient integration steps, complex fields, or numerical inaccuracies. Try changing the streamtracer properties that can help the streamtracer to integrate further without breaking.
> [@Stayal](#):
>
> Should I put the colored square to mark the position of the vortex?
That is totally up to you. If you are trying to make things easier to the person/reader who interpret the streamlines, you can always add indicators but in your case, the colored squares are in fact hiding the visualization of two smaller vortices at the bottom extremes.