# segmented line plot
**URL:** https://discourse.paraview.org/t/segmented-line-plot/13986
**Category:** ParaView Support
**Created:** [February 22, 2024, 1:25pm UTC](https://discourse.paraview.org/t/segmented-line-plot/13986 "2024-02-22T13:25:14Z")
**Posts on this page:** 5
**Page:** 1
### Author:  [@Ali1990dashti](https://discourse.paraview.org/u/Ali1990dashti)
#### Post date: [February 22, 2024, 1:25pm UTC](https://discourse.paraview.org/t/segmented-line-plot/13986/1 "2024-02-22T13:25:14Z")
Dear all,
I want to make a line plot in paraview but rather than astraght line, the line should be segmented. The fillowing figure shows how the line should look like:
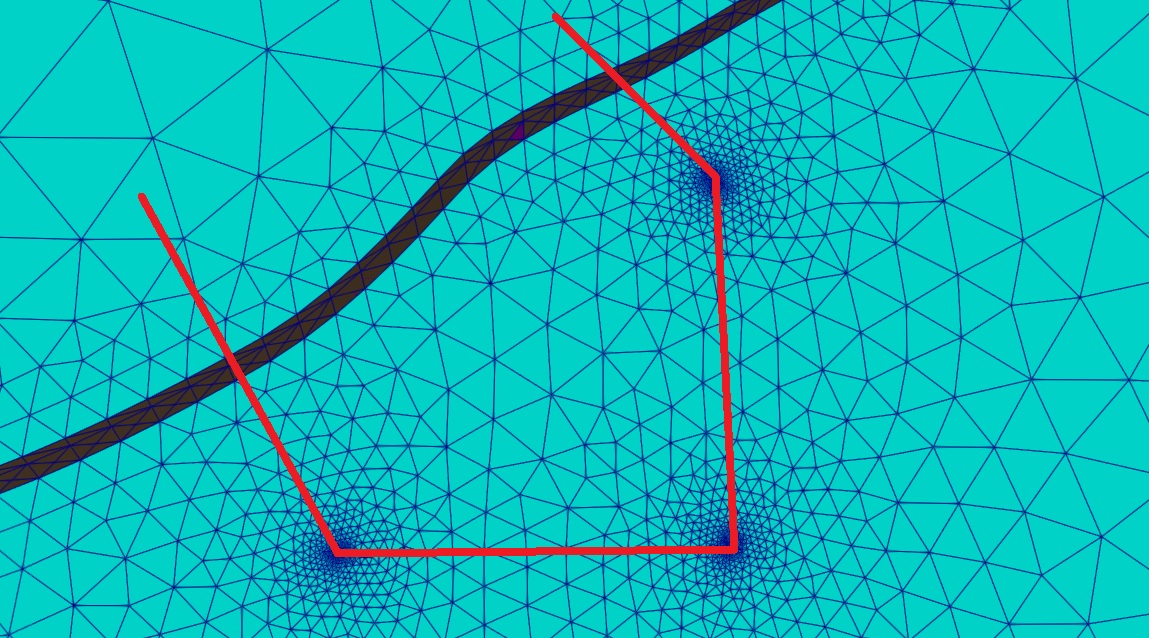
How can I define such trace in paraview? `Plot Over Line` filter only allows straight lines and recieves coordinates of start and end point while I want to break the line and change the direction. Shoud I make 4 line plots and then fuse them?
Thanks for any help.
Cheers
---
### Author:  [@Kenneth\_Moreland](https://discourse.paraview.org/u/Kenneth_Moreland)
#### Post date: [February 22, 2024, 3:10pm UTC](https://discourse.paraview.org/t/segmented-line-plot/13986/2 "2024-02-22T15:10:10Z")
Internally, the `Plot Over Line` filter creates a `Line` source, does a `Resample With Dataset` of the mesh onto the line. There is an internal hint to plot this in an X-Y view.
You can repeat this process with any geometry you like. In your case, you can create multiple `Line` sources yourself that together form the curve you want your plot to follow. When you create the `Line`, I suggest increasing the `Resolution` parameter as this will determine how many samples will be taken on each line.
Once you have all the lines, use the `Append Geometry` filter to combine them all into a single dataset.
Next, use the `Resample With Dataset` filter. Set your input mesh as the `Source Data Arrays` input and your combined lines as the `Destination Mesh`.
From here, you could use the `Plot Data` to plot the data on the lines to an X-Y plot. This will work (if the order of everything is just right), but it will not take into account the distance of samples in each line. You will probably have more satisfactory results if you instead run the `Triangulate` filter (to convert polylines to lines) and then the `Plot On Sorted Lines` filter. This will make sure everything is in order and will take into account the distance traveled along the segmented line.
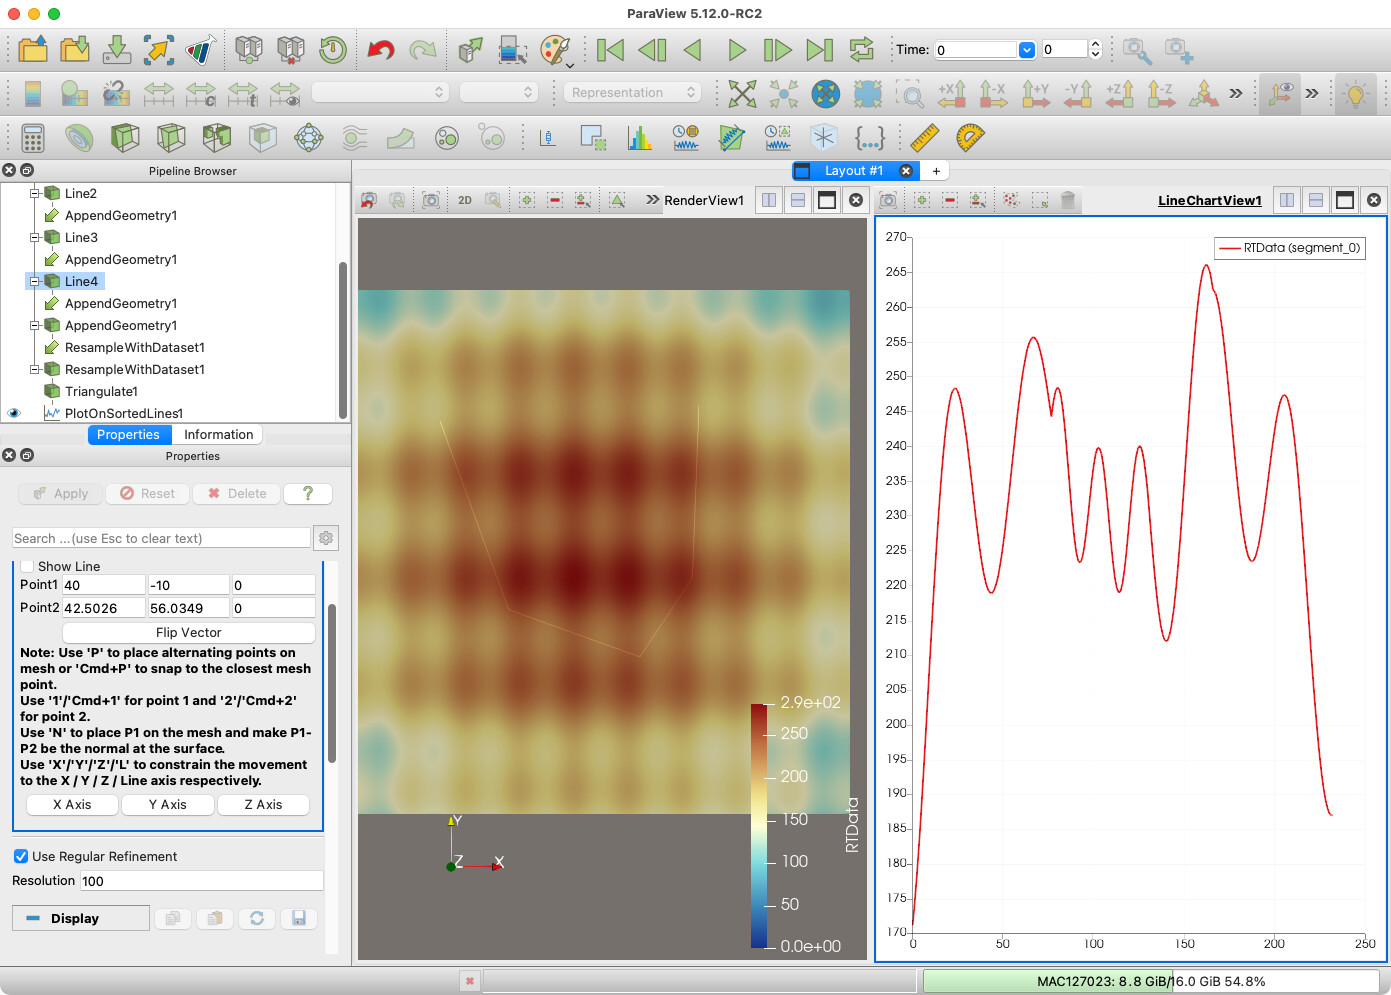
Here is a state file showing an example of this on some generated data:
[plot-on-line-segments-example.pvsm](https://discourse.paraview.org/uploads/short-url/z9Ihml7eOZiGRzJighGI46tIjCP.pvsm) (948.3 KB)
Here is a screenshot of that:
---
### Author:  [@Ali1990dashti](https://discourse.paraview.org/u/Ali1990dashti)
#### Post date: [February 23, 2024, 8:36am UTC](https://discourse.paraview.org/t/segmented-line-plot/13986/3 "2024-02-23T08:36:13Z")
Dear @Kenneth_Moreland , thanks a lot for your efficient solution. I looked into your state file. Which filter have you used to find the `Plot Data`? Is it one of the filters and should I do it on the `ResampleWithDataset1`? I also could not find the `Triangulate` filter. I am using Paraview 5.11.0. Can you please share your Python trace file with me? Or is it possible to share screen recordings? It can be super helpful. Some times it is not easy to find the filters through the GUI.
Thanks,
---
### Author:  [@Kenneth\_Moreland](https://discourse.paraview.org/u/Kenneth_Moreland)
#### Post date: [February 23, 2024, 12:53pm UTC](https://discourse.paraview.org/t/segmented-line-plot/13986/4 "2024-02-23T12:53:49Z")
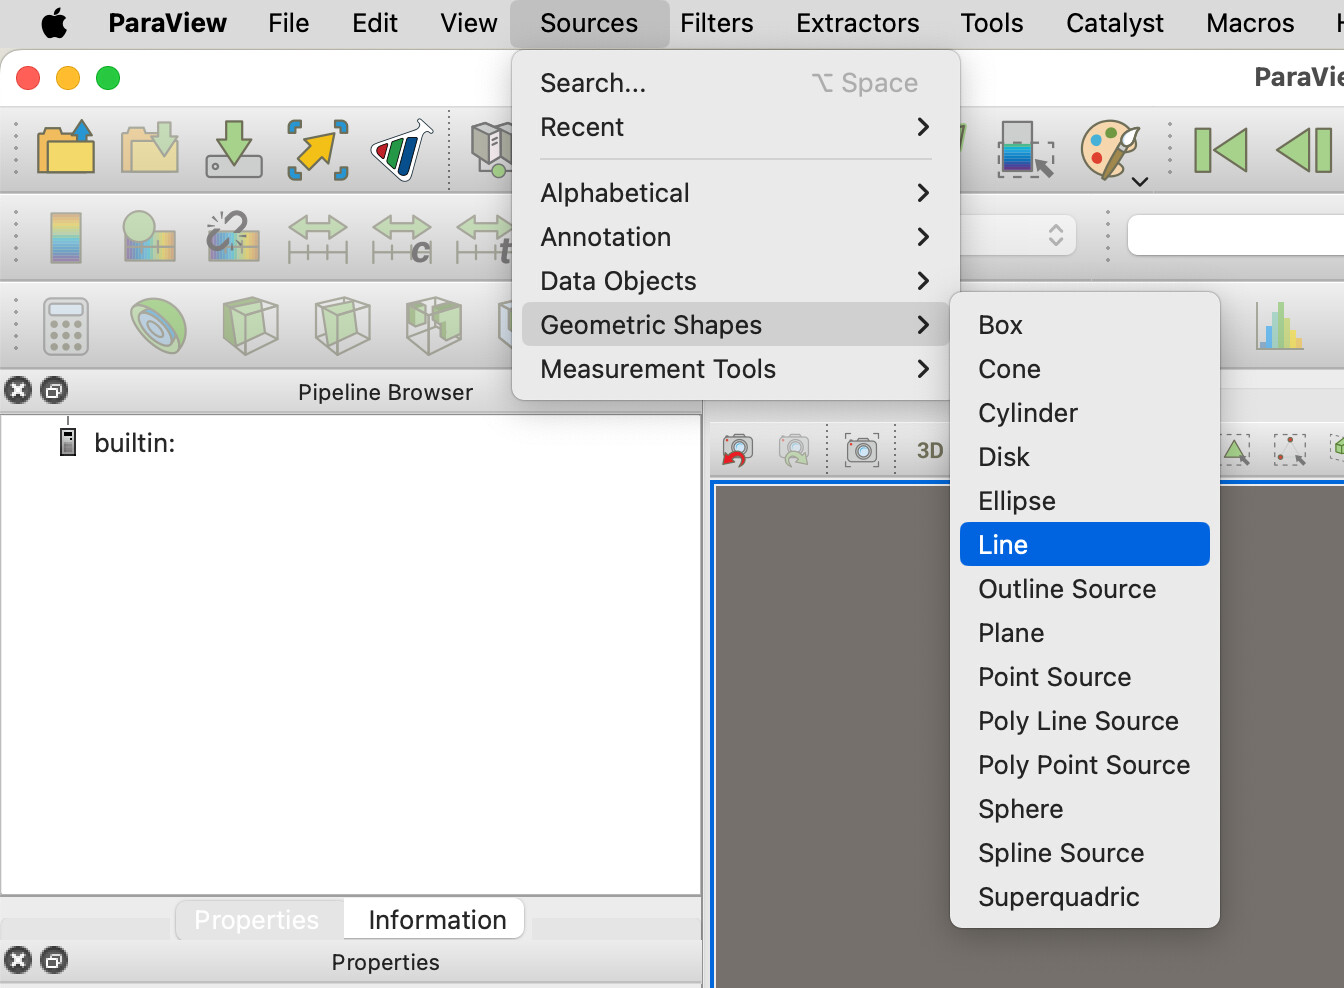
`Line` is a source, not a filter. Like a reader, it does not take input from another pipeline object. Thus, you will find it under the `Sources` menu instead of the `Filters` menu.
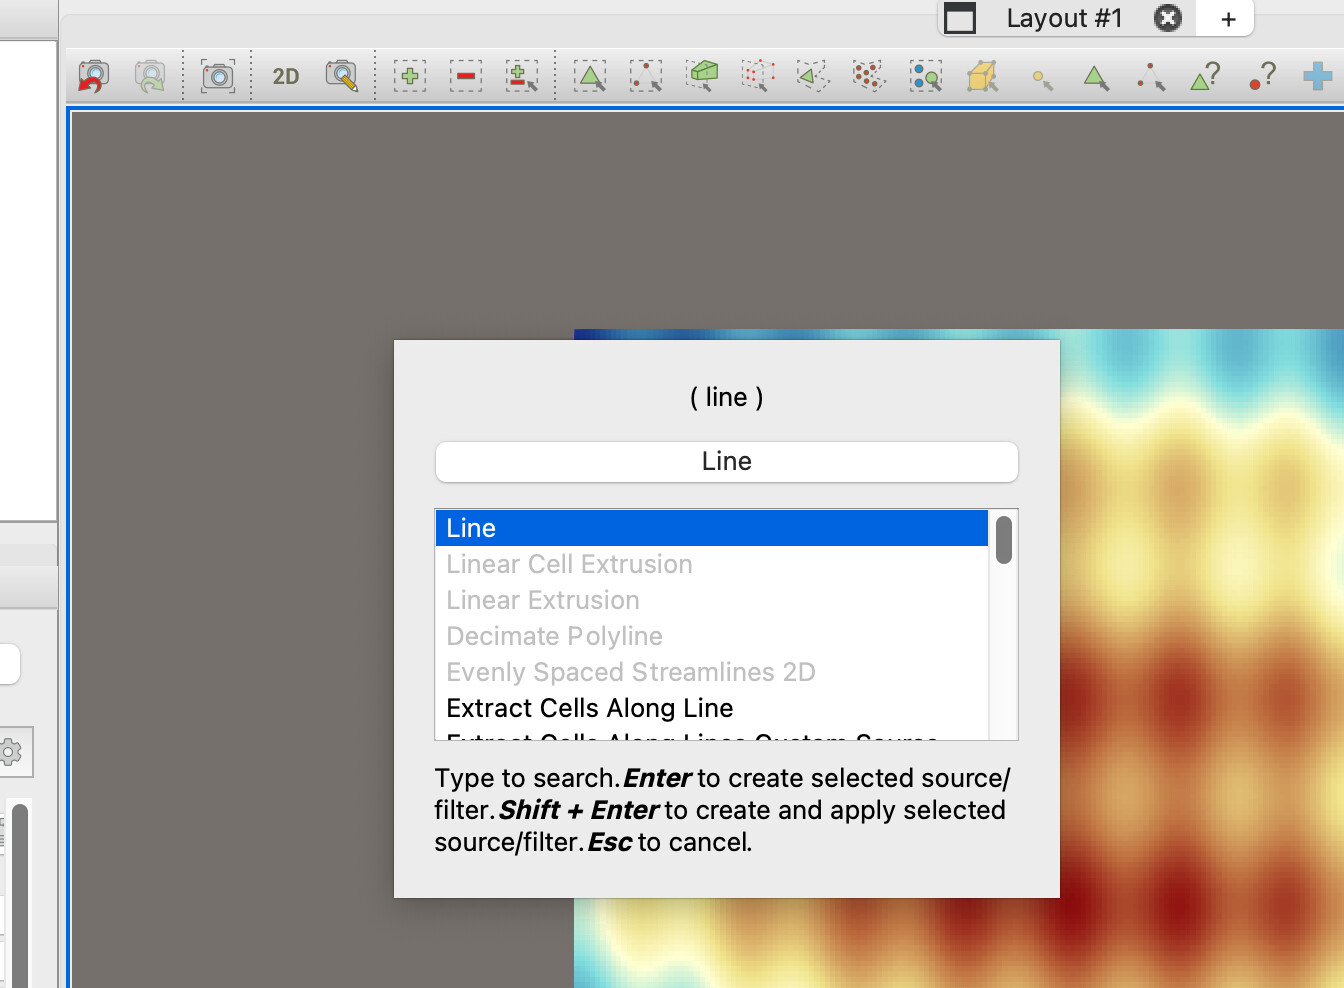
That said, you will still find sources like `Line` in the quick search dialog (ctrl-space or option-space) along with the filters. That’s how I usually find sources and filters because I don’t have to hunt around the menus.
---
### Author:  [@Ali1990dashti](https://discourse.paraview.org/u/Ali1990dashti)
#### Post date: [February 23, 2024, 12:56pm UTC](https://discourse.paraview.org/t/segmented-line-plot/13986/5 "2024-02-23T12:56:12Z")
Thanks a lot,
Now, I see it.