# showing vorticity with vtr file : paraview 5.7
**URL:** https://discourse.paraview.org/t/showing-vorticity-with-vtr-file-paraview-5-7/3413
**Category:** ParaView Support
**Created:** [January 27, 2020, 11:52am UTC](https://discourse.paraview.org/t/showing-vorticity-with-vtr-file-paraview-5-7/3413 "2020-01-27T11:52:05Z")
**Posts on this page:** 16
**Page:** 1
### Author:  [@laurence](https://discourse.paraview.org/u/laurence)
#### Post date: [January 27, 2020, 11:52am UTC](https://discourse.paraview.org/t/showing-vorticity-with-vtr-file-paraview-5-7/3413/1 "2020-01-27T11:52:05Z")
hello all,
just to say I think there is a bug when showing vorticity with paraview 5.7 ([https://www.paraview.org/paraview-downloads/download.php?submit=Download&version=v5.7&type=binary&os=Linux&downloadFile=ParaView-5.7.0-MPI-Linux-Python3.7-64bit.tar.gz](https://www.paraview.org/paraview-downloads/download.php?submit=Download&version=v5.7&type=binary&os=Linux&downloadFile=ParaView-5.7.0-MPI-Linux-Python3.7-64bit.tar.gz))
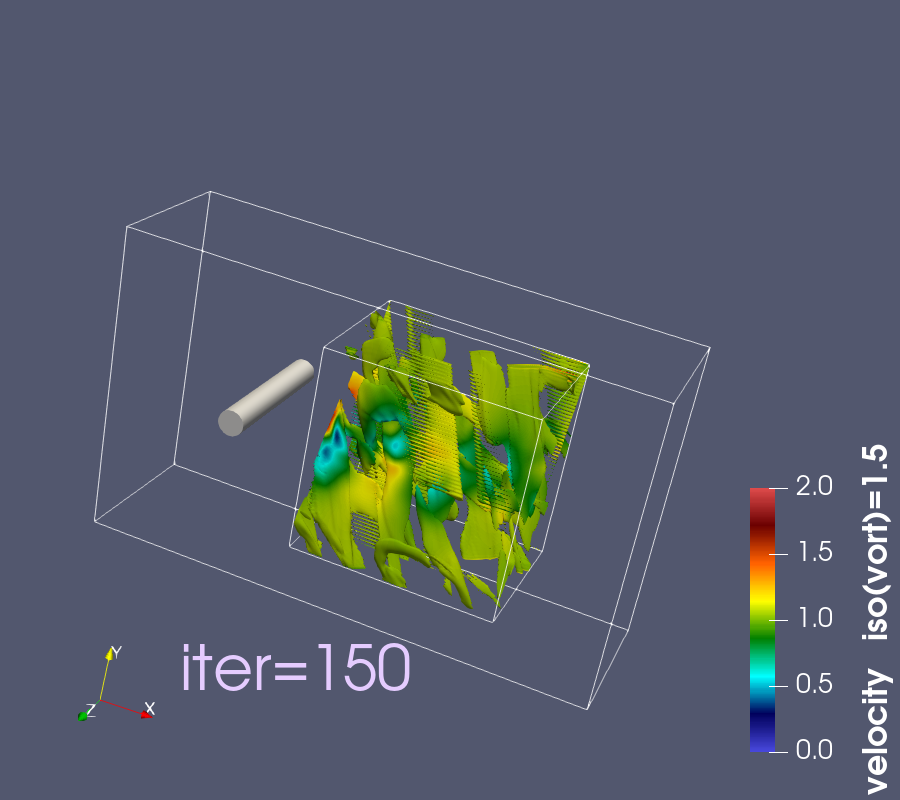
You can avoid it with pvbatch, by changing **[CELLS]** to **[POINTS]** :slight\_smile, like this :
```
# create a new 'Compute Derivatives'
computeDerivatives1 = ComputeDerivatives(Input=vitvtr)
computeDerivatives1.Scalars = ['POINTS', 'vit_Magnitude']
computeDerivatives1.Vectors = ['POINTS', 'vit']
computeDerivatives1.OutputVectorType = 'Vorticity'
# create a new 'Contour'
contour1 = Contour(Input=transform2)
#contour1.ContourBy = ['CELLS', 'Vorticity_Magnitude']
**contour1.ContourBy = ['POINTS', 'Vorticity_Magnitude']**
contour1.Isosurfaces = [1.5]
contour1.PointMergeMethod = 'Uniform Binning'
```

OR you can calculated vorticity like in older release, by defining the gradient (see below).
I hope it can help someone
* * *
Code Example
[Vort\_calculated\_by\_paraview.py](https://discourse.paraview.org/uploads/short-url/lcbbhBd7hsbhpJ2AQvo3QdX7YVl.py) (12.7 KB)
```
# state file generated using paraview version 5.7.0
# ----------------------------------------------------------------
# setup views used in the visualization
# ----------------------------------------------------------------
# trace generated using paraview version 5.7.0
#
# To ensure correct image size when batch processing, please search
# for and uncomment the line `# renderView*.ViewSize = [*,*]`
#### import the simple module from the paraview
from paraview.simple import *
#### disable automatic camera reset on 'Show'
paraview.simple._DisableFirstRenderCameraReset()
# get the material library
materialLibrary1 = GetMaterialLibrary()
# Create a new 'Render View'
renderView1 = CreateView('RenderView')
renderView1.ViewSize = [1500, 850]
renderView1.AxesGrid = 'GridAxes3DActor'
renderView1.CenterOfRotation = [5.0, 6.0, 3] # centre du cylindre
renderView1.StereoType = 'Crystal Eyes'
renderView1.CameraPosition = [25, 30, 50] # vers l'aval
renderView1.CameraFocalPoint = [10, 5, -4] # derrière le volume
#renderView1.CameraViewUp = [-0.25, 0.95, -0.23] # vue un peu de dessus
renderView1.CameraViewUp = [-0.3, 0.9, -0.3] # vue un peu de dessus
renderView1.CameraFocalDisk = 1.0
renderView1.CameraParallelScale = 1.2
renderView1.Background = [0.32, 0.34, 0.43]
renderView1.BackEnd = 'OSPRay raycaster'
renderView1.OSPRayMaterialLibrary = materialLibrary1
SetActiveView(None)
# ----------------------------------------------------------------
# setup view layouts
# ----------------------------------------------------------------
# create new layout object 'Layout #1'
layout1 = CreateLayout(name='Layout #1')
layout1.AssignView(0, renderView1)
# ----------------------------------------------------------------
# restore active view
SetActiveView(renderView1)
# ----------------------------------------------------------------
# ----------------------------------------------------------------
# setup the data processing pipelines
# ----------------------------------------------------------------
# create a new 'Text'
text1 = Text()
text1.Text = 'iter=150'
# create a new 'Cylinder'
cylinder1 = Cylinder()
cylinder1.Resolution = 25
cylinder1.Height = 6.0
cylinder1.Radius = 0.5
# create a new 'Box'
box1 = Box()
box1.XLength = 20.0
box1.YLength = 12.0
box1.ZLength = 6.0
box1.Center = [10.0, 6.0, 3.0]
# create a new 'Transform'
transform1 = Transform(Input=cylinder1)
transform1.Transform = 'Transform'
# init the 'Transform' selected for 'Transform'
transform1.Transform.Translate = [5.0, 6.0, 3.0]
transform1.Transform.Rotate = [90.0, 0.0, 0.0]
# create a new 'XML Rectilinear Grid Reader'
vitvtr = XMLRectilinearGridReader(FileName=[Vit.vtr'])
#vitvtr.PointArrayStatus = ['vit', 'vit_norm']
vitvtr.PointArrayStatus = ['vit']
### VORTICITY colored by VELOCITY ###
code_vort = 2
############### CONTOUR by [computeDerivatives = vorticiy] -> ERROR : [POINT] not [CELLS] ##############
if code_vort == 1:
# create a new 'Compute Derivatives'
computeDerivatives1 = ComputeDerivatives(Input=vitvtr)
computeDerivatives1.Scalars = ['POINTS', 'vit_Magnitude']
computeDerivatives1.Vectors = ['POINTS', 'vit']
computeDerivatives1.OutputVectorType = 'Vorticity'
# create a new 'Transform'
transform2 = Transform(Input=computeDerivatives1)
transform2.Transform = 'Transform'
# init the 'Transform' selected for 'Transform'
transform2.Transform.Translate = [8.0, 2.0, 0.0]
# create a new 'Contour'
contour1 = Contour(Input=transform2)
#contour1.ContourBy = ['CELLS', 'Vorticity_Magnitude']
contour1.ContourBy = ['POINTS', 'Vorticity_Magnitude']
contour1.Isosurfaces = [1.5]
contour1.PointMergeMethod = 'Uniform Binning'
############### CONTOUR by [computeDerivatives = gradient] ##############
else:
# create a new 'Compute Derivatives'
computeDerivatives1 = ComputeDerivatives(Input=vitvtr)
computeDerivatives1.Scalars = ['POINTS', 'vit_Magnitude']
computeDerivatives1.Vectors = ['POINTS', 'vit']
computeDerivatives1.OutputVectorType = 'Scalar Gradient'
# create a new 'Transform'
transform2 = Transform(Input=computeDerivatives1)
transform2.Transform = 'Transform'
# init the 'Transform' selected for 'Transform'
transform2.Transform.Translate = [8.0, 2.0, 0.0]
# create a new 'Calculator'
calculator1 = Calculator(Input=transform2)
calculator1.AttributeType = 'Cell Data'
calculator1.ResultArrayName = 'vort'
calculator1.Function = '(VectorGradient_5-VectorGradient_7)*iHat+(VectorGradient_6-VectorGradient_2)*jHat+(VectorGradient_1-VectorGradient_3)*kHat'
# create a new 'Cell Data to Point Data'
cellDatatoPointData1 = CellDatatoPointData(Input=calculator1)
#cellDatatoPointData1.CellDataArraytoprocess = ['vit', 'vit_Magnitude', 'ScalarGradient', 'VectorGradient', 'VectorGradient_Magnitude', 'vort']
cellDatatoPointData1.CellDataArraytoprocess = ['vit', 'vit_Magnitude', 'vort', 'vort_Magnitude']
# create a new 'Contour'
contour1 = Contour(Input=cellDatatoPointData1)
contour1.ContourBy = ['POINTS', 'vort_Magnitude']
contour1.Isosurfaces = [1.5]
contour1.PointMergeMethod = 'Uniform Binning'
```
…
---
### Author:  [@mwestphal](https://discourse.paraview.org/u/mwestphal)
#### Post date: [January 27, 2020, 11:54am UTC](https://discourse.paraview.org/t/showing-vorticity-with-vtr-file-paraview-5-7/3413/2 "2020-01-27T11:54:56Z")
Hi, sorry, your post was not approved as a tips and tricks as it seems very specific.
Could you elaborate on the bug though. What is not working as expected ?
---
### Author:  [@laurence](https://discourse.paraview.org/u/laurence)
#### Post date: [January 27, 2020, 12:14pm UTC](https://discourse.paraview.org/t/showing-vorticity-with-vtr-file-paraview-5-7/3413/3 "2020-01-27T12:14:47Z")
I’m sorry if it wasn’t clear enough : in fact when using paraview with GUI, the generation of vorticity from velocity vector is wrong.
One way I found to correct this was to use the online launcher (pvbatch python\_file) : after saving state in python file, I modify the python file either by replacing CELLS by POINTs in contour defining, or by calculating vorticity from grad(velocity).
I hope it’s more clear !
---
### Author:  [@mwestphal](https://discourse.paraview.org/u/mwestphal)
#### Post date: [January 27, 2020, 12:15pm UTC](https://discourse.paraview.org/t/showing-vorticity-with-vtr-file-paraview-5-7/3413/4 "2020-01-27T12:15:44Z")
> the generation of vorticity
How do you generate vorticity ? What is wrong about it ?
---
### Author:  [@laurence](https://discourse.paraview.org/u/laurence)
#### Post date: [January 27, 2020, 12:29pm UTC](https://discourse.paraview.org/t/showing-vorticity-with-vtr-file-paraview-5-7/3413/5 "2020-01-27T12:29:48Z")
to generate vorticity I simply choose Vorticity in computeDerivatives, but the result isn’t correct, that why I’ve modified the python file after saving the state in this format

bad view without modifying the python script =

good view when modifying the python script =

---
### Author:  [@mwestphal](https://discourse.paraview.org/u/mwestphal)
#### Post date: [January 27, 2020, 12:31pm UTC](https://discourse.paraview.org/t/showing-vorticity-with-vtr-file-paraview-5-7/3413/6 "2020-01-27T12:31:41Z")
Could you share this vit.vtr ?
---
### Author:  [@laurence](https://discourse.paraview.org/u/laurence)
#### Post date: [January 27, 2020, 12:37pm UTC](https://discourse.paraview.org/t/showing-vorticity-with-vtr-file-paraview-5-7/3413/7 "2020-01-27T12:37:34Z")
of course I try to tar it in order to make it smaller an d send it
P.S. its structure is as below
---
### Author:  [@laurence](https://discourse.paraview.org/u/laurence)
#### Post date: [January 27, 2020, 12:47pm UTC](https://discourse.paraview.org/t/showing-vorticity-with-vtr-file-paraview-5-7/3413/8 "2020-01-27T12:47:45Z")
VTR file : file is to big
I try to reduce it to some points
---
### Author:  [@laurence](https://discourse.paraview.org/u/laurence)
#### Post date: [January 27, 2020, 1:50pm UTC](https://discourse.paraview.org/t/showing-vorticity-with-vtr-file-paraview-5-7/3413/9 "2020-01-27T13:50:15Z")
here is a
vtr file (1 point kept every 3 points of the previous vtr file)
[test.vtr.tar.gz](https://discourse.paraview.org/uploads/short-url/aEEoPy6UrHu6hVB81dpHT9zITiA.gz) (1.9 MB)
here the python file to obtain the image file below
[test.py](https://discourse.paraview.org/uploads/short-url/thfygmYpLQQspac5Ir5t4iDxbiO.py) (12.8 KB)

---
### Author:  [@mwestphal](https://discourse.paraview.org/u/mwestphal)
#### Post date: [January 28, 2020, 4:09am UTC](https://discourse.paraview.org/t/showing-vorticity-with-vtr-file-paraview-5-7/3413/10 "2020-01-28T04:09:02Z")
The contour filter does not support contouring by cells at all, even though python let you do it, you cannot select a cell array using the GUI.
Why did you write this line in the first place ? :
`contour1.ContourBy = ['CELLS', 'Vorticity_Magnitude']`
---
### Author:  [@laurence](https://discourse.paraview.org/u/laurence)
#### Post date: [January 28, 2020, 7:14am UTC](https://discourse.paraview.org/t/showing-vorticity-with-vtr-file-paraview-5-7/3413/11 "2020-01-28T07:14:17Z")
I have’nt chosen to write this line, it was automatically produced when saving the state in python file. And as I have already used older release of paraview in which you must passed CELLs to POSTs in order to compute derivatives before defining vorticity (like in the second part of the [if loop]), I’ve changed this line, and it works.
In fact, I’m not surprised that the state python file doesn’t use the right parameter, since the view is wrong in GUI too : it’s not the case with an older paraview (paraview 5.0.1. OS ubuntu) as you can see on this snapshot
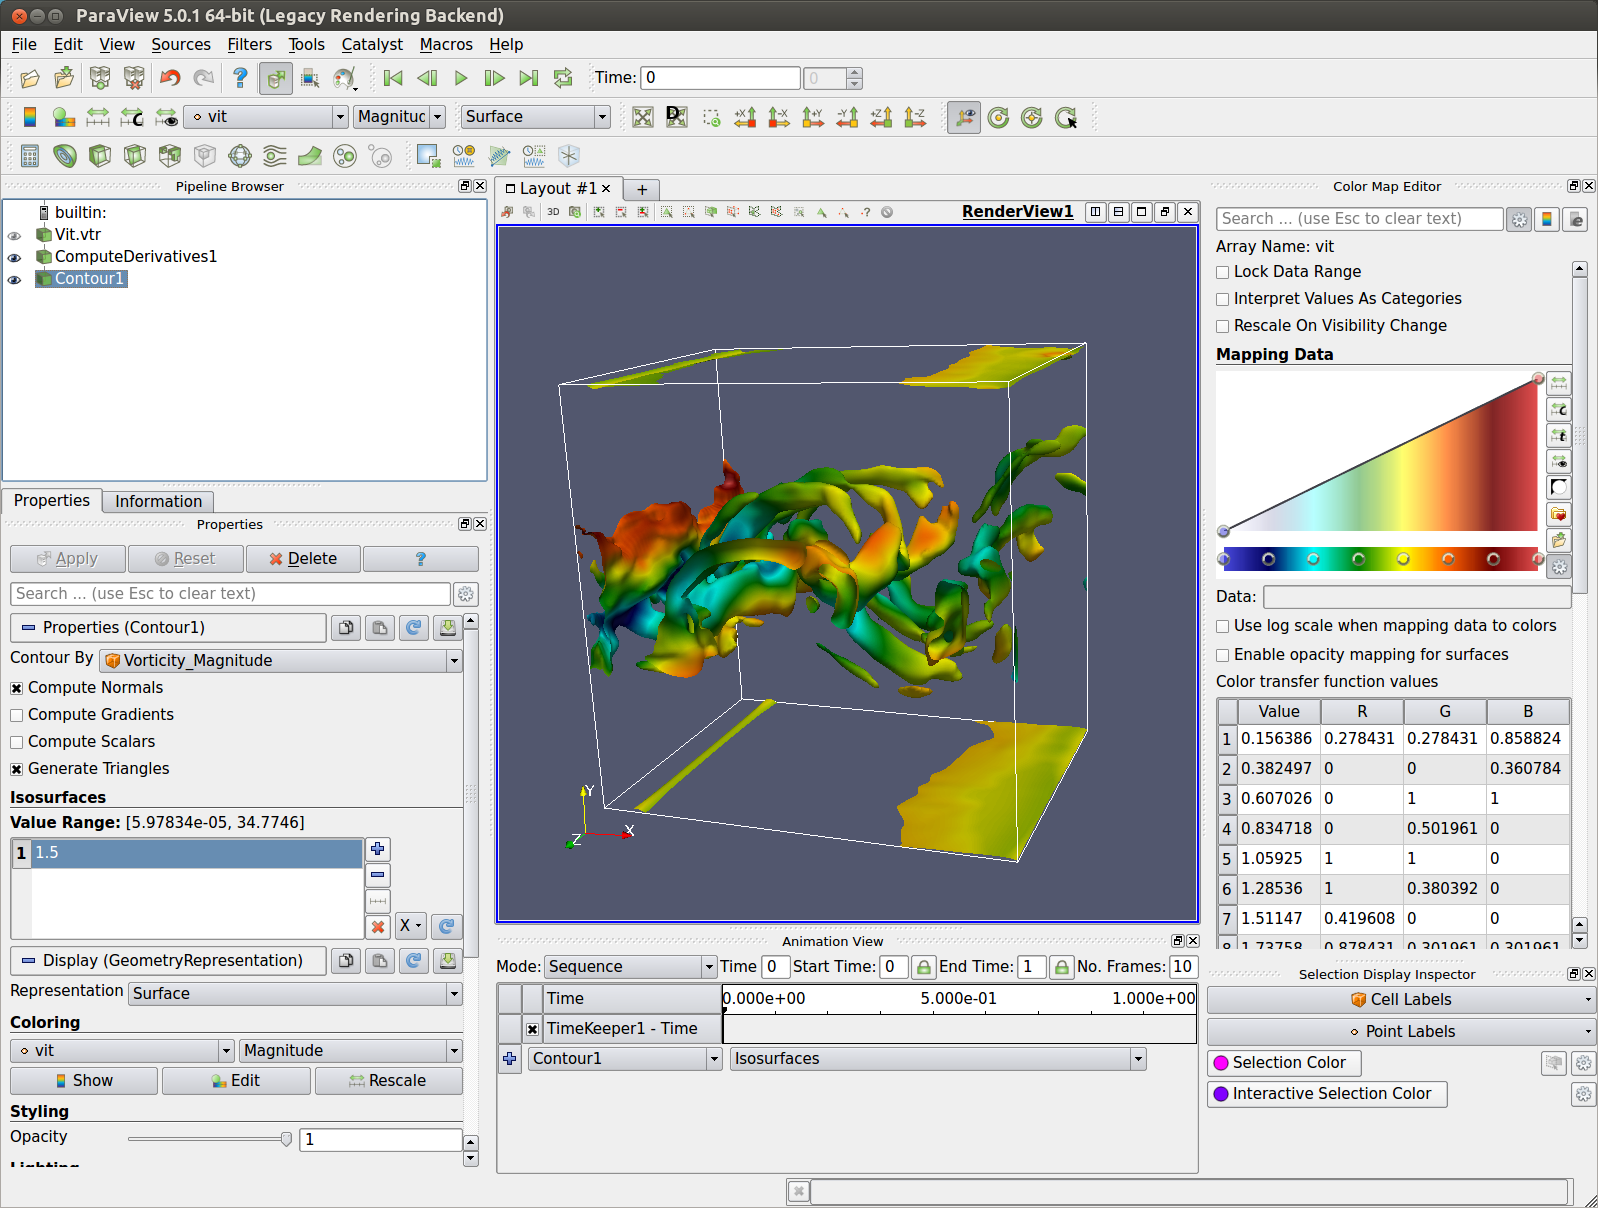.
but, for a reason I ignore, the same operation with paraview 5.7.0 give this picture :
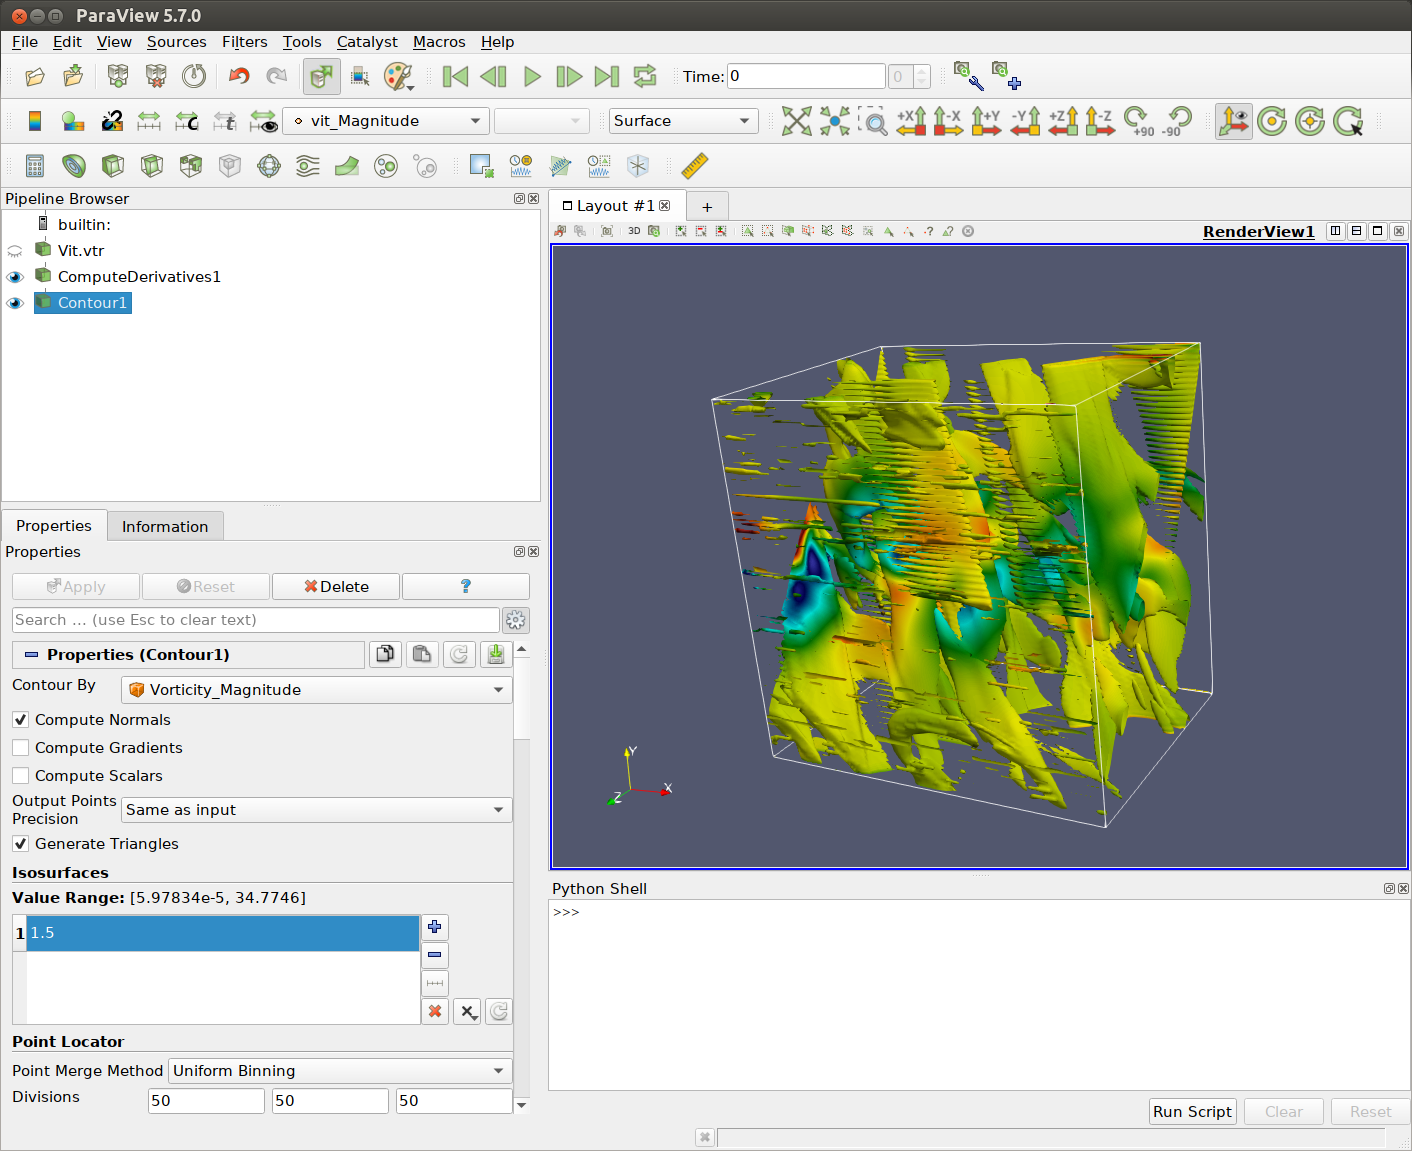
I’s perhaps related to some OS configuration ??? python conflict ???
---
### Author:  [@mwestphal](https://discourse.paraview.org/u/mwestphal)
#### Post date: [January 28, 2020, 7:36am UTC](https://discourse.paraview.org/t/showing-vorticity-with-vtr-file-paraview-5-7/3413/12 "2020-01-28T07:36:53Z")
Looks like you are using the setting Auto Convert Properties (Edit -\> Settings -\> AutoConvertProperties).
It indeeds look like this conversion is not done correctly. If you disable this and use CellDataToPointData instead it should be fine in the GUI too.
@cory.quammen : FYI
---
### Author:  [@laurence](https://discourse.paraview.org/u/laurence)
#### Post date: [January 28, 2020, 10:26am UTC](https://discourse.paraview.org/t/showing-vorticity-with-vtr-file-paraview-5-7/3413/13 "2020-01-28T10:26:37Z")
I’ve tried what you suggested (unselect Edit -\> Settings -\> AutoConvertProperties) but it doesn’t work : I can have velocity (contour) colored by vorticity, but not vorticity colored by velocity since the menu **Contour By** doesn’t let me choose another thing than vit\_norm. In fact, the result is the same with or without **CellData to PointData** before **Contour**.
never mind, there is always the solution of redefining the vorticity!
have a good day
… and thank you again for your help
I’ve tried these two sequences :
1)
- Compute Derivative
- CellData to PointData
- Contour
or 2)
- Compute Derivative
- Contour
---
### Author:  [@cory.quammen](https://discourse.paraview.org/u/cory.quammen)
#### Post date: [January 28, 2020, 2:40pm UTC](https://discourse.paraview.org/t/showing-vorticity-with-vtr-file-paraview-5-7/3413/14 "2020-01-28T14:40:40Z")
> [@mwestphal](#):
>
> It indeeds look like this conversion is not done correctly. If you disable this and use CellDataToPointData instead it should be fine in the GUI too.
That should be fixed in [https://gitlab.kitware.com/paraview/paraview/merge\_requests/3855](https://gitlab.kitware.com/paraview/paraview/merge_requests/3855)
---
### Author:  [@laurence](https://discourse.paraview.org/u/laurence)
#### Post date: [January 29, 2020, 6:57am UTC](https://discourse.paraview.org/t/showing-vorticity-with-vtr-file-paraview-5-7/3413/15 "2020-01-29T06:57:42Z")
thank you for your help, but my installed paraview is a compiled one : I suppose you should have source files to make the changes in [Qt/Components/pqArraySelectorPropertyWidget.cxx] ?
previously, I was used to making the install from the source files, but today, excepted this error, compiled paraview 5.7 work fine; for me the most important is to have pvbatch work correctly : I use the GUI only to have a model view, and then save the state in python, in order to modify it easily with unix tools.
however, I keep this information in mind, it can be useful for other releases, or for detecting other dysfunction
have a good day
---
### Author:  [@mwestphal](https://discourse.paraview.org/u/mwestphal)
#### Post date: [January 29, 2020, 10:46am UTC](https://discourse.paraview.org/t/showing-vorticity-with-vtr-file-paraview-5-7/3413/16 "2020-01-29T10:46:01Z")
You can just download the nightly or the upcoming 5.8RC2 release to get the fix.