# Simple: Exporting Point Data over time to excel table
**URL:** https://discourse.paraview.org/t/simple-exporting-point-data-over-time-to-excel-table/6756
**Category:** ParaView Support
**Created:** [March 22, 2021, 3:24am UTC](https://discourse.paraview.org/t/simple-exporting-point-data-over-time-to-excel-table/6756 "2021-03-22T03:24:31Z")
**Posts on this page:** 19
**Page:** 1
### Author:  [@ScientistRenzo](https://discourse.paraview.org/u/ScientistRenzo)
#### Post date: [March 22, 2021, 3:24am UTC](https://discourse.paraview.org/t/simple-exporting-point-data-over-time-to-excel-table/6756/1 "2021-03-22T03:24:31Z")
First time Paraview user,
I selected two points.
I can see the point data of the two selected points (temperature), in the SpreadSheetView.
As I play the simulation, the temperature data at these two points changes (good).
How can I tabulate/export the data into excel?
Thanks!
---
### Author:  [@utkarsh.ayachit](https://discourse.paraview.org/u/utkarsh.ayachit)
#### Post date: [March 22, 2021, 10:41am UTC](https://discourse.paraview.org/t/simple-exporting-point-data-over-time-to-excel-table/6756/2 "2021-03-22T10:41:41Z")
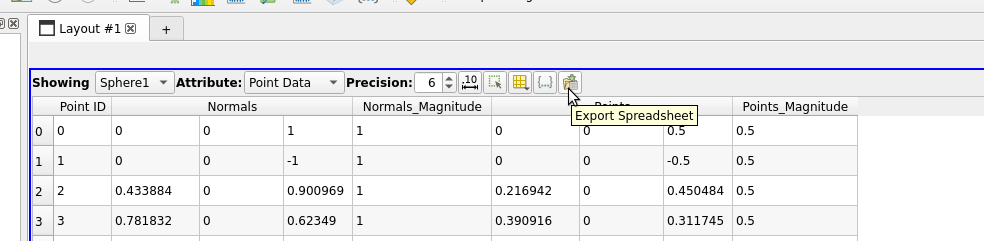
Easiest is to use the **Export Spreadsheet** button:
---
### Author:  [@ScientistRenzo](https://discourse.paraview.org/u/ScientistRenzo)
#### Post date: [March 22, 2021, 2:09pm UTC](https://discourse.paraview.org/t/simple-exporting-point-data-over-time-to-excel-table/6756/3 "2021-03-22T14:09:27Z")
I was given the option to save it as a .csv file. This did not produce the tabulated results I need on Excel. Can you advise me? Thanks for helping Utkrash.
---
### Author:  [@utkarsh.ayachit](https://discourse.paraview.org/u/utkarsh.ayachit)
#### Post date: [March 22, 2021, 2:23pm UTC](https://discourse.paraview.org/t/simple-exporting-point-data-over-time-to-excel-table/6756/4 "2021-03-22T14:23:00Z")
Excel can import `.csv` files. ParaView does not exporting directly to Excel file formats. You’ll have to import the csv into Excel.
---
### Author:  [@ScientistRenzo](https://discourse.paraview.org/u/ScientistRenzo)
#### Post date: [March 22, 2021, 5:42pm UTC](https://discourse.paraview.org/t/simple-exporting-point-data-over-time-to-excel-table/6756/5 "2021-03-22T17:42:01Z")
I can get the temperature data at all points at one time.
In fact, for my 10 second simulation, I have 10 excel files.
Each excel file displays the temperature at each point at one second.
I can also get another excel file to show me the temperature of the two points I want, only at one secone, t = 0 for example.
Here: Left = all points at one moment in time t = 0, Right = two points of data at one time t = 0
[[Album] Left = all points at time t, Right = point data at one time 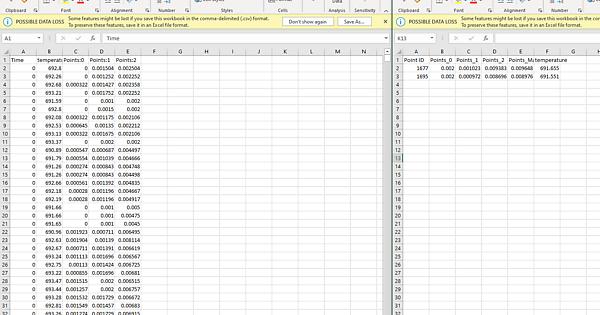 ](https://imgur.com/a/aqnrWM5)
I can pick out the data, excel file by excel file, but how can I do this faster - How can I export the two points of data, the temperature at these two points, every second of these 10 seconds. So 10 temperature data cells for each point. Two points, all temperature time measurements.
?
Thanks 🙂
---
### Author:  [@utkarsh.ayachit](https://discourse.paraview.org/u/utkarsh.ayachit)
#### Post date: [March 22, 2021, 5:51pm UTC](https://discourse.paraview.org/t/simple-exporting-point-data-over-time-to-excel-table/6756/6 "2021-03-22T17:51:40Z")
You can use **Plot Data Over Time** filter. Apply the filter to whatever source that producing the 2 values. Then show the data from this filter in a Spreadsheet view and you’ll all timesteps in a single file.
---
### Author:  [@ScientistRenzo](https://discourse.paraview.org/u/ScientistRenzo)
#### Post date: [March 22, 2021, 6:00pm UTC](https://discourse.paraview.org/t/simple-exporting-point-data-over-time-to-excel-table/6756/7 "2021-03-22T18:00:00Z")
Thank you for being so quick. Swift reply.
I opened my file. I clipped it to access the inside. I picked two points using Interactive Select Points. Then I opened up SpreadSheetView, Showing PlotDataOverTime, Point Data, Show only selected elements. The spreadsheet is blank. Could you please tell me how to do this the right way
[[Album] imgur.com 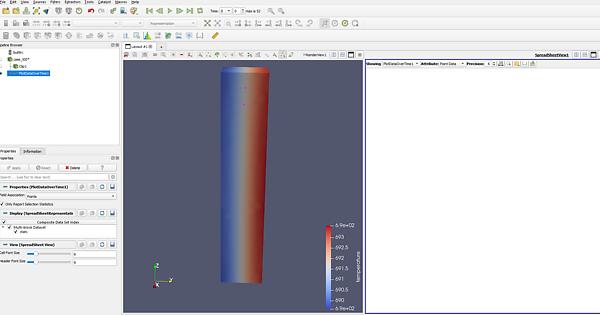 ](https://imgur.com/a/AQ6JaJF)
---
### Author:  [@utkarsh.ayachit](https://discourse.paraview.org/u/utkarsh.ayachit)
#### Post date: [March 22, 2021, 6:03pm UTC](https://discourse.paraview.org/t/simple-exporting-point-data-over-time-to-excel-table/6756/8 "2021-03-22T18:03:51Z")
can you share your data? it will make this easier.
---
### Author:  [@utkarsh.ayachit](https://discourse.paraview.org/u/utkarsh.ayachit)
#### Post date: [March 22, 2021, 6:04pm UTC](https://discourse.paraview.org/t/simple-exporting-point-data-over-time-to-excel-table/6756/9 "2021-03-22T18:04:58Z")
Looks like you’re selecting the 2 points. In that case, you may want to use the **Extract Selection Over Time** filter instead. If you share your data, I can upload a state file that does it.
---
### Author:  [@ScientistRenzo](https://discourse.paraview.org/u/ScientistRenzo)
#### Post date: [March 22, 2021, 6:07pm UTC](https://discourse.paraview.org/t/simple-exporting-point-data-over-time-to-excel-table/6756/10 "2021-03-22T18:07:19Z")
How should I share the Group file. It is 10 .vtu files.
I do not have Extract Selection Over Time, I have Extract Selection
---
### Author:  [@utkarsh.ayachit](https://discourse.paraview.org/u/utkarsh.ayachit)
#### Post date: [March 22, 2021, 6:10pm UTC](https://discourse.paraview.org/t/simple-exporting-point-data-over-time-to-excel-table/6756/11 "2021-03-22T18:10:00Z")
my bad, it’s called **Plot Selection Over Time**. You can try zipping or tarring the files.
If the are small enough you should be able to attach them here. Otherwise your a google drive or some other service to upload and share the link.
---
### Author:  [@ScientistRenzo](https://discourse.paraview.org/u/ScientistRenzo)
#### Post date: [March 22, 2021, 6:13pm UTC](https://discourse.paraview.org/t/simple-exporting-point-data-over-time-to-excel-table/6756/12 "2021-03-22T18:13:05Z")
> **[tempo.zip](https://drive.google.com/file/d/14Z2H7fGbPFqUXkHY9OUChzn6OPiZjvR6/view?usp=sharing)**
>
> Google Drive file.
It’s 53 seconds I said 10 to make it easier 🙂
---
### Author:  [@utkarsh.ayachit](https://discourse.paraview.org/u/utkarsh.ayachit)
#### Post date: [March 22, 2021, 6:24pm UTC](https://discourse.paraview.org/t/simple-exporting-point-data-over-time-to-excel-table/6756/13 "2021-03-22T18:24:26Z")
Here’s the [state.pvsm](https://discourse.paraview.org/uploads/short-url/idWkim0sfuFFzeiRQGXeMefGaet.pvsm) (267.9 KB)
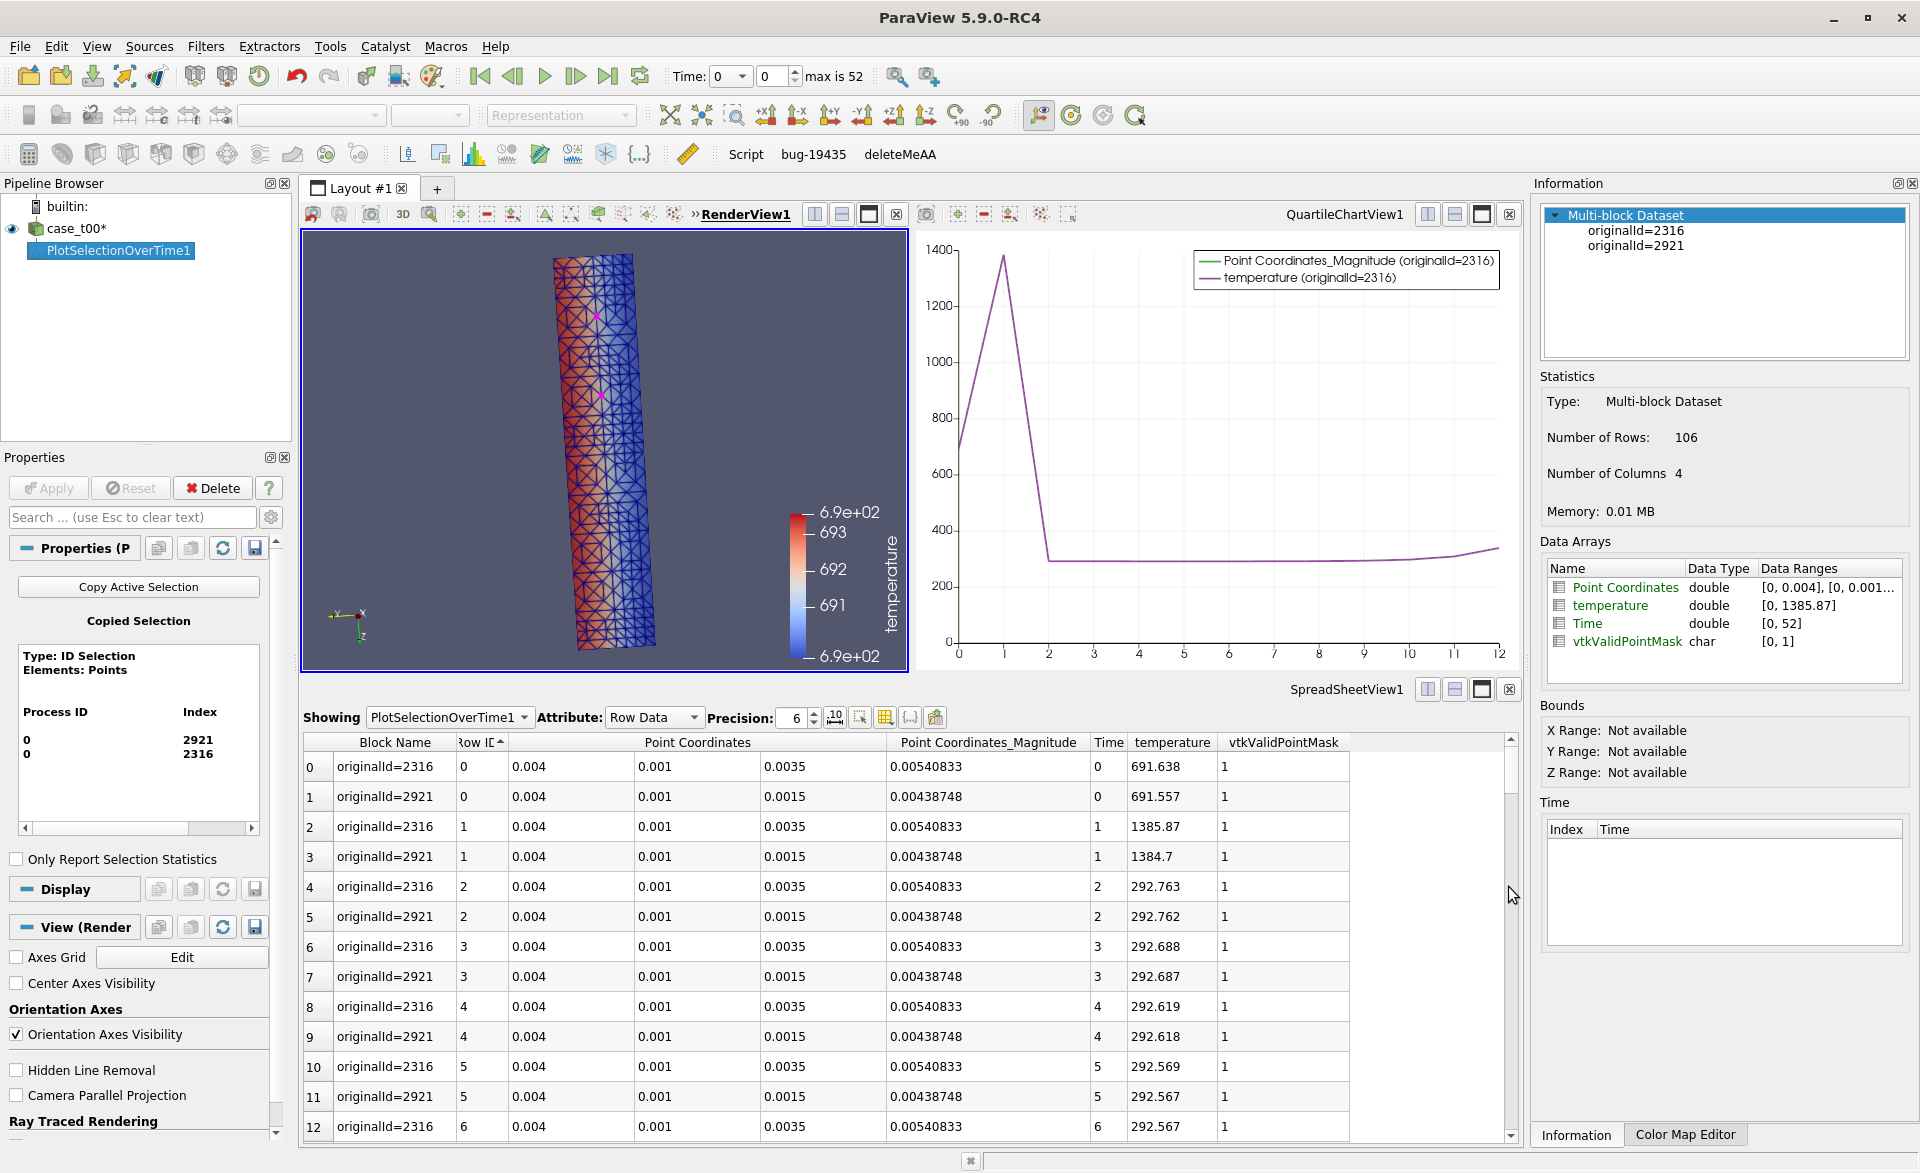
I just selected two random points. You can change the selection and hit **Copy Active Selection** \> **Apply** to update to use your points of interest.
---
### Author:  [@ScientistRenzo](https://discourse.paraview.org/u/ScientistRenzo)
#### Post date: [March 22, 2021, 6:28pm UTC](https://discourse.paraview.org/t/simple-exporting-point-data-over-time-to-excel-table/6756/14 "2021-03-22T18:28:44Z")
How can I change the selection? I’m trying. Thanks!!!
- I chose two points using Interactive Select Points. They became magenta. I cannot find the Copy Active Selection button. Also, how did you make this grid appear? This is really amazing.
---
### Author:  [@utkarsh.ayachit](https://discourse.paraview.org/u/utkarsh.ayachit)
#### Post date: [March 22, 2021, 6:47pm UTC](https://discourse.paraview.org/t/simple-exporting-point-data-over-time-to-excel-table/6756/15 "2021-03-22T18:47:31Z")
> I chose two points using Interactive Select Points. They became magenta.
Next, make the **Plot Selection Over Time** filter active in the Pipeline browser by clicking on it. That will show you the properties for this filter in the **Properties** panel. That’s where you’ll find the **Copy Active Selection** button. Don;t forget to hit **Apply**.
> Also, how did you make this grid appear?
If you’re referring to the 2D plot, it’s generated automatically when you create a new **Plot …** filter.
---
### Author:  [@ScientistRenzo](https://discourse.paraview.org/u/ScientistRenzo)
#### Post date: [March 22, 2021, 6:50pm UTC](https://discourse.paraview.org/t/simple-exporting-point-data-over-time-to-excel-table/6756/16 "2021-03-22T18:50:27Z")
You’re a beast, dude! 😊
---
### Author:  [@ScientistRenzo](https://discourse.paraview.org/u/ScientistRenzo)
#### Post date: [March 28, 2021, 10:35pm UTC](https://discourse.paraview.org/t/simple-exporting-point-data-over-time-to-excel-table/6756/17 "2021-03-28T22:35:58Z")
I was referring to the blue grid on the model! Also, I am trying to open up your state file with my new model and Paraview crashes. Can you solve this with me?
---
### Author:  [@utkarsh.ayachit](https://discourse.paraview.org/u/utkarsh.ayachit)
#### Post date: [March 29, 2021, 12:07pm UTC](https://discourse.paraview.org/t/simple-exporting-point-data-over-time-to-excel-table/6756/18 "2021-03-29T12:07:39Z")
> I was referring to the blue grid on the model
The model can’t be be saved as CSV. You can maybe save the point coorindates for the same. Instead of using **Plot Selection Over Time** use **Plot Data Over Time**.
> Also, I am trying to open up your state file with my new model and Paraview crashes.
Sorry no clue. Dont use the state, follow the actions I mentioned and then see what happens.
---
### Author:  [@Mohiii](https://discourse.paraview.org/u/Mohiii)
#### Post date: [June 3, 2022, 6:40pm UTC](https://discourse.paraview.org/t/simple-exporting-point-data-over-time-to-excel-table/6756/19 "2022-06-03T18:40:57Z")
Hi @utkarsh.ayachit,
I used the procedure you suggested for extracting data of the field over time. However, the Paraview crashes when I apply the "Plot Selection over Time " filter on the entire domain, I can see the error with this format: “( 93.766s) [paraview] vtkDataArray.cxx:523 ERR| vtkIdTypeArray (0x1e873820): Type mismatch: Source: float Dest: idtype” and after a while the paraview shuts down. I wonder what the problem is?
Also, I appreciate it if you can guide me how to write the value of a specific field over time on cell centers instead of the points?
Thanks,
Mohsen