# Sparse CSV - Delaunay3D filter Single to Multi threaded
**URL:** https://discourse.paraview.org/t/sparse-csv-delaunay3d-filter-single-to-multi-threaded/16061
**Category:** ParaView Support
**Tags:** vtk
**Created:** [January 27, 2025, 3:25pm UTC](https://discourse.paraview.org/t/sparse-csv-delaunay3d-filter-single-to-multi-threaded/16061 "2025-01-27T15:25:53Z")
**Posts on this page:** 9
**Page:** 1
### Author:  [@ParticleTruthSeeker](https://discourse.paraview.org/u/ParticleTruthSeeker)
#### Post date: [January 27, 2025, 3:25pm UTC](https://discourse.paraview.org/t/sparse-csv-delaunay3d-filter-single-to-multi-threaded/16061/1 "2025-01-27T15:25:53Z")
I happen to be using this filter alot and it seems to be single threaded. Is there a way to recompile paraview and utilise multithreading for this?
I am also in need to use this filter with a sparse csv which I would like to pad with 0 in order to be able to use this filter which otherwise simply fails. Is there a good way to do this?
Many thanks
---
### Author:  [@cory.quammen](https://discourse.paraview.org/u/cory.quammen)
#### Post date: [January 27, 2025, 4:21pm UTC](https://discourse.paraview.org/t/sparse-csv-delaunay3d-filter-single-to-multi-threaded/16061/2 "2025-01-27T16:21:54Z")
> [@ParticleTruthSeeker](#):
>
> I happen to be using this filter alot and it seems to be single threaded. Is there a way to recompile paraview and utilise multithreading for this?
AFAIK, the Delaunay3D filter has no multithreading capability at all.
---
### Author:  [@ParticleTruthSeeker](https://discourse.paraview.org/u/ParticleTruthSeeker)
#### Post date: [January 27, 2025, 4:39pm UTC](https://discourse.paraview.org/t/sparse-csv-delaunay3d-filter-single-to-multi-threaded/16061/3 "2025-01-27T16:39:20Z")
Thank you for the reply.
Do you also have a recommendation for the second part of my question. It would help alot. here is some sample data.
[inox.csv](https://discourse.paraview.org/uploads/short-url/37GcY3JdJGB7ZFc5mh1lsRMHwEe.csv) (188.8 KB)
I use table to points and visualise succesfully. I plot a histogram fine as well. But I would like to create a heatmap similar to the delaunay3d filter but due to the low number of points it doesn’t work.
Do you have a reccomendation to plot this data? Can you superimpose it as a heatmap on a second volume?
Many thanks
---
### Author:  [@cory.quammen](https://discourse.paraview.org/u/cory.quammen)
#### Post date: [January 27, 2025, 4:47pm UTC](https://discourse.paraview.org/t/sparse-csv-delaunay3d-filter-single-to-multi-threaded/16061/4 "2025-01-27T16:47:55Z")
I’m not sure exactly what you are looking for. But you can map these columns to 3D points and apply **Delaunay3D** just fine. Please see the attached state file created with ParaView 5.13.0.
[inox.pvsm](https://discourse.paraview.org/uploads/short-url/kecNzVndyLMdWECE99o0DtUFuQF.pvsm) (318.4 KB)
---
### Author:  [@ParticleTruthSeeker](https://discourse.paraview.org/u/ParticleTruthSeeker)
#### Post date: [January 27, 2025, 4:54pm UTC](https://discourse.paraview.org/t/sparse-csv-delaunay3d-filter-single-to-multi-threaded/16061/5 "2025-01-27T16:54:26Z")
Sorry I am new to this and I am having a few issues.
So I am trying to load the state
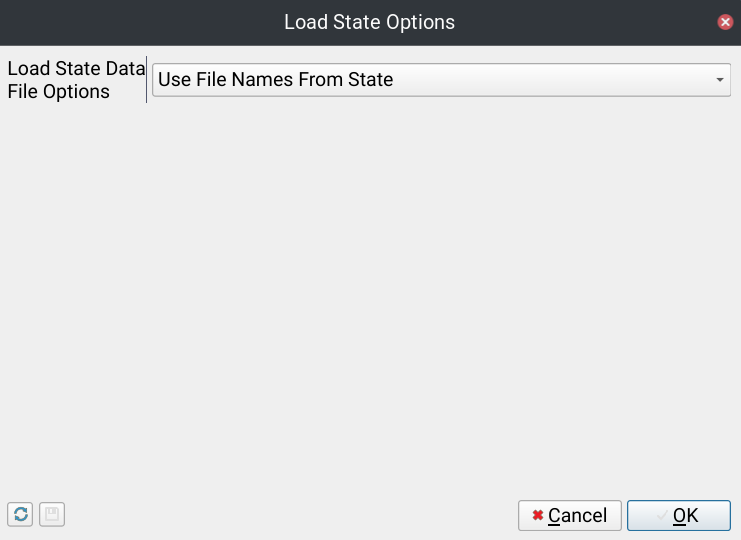
and i get this error message
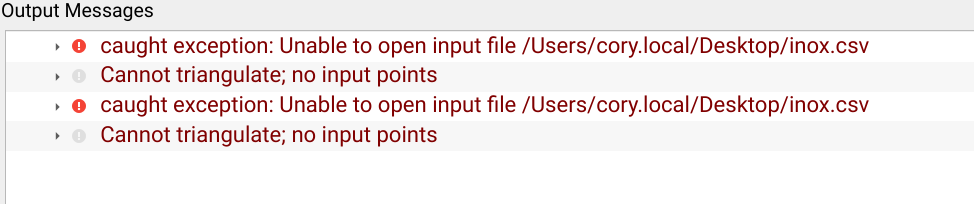
What am I doing wrong?
Ok I pointed it to the file directory and I am getting this
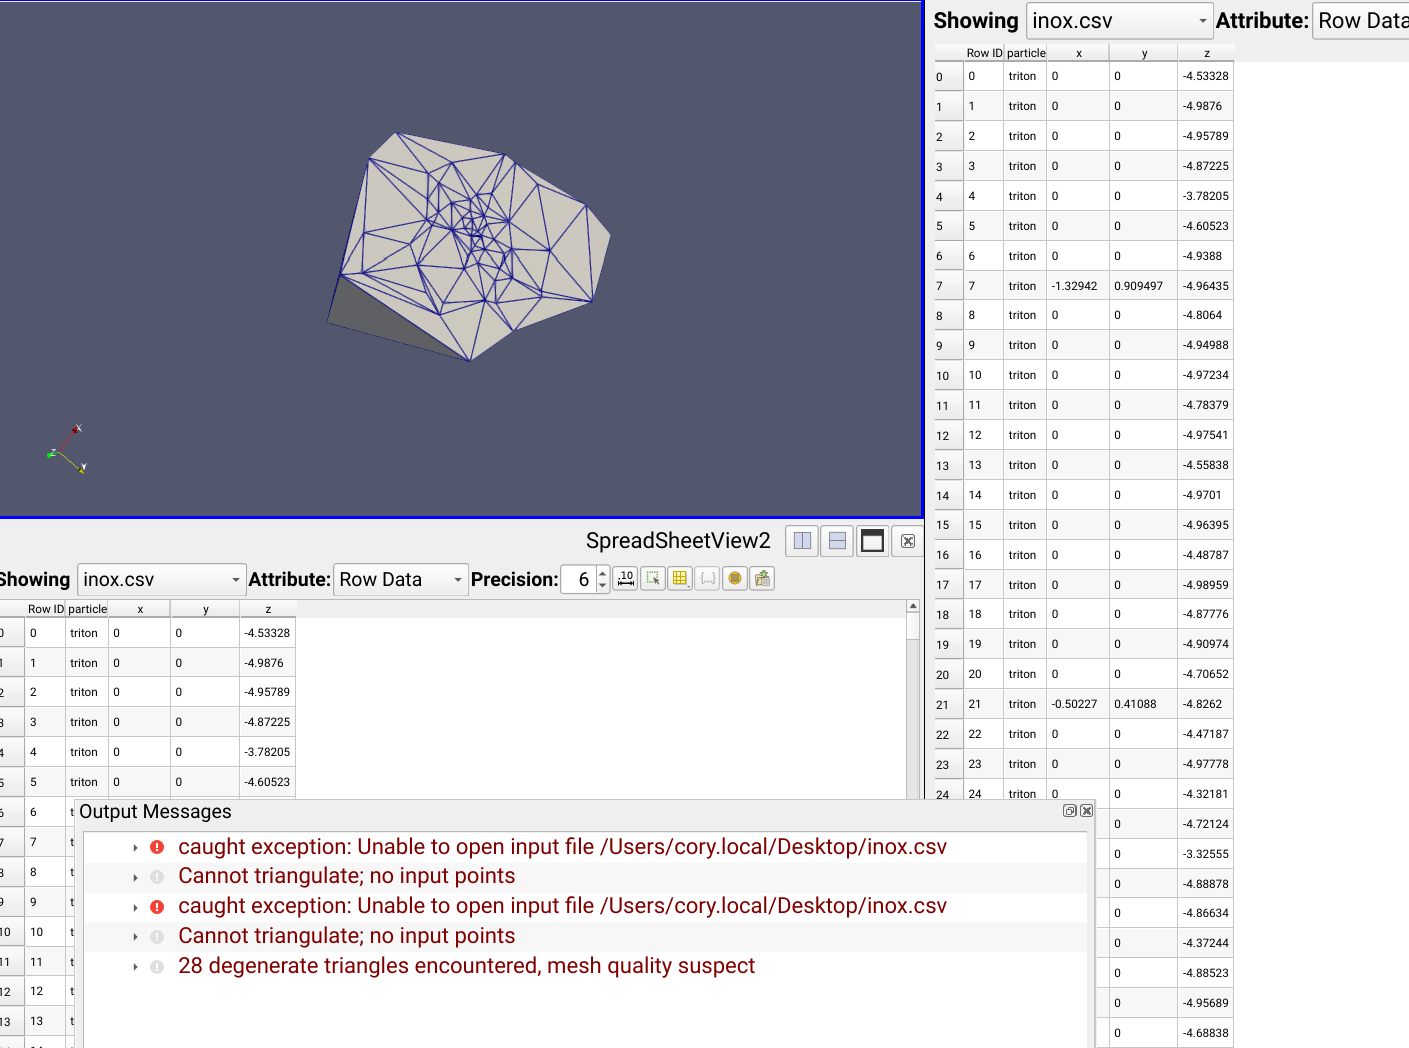
Apart from the mesh quality warning this isnt exactly what I want. I would like to get those coordinates resampled as a population in a wider space and then plot the delauney3d heat map from that.
---
### Author:  [@cory.quammen](https://discourse.paraview.org/u/cory.quammen)
#### Post date: [January 27, 2025, 5:33pm UTC](https://discourse.paraview.org/t/sparse-csv-delaunay3d-filter-single-to-multi-threaded/16061/6 "2025-01-27T17:33:05Z")
> [@ParticleTruthSeeker](#):
>
> I would like to get those coordinates resampled as a population in a wider space and then plot the delauney3d heat map from that.
I’m afraid I don’t understand the request. Could you post something that looks like the heat map you are looking for?
---
### Author:  [@ParticleTruthSeeker](https://discourse.paraview.org/u/ParticleTruthSeeker)
#### Post date: [January 27, 2025, 6:18pm UTC](https://discourse.paraview.org/t/sparse-csv-delaunay3d-filter-single-to-multi-threaded/16061/7 "2025-01-27T18:18:13Z")
I have shared this previously but this is one example of a structured grid heat map.
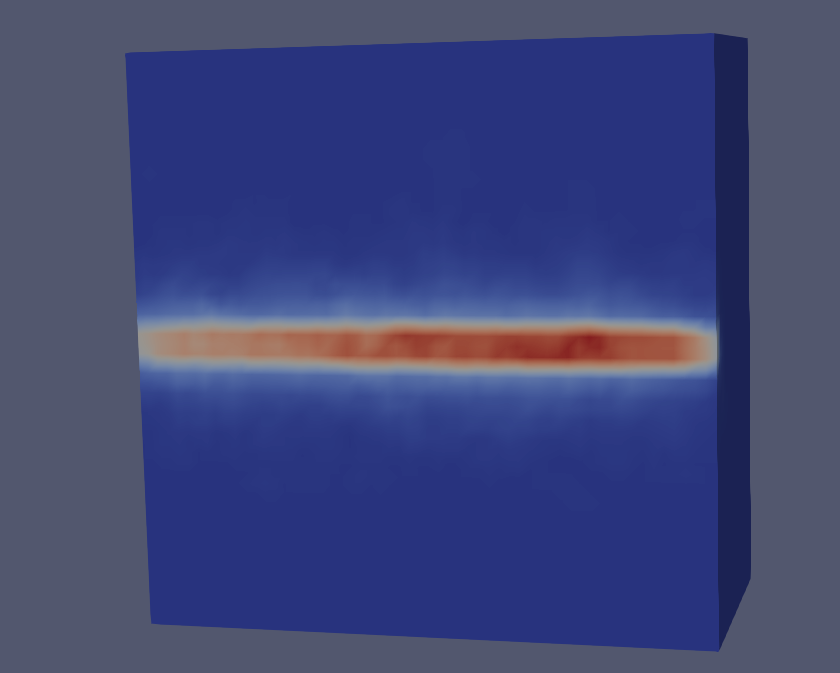
from this array which consists of binned values across the range.

and I would like to do something similar with this data here:
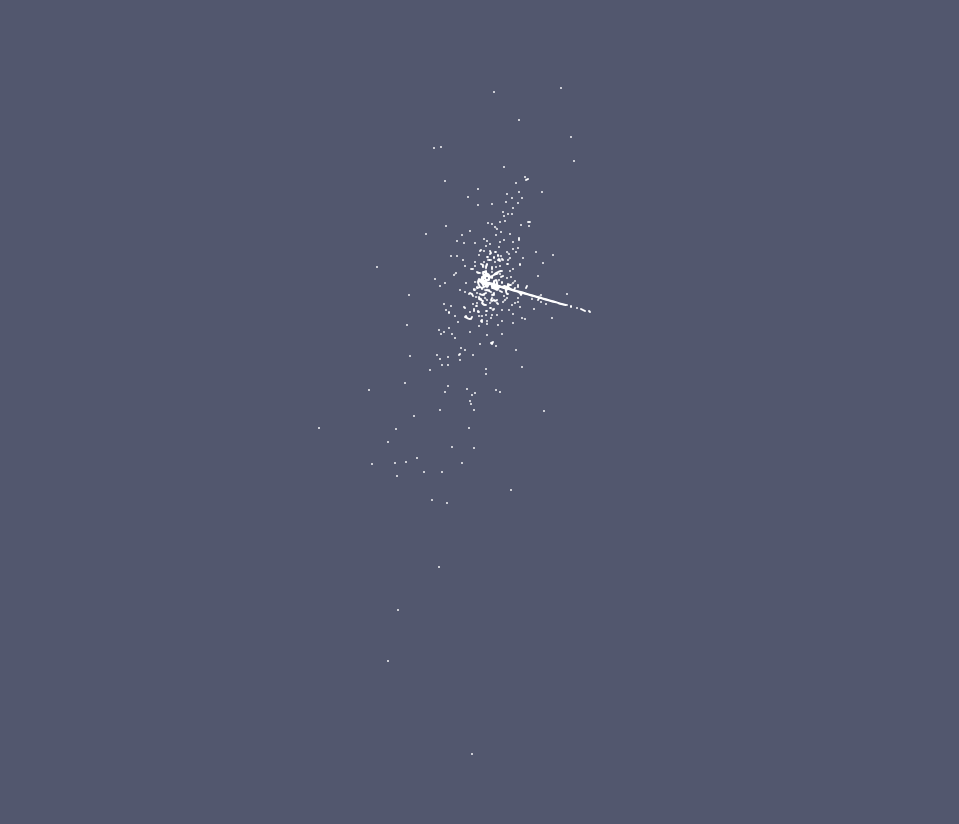
which are coordinates of events im interested and somehow generate a similar heatmap as above. perhaps superimposed on to the volume in which this data originates.
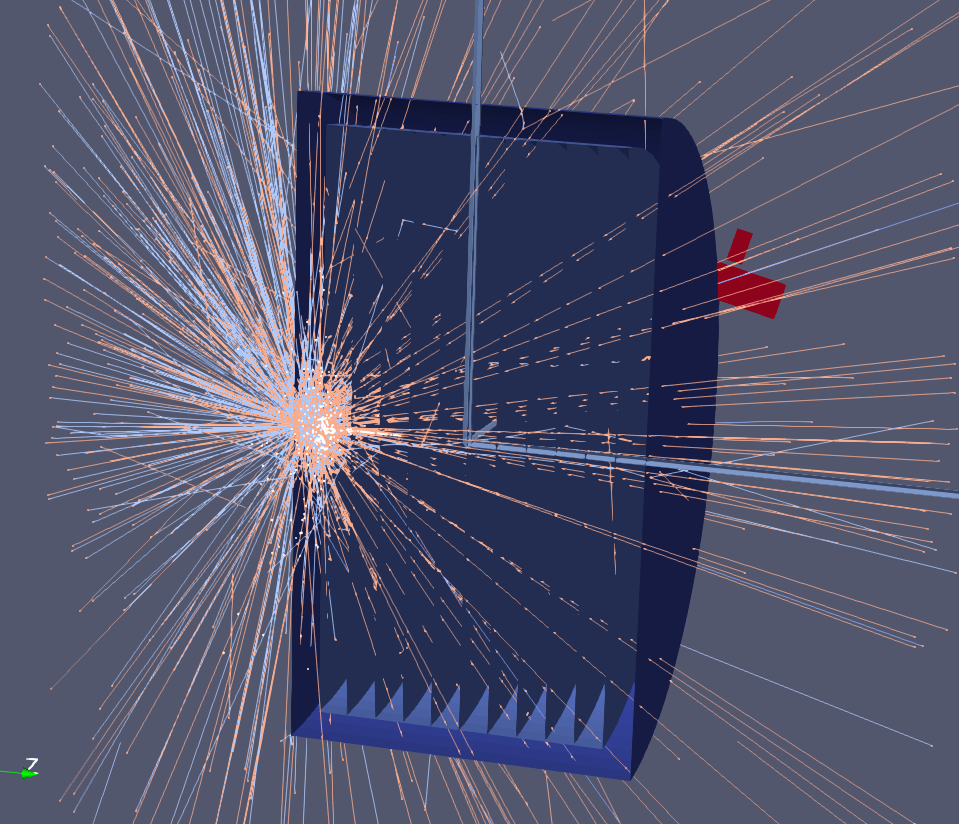
Maybe this is a better image
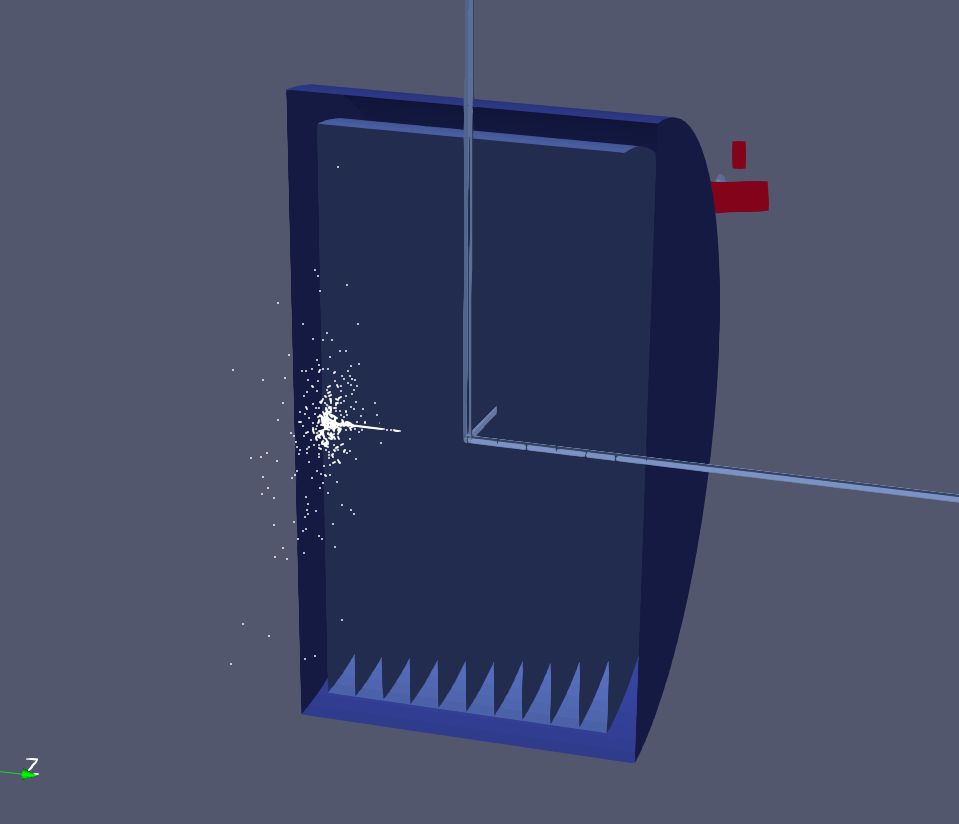
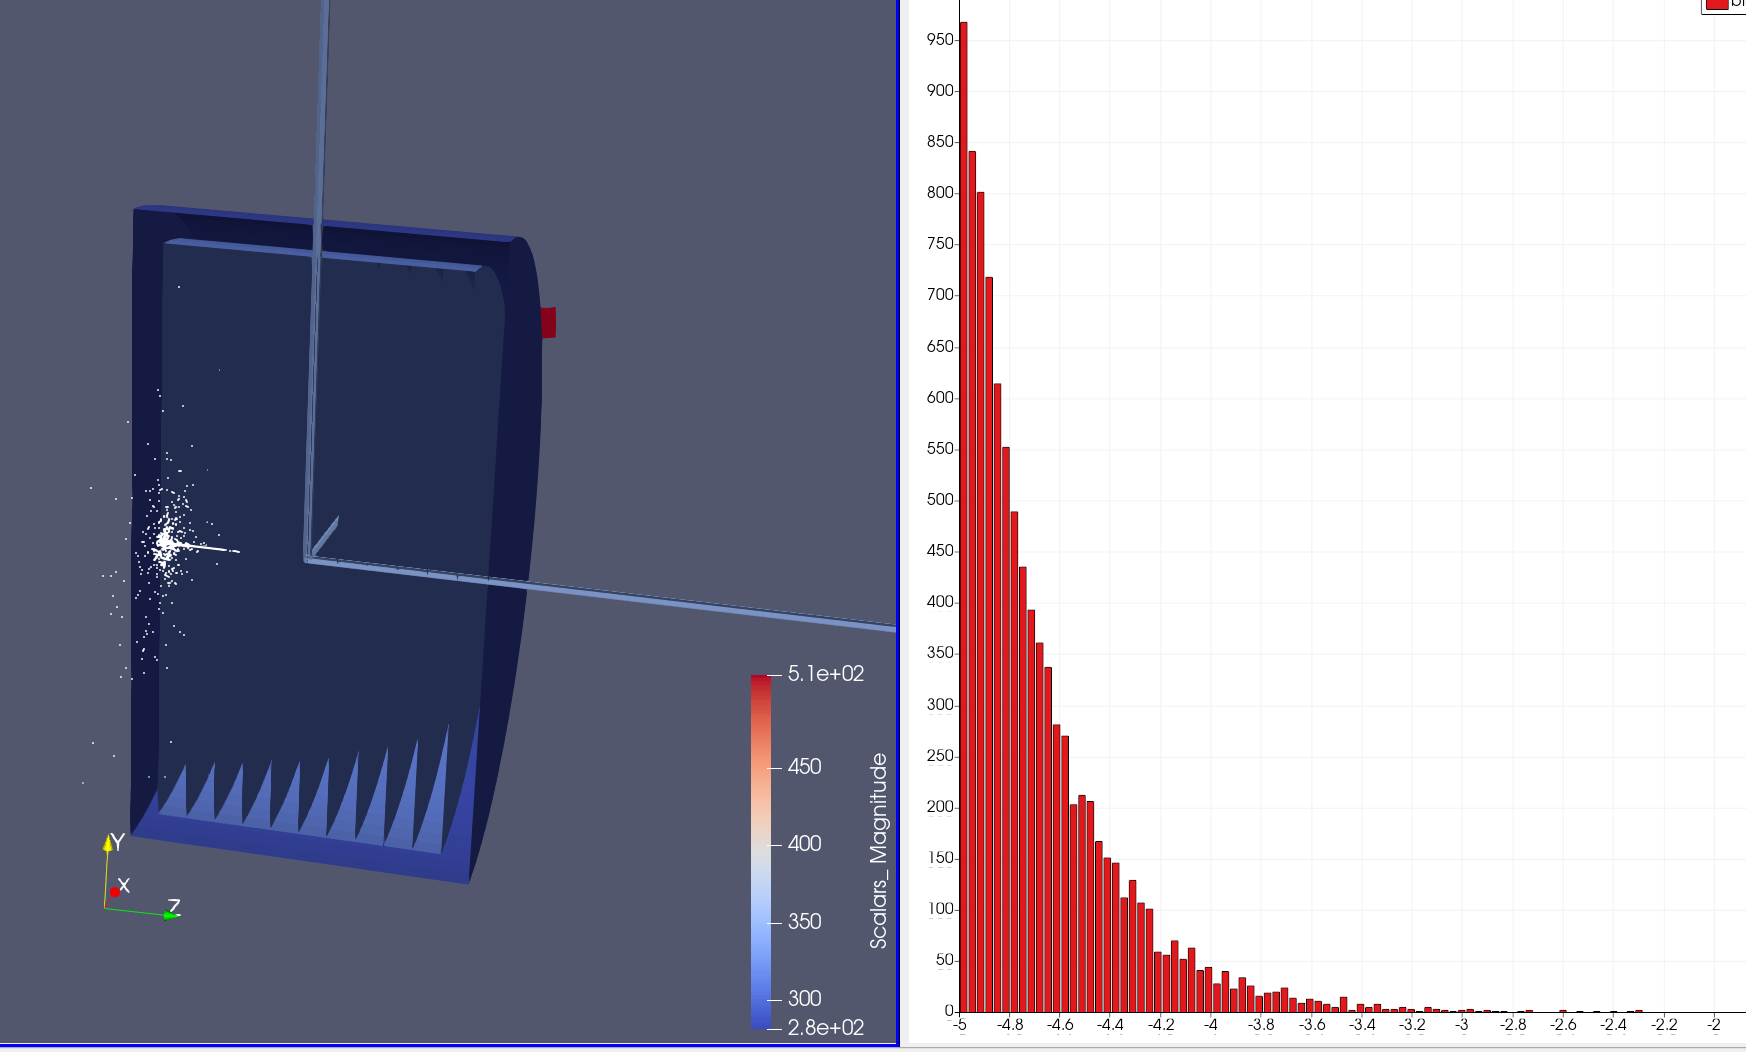
This is the data histogram along one axis. I would like this in 3d over the volume if possible.
---
### Author:  [@cory.quammen](https://discourse.paraview.org/u/cory.quammen)
#### Post date: [January 30, 2025, 2:55am UTC](https://discourse.paraview.org/t/sparse-csv-delaunay3d-filter-single-to-multi-threaded/16061/8 "2025-01-30T02:55:24Z")
Thank you for clarifying. One option:
**Point Set to Octree Image** produces
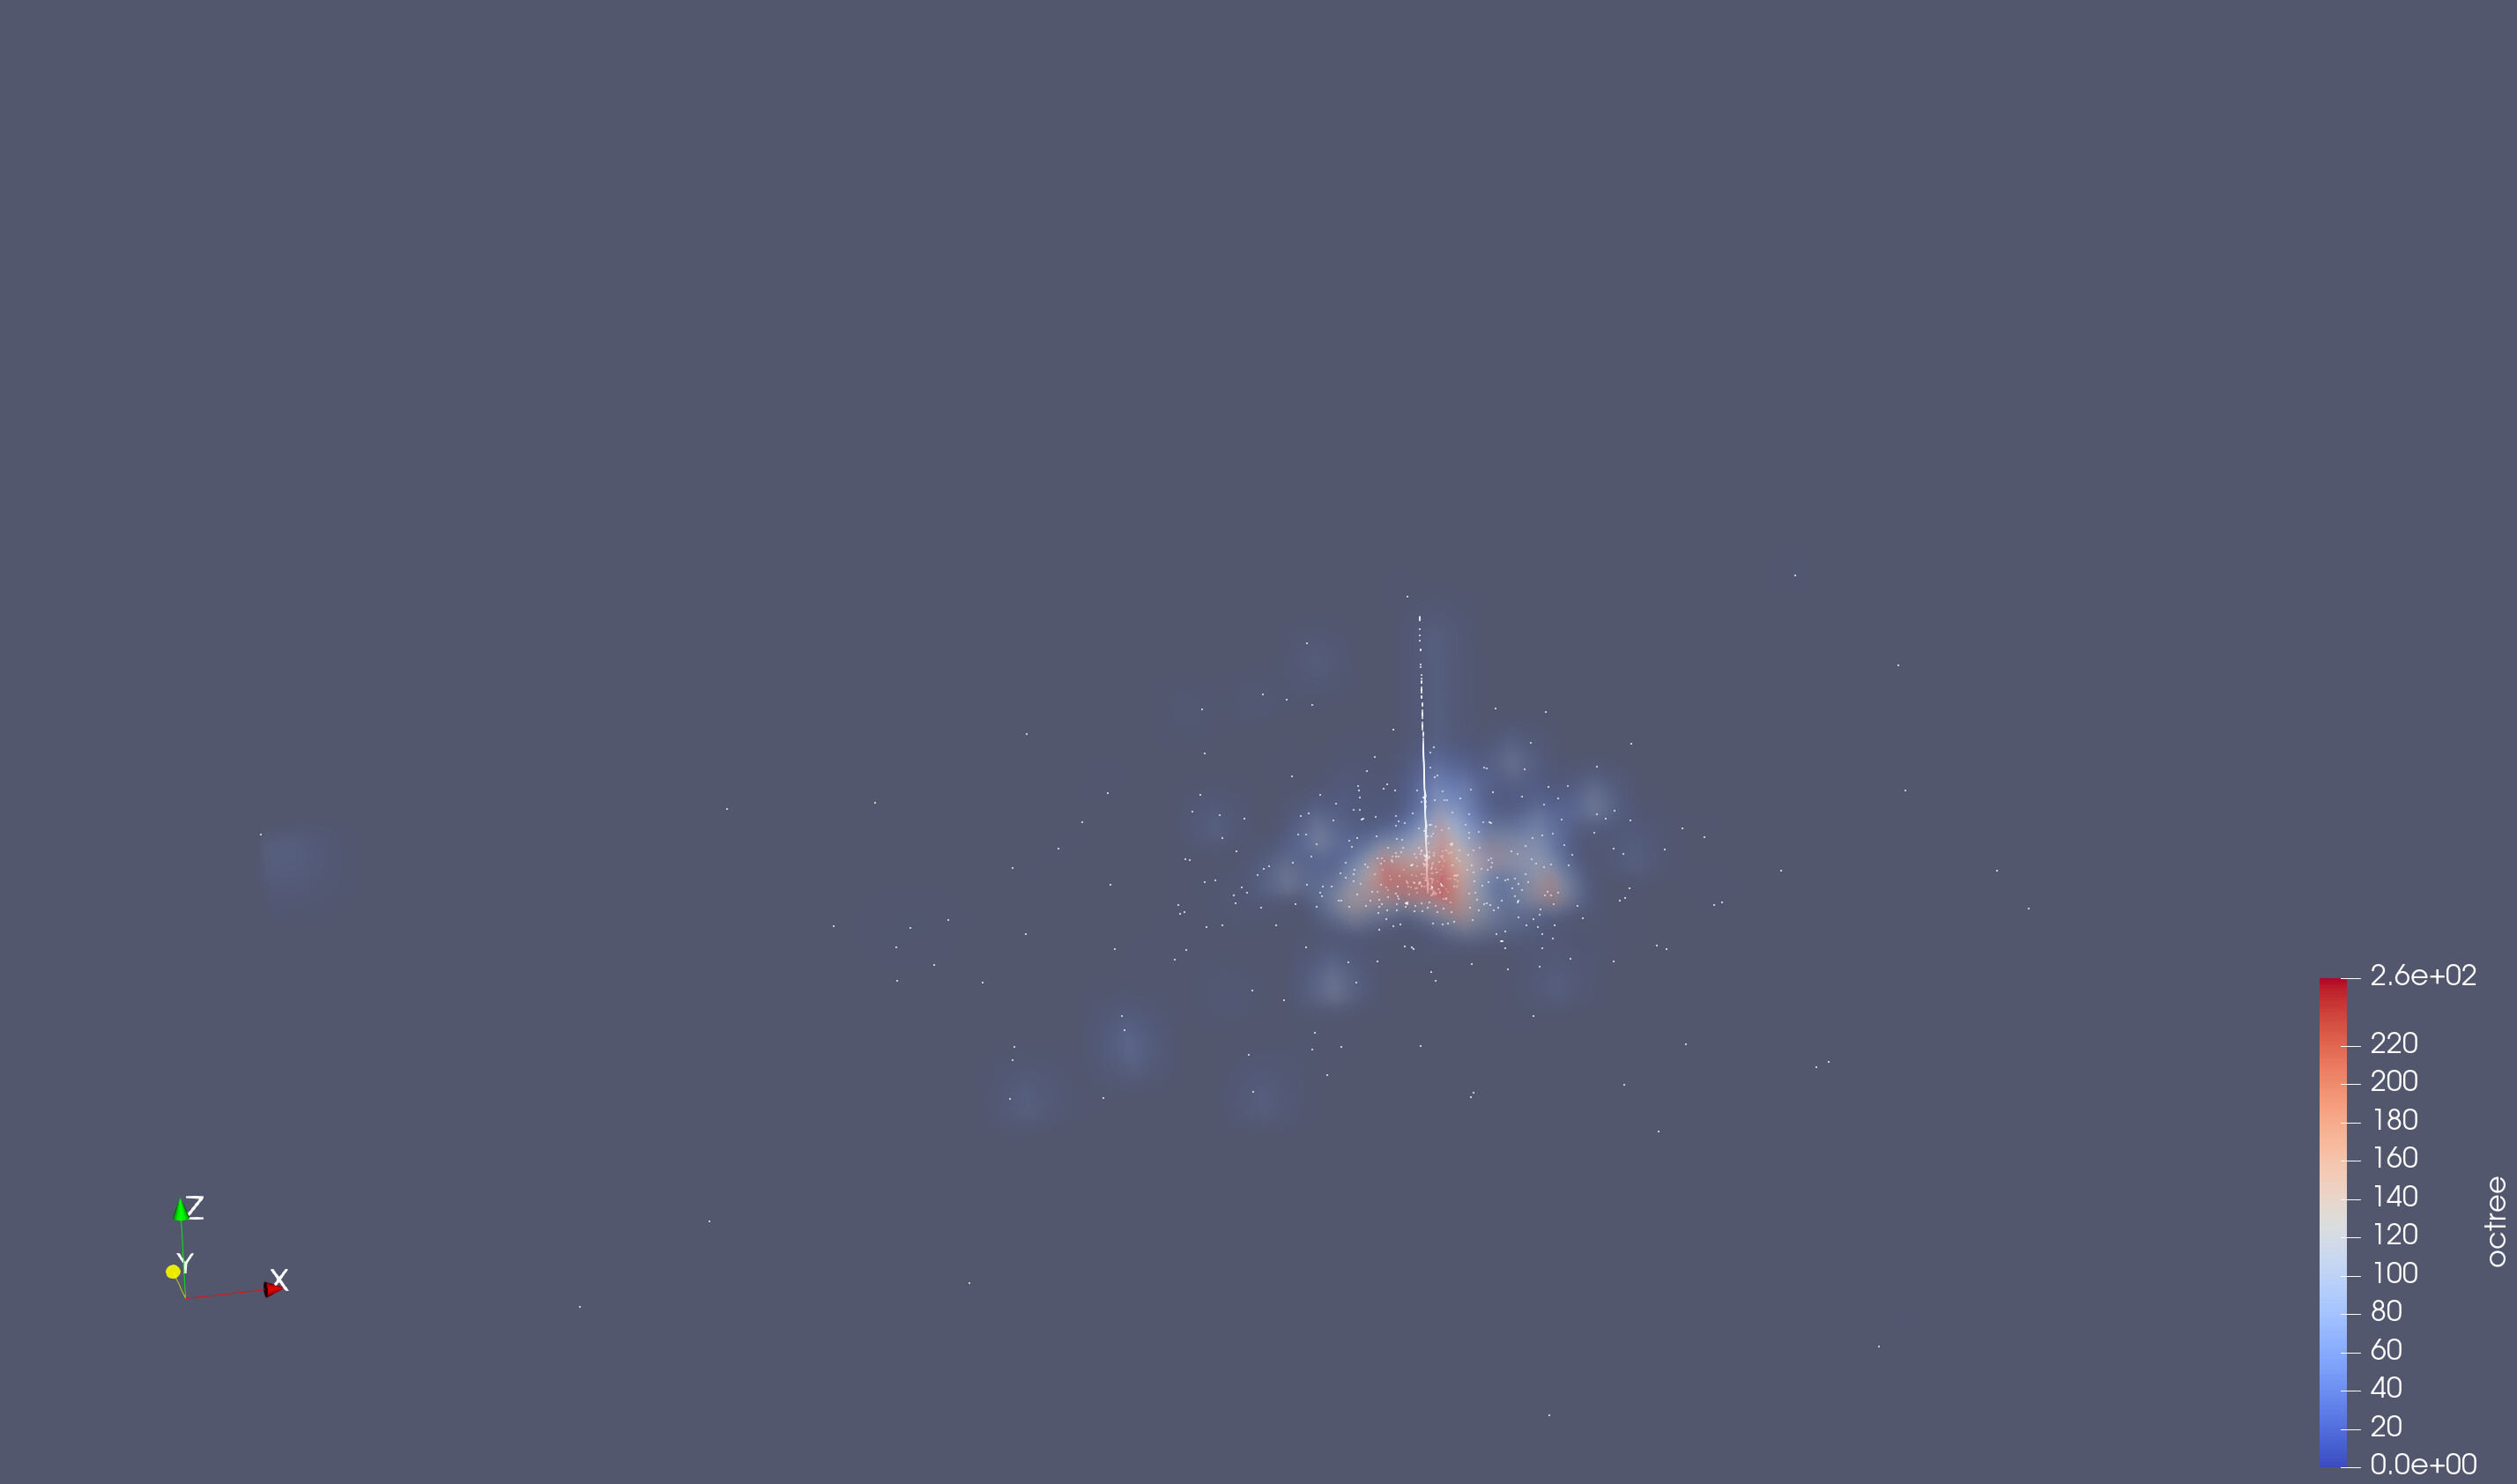
It bins points into an image grid that you can then volume render to show density.
---
### Author:  [@ParticleTruthSeeker](https://discourse.paraview.org/u/ParticleTruthSeeker)
#### Post date: [January 30, 2025, 3:21am UTC](https://discourse.paraview.org/t/sparse-csv-delaunay3d-filter-single-to-multi-threaded/16061/9 "2025-01-30T03:21:09Z")
Cheers. That’s quite nice. Thanks!
Is there perhaps a way to alter the range and size of the bins perhaps correlated to the volume of origin? Would I need to import that as a mesh of some kind?