# Strange lines on the isosurface visualisation
**URL:** https://discourse.paraview.org/t/strange-lines-on-the-isosurface-visualisation/6367
**Category:** ParaView Support
**Created:** [February 2, 2021, 2:04pm UTC](https://discourse.paraview.org/t/strange-lines-on-the-isosurface-visualisation/6367 "2021-02-02T14:04:43Z")
**Posts on this page:** 8
**Page:** 1
### Author:  [@heisenmech](https://discourse.paraview.org/u/heisenmech)
#### Post date: [February 2, 2021, 2:04pm UTC](https://discourse.paraview.org/t/strange-lines-on-the-isosurface-visualisation/6367/1 "2021-02-02T14:04:43Z")
Hi all,
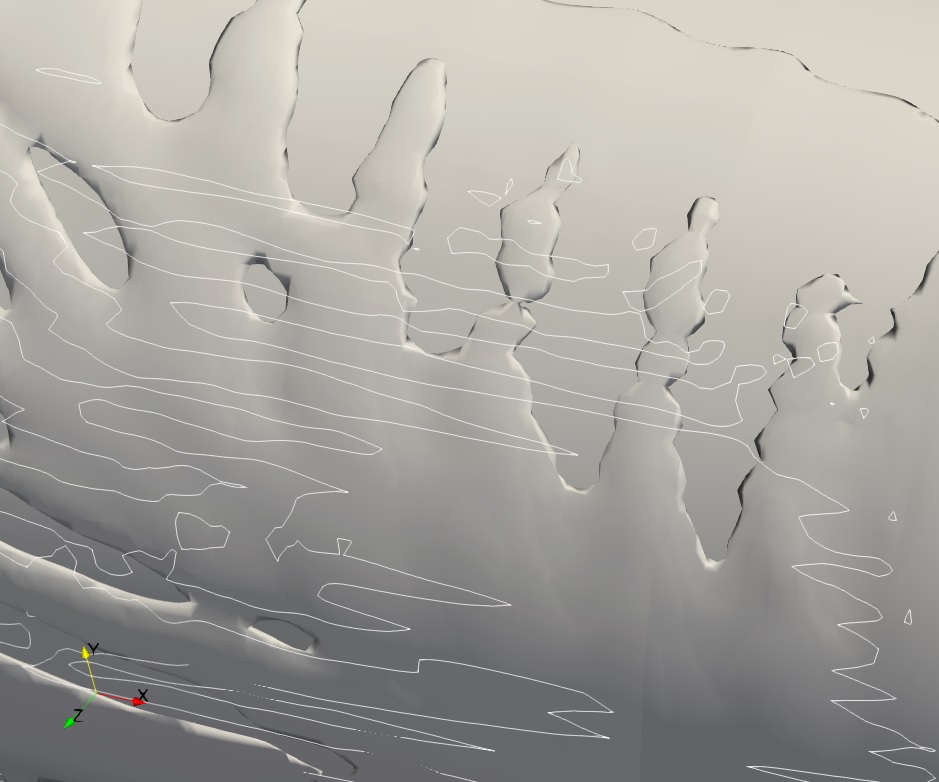
I’m using Paraview for iso-surface visualisations, data of which comes from Fluent. Everything works smoothly apart from some strange white lines on the surface as you can see in the screenshot below. There is no colouring in the figure, so it should be all solid grey.
Anyone has any idea how to get rid of those white patchy lines?
Thanks,
Oguzhan
---
### Author:  [@Kenneth\_Moreland](https://discourse.paraview.org/u/Kenneth_Moreland)
#### Post date: [February 2, 2021, 2:17pm UTC](https://discourse.paraview.org/t/strange-lines-on-the-isosurface-visualisation/6367/2 "2021-02-02T14:17:20Z")
I can’t know for sure without access to your data, but it looks like your original data has both volume data and surface data. (Perhaps you are loading in both the volume and the boundary surface.) Those white lines are a contour that comes out of the surface. (A contour of a volume is a surface. A contour of a surface is a curve.)
---
### Author:  [@heisenmech](https://discourse.paraview.org/u/heisenmech)
#### Post date: [February 2, 2021, 2:23pm UTC](https://discourse.paraview.org/t/strange-lines-on-the-isosurface-visualisation/6367/3 "2021-02-02T14:23:00Z")
Hi Kenneth,
Thanks for the prompt reply! Whenever I export data from Fluent to Paraview, I actually don’t select any volume or boundary(surface) in Fluent. Btw, I export in ensight format if you think it may be the issue.
---
### Author:  [@Kenneth\_Moreland](https://discourse.paraview.org/u/Kenneth_Moreland)
#### Post date: [February 2, 2021, 9:44pm UTC](https://discourse.paraview.org/t/strange-lines-on-the-isosurface-visualisation/6367/4 "2021-02-02T21:44:57Z")
I’m not familiar with Fluent or it’s data, so I don’t know if there is an easy way to avoid loading surface data.
An easy way to remove them from the result of `Contour` is to run it through the `Vertex Count` filter and then use the `Threshold` filter to remove any cell with a `Vertex Count` of less than 3 (which would make it either a line or a point).
---
### Author:  [@heisenmech](https://discourse.paraview.org/u/heisenmech)
#### Post date: [February 3, 2021, 9:40am UTC](https://discourse.paraview.org/t/strange-lines-on-the-isosurface-visualisation/6367/5 "2021-02-03T09:40:10Z")
Tried applying Count Cell Vertices filter and then Threshold but did not work, unfortunately.
---
### Author:  [@Kenneth\_Moreland](https://discourse.paraview.org/u/Kenneth_Moreland)
#### Post date: [February 3, 2021, 2:57pm UTC](https://discourse.paraview.org/t/strange-lines-on-the-isosurface-visualisation/6367/6 "2021-02-03T14:57:47Z")
You applied `Count Cell Vertices` to the output of `Contour`, not your original data, right?
Is there a way to post your data? I can’t help further without seeing an example.
---
### Author:  [@heisenmech](https://discourse.paraview.org/u/heisenmech)
#### Post date: [February 3, 2021, 3:21pm UTC](https://discourse.paraview.org/t/strange-lines-on-the-isosurface-visualisation/6367/7 "2021-02-03T15:21:09Z")
I’ve sent you a message. Please check your inbox.
Thanks,
Oguzhan
---
### Author:  [@Kenneth\_Moreland](https://discourse.paraview.org/u/Kenneth_Moreland)
#### Post date: [February 4, 2021, 12:46am UTC](https://discourse.paraview.org/t/strange-lines-on-the-isosurface-visualisation/6367/8 "2021-02-04T00:46:43Z")
When I applied the technique I suggested (`Contour` -\> `Count Cell Vertices` -\> `Threshold` strictly above 2) worked for me.
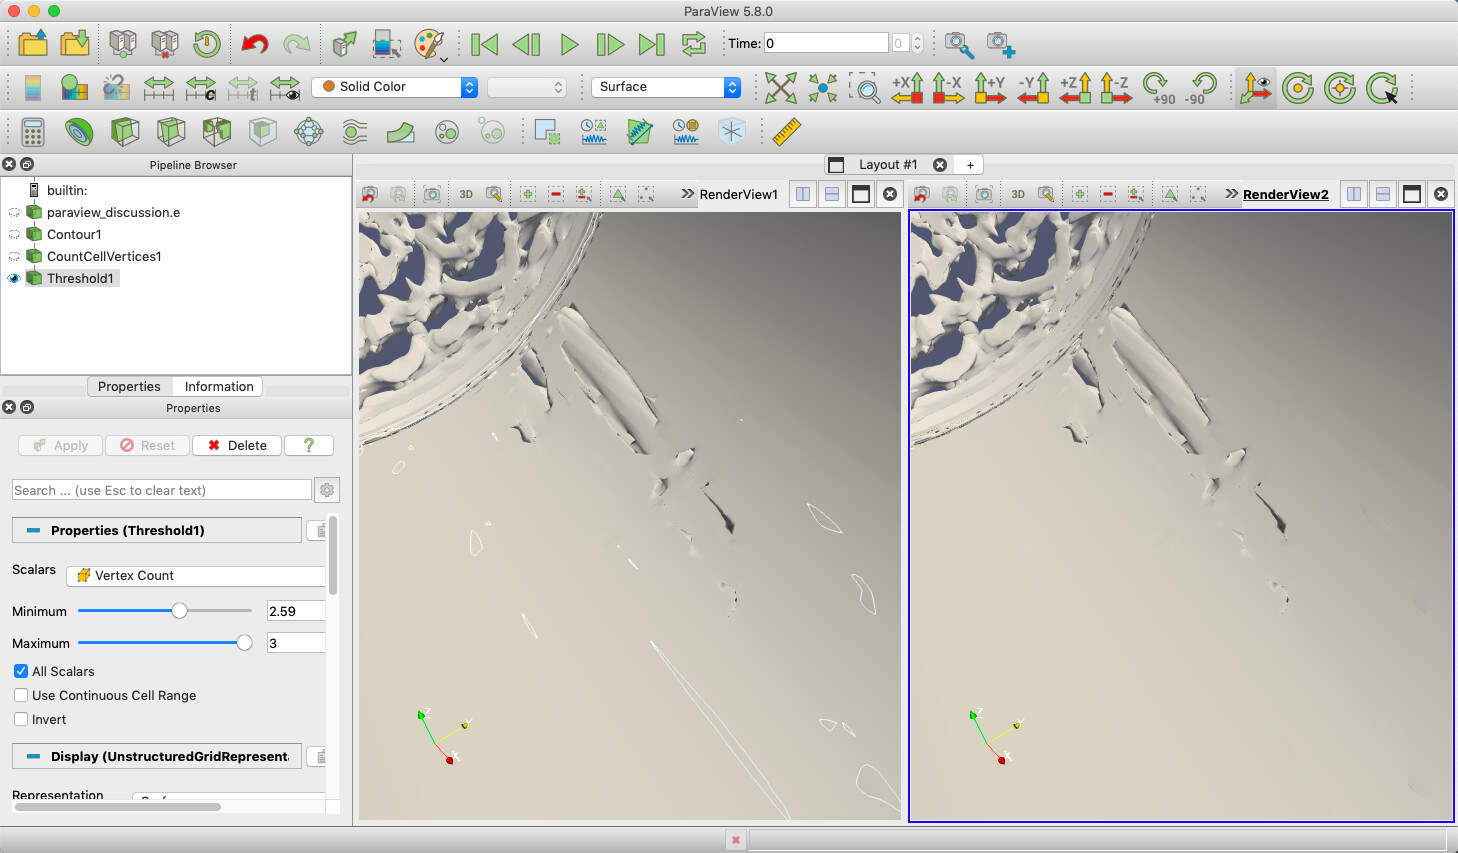
Here is a state file of how I did this: [no-contour-lines.pvsm](https://discourse.paraview.org/uploads/short-url/tKYvVPYFdlP12OgGWax0PJZVsbi.pvsm) (672.3 KB)