# Streamlines - Isolines is not working with 2D ascii
**URL:** https://discourse.paraview.org/t/streamlines-isolines-is-not-working-with-2d-ascii/15611
**Category:** ParaView Support
**Created:** [October 22, 2024, 8:52pm UTC](https://discourse.paraview.org/t/streamlines-isolines-is-not-working-with-2d-ascii/15611 "2024-10-22T20:52:08Z")
**Posts on this page:** 4
**Page:** 1
### Author:  [@ndariaso](https://discourse.paraview.org/u/ndariaso)
#### Post date: [October 22, 2024, 8:52pm UTC](https://discourse.paraview.org/t/streamlines-isolines-is-not-working-with-2d-ascii/15611/1 "2024-10-22T20:52:08Z")
Hi Everyone, I am facing a problem that I couldn’t solve by myself or any support around internet.
I have tried to draw isolines over a vector field but I cannot do it. I explain my process, I am missing something, but I cannot figure it out.
I have an output -ASCII- 4 column file. x, y, vx, vy, which represents the position and the x and y components of a vector field (Magnetically Induced Current Density \*.vector) obtained with DIRAC code.
[01.vector](https://discourse.paraview.org/uploads/short-url/lNEkqA7SVUvBf8bp3B2nxb1wjW4.vector) (886.6 KB)
I am doing the following (1st way):
1. I load the file using CSV reader indicating that the space delimiter is a blank space as well as no header. x, y, vx, vy, is loaded as field 0, 1, 2, and 3, respectively,
2. I transform with Table to Points the field 0 and 1 as x and y column indicating that these are only 2D points.
3. I use calculator to compute the magnitud of the vectors sqrt(vx^2+vy^2)
4. I generate “isolines” adding a range of values between 0 and 1.46 (according to my value range), linearly with 10 samples.
Once y click on “Apply”, the spreadsheet becomes blank and nothing appears in render view.
**I Tried a different way:**
1. I use calculator to compute the vector field as ihat_ux + jhat_uy
2. I use the Glyph representation orienting and scaling by my magnetic field (equation in 3rd step)
3. I Integrate the stream lines with the options by default but there are no isolines.
I don’t know if I am missing some steps.
I appreciate any help that you could provide. **Thank you so much.**
PS.
I also tried from the calculator filter by evenly spaced streamlines 2D
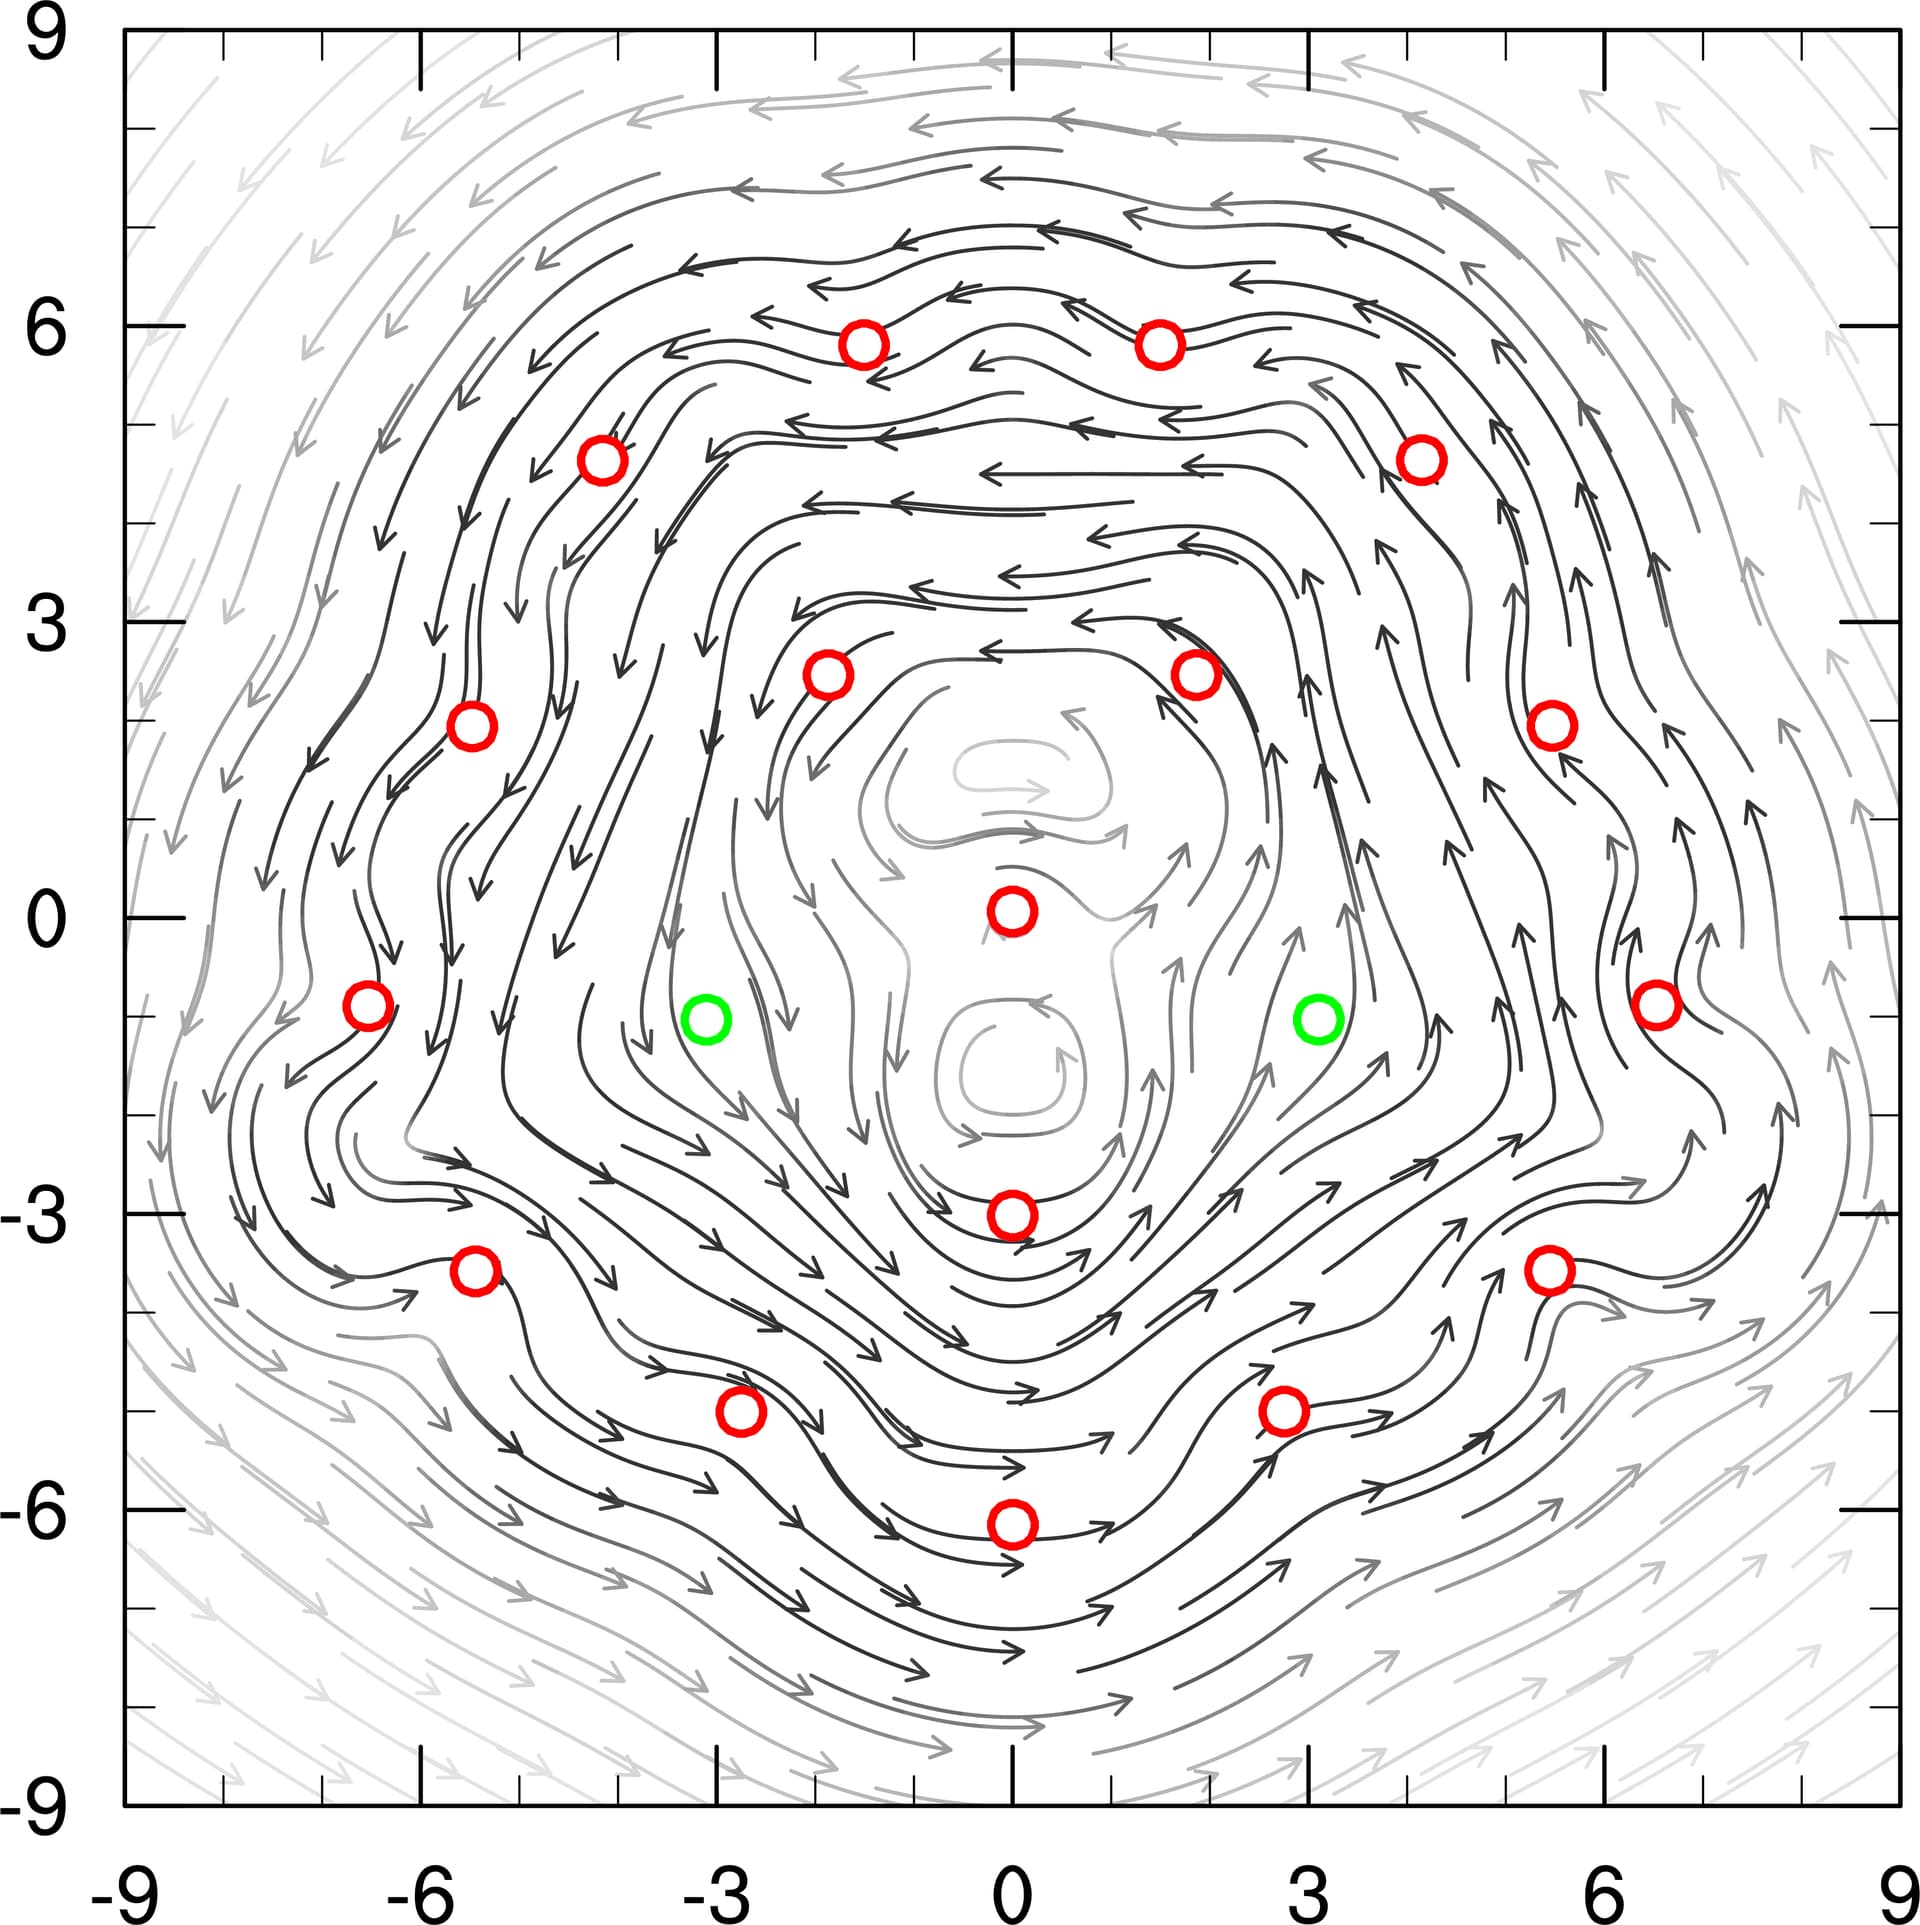
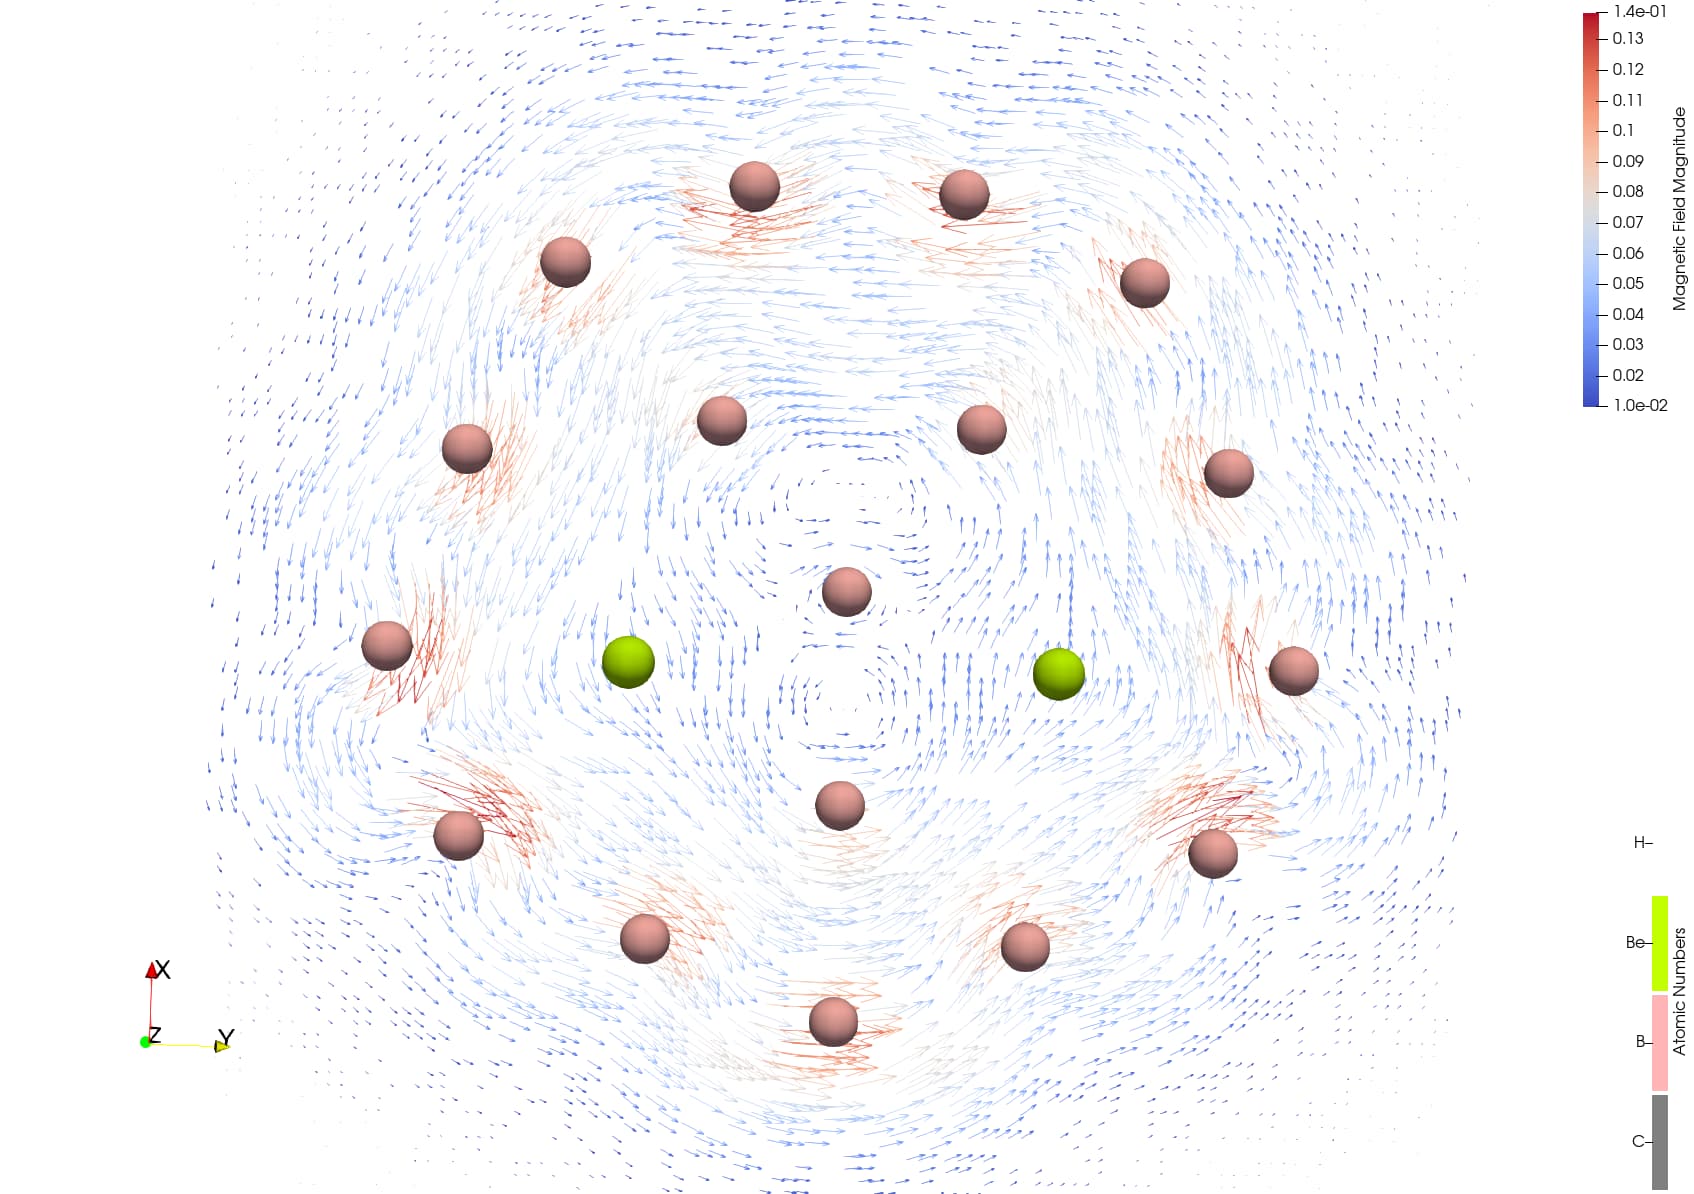
I am attacing the paraview images (with glyph but no isolines) as well as a plot done using a PynGl code that I have. My objective is to extend it to a 3D plot, but I am still facing the same problem.
---
### Author:  [@mwestphal](https://discourse.paraview.org/u/mwestphal)
#### Post date: [October 23, 2024, 7:59am UTC](https://discourse.paraview.org/t/streamlines-isolines-is-not-working-with-2d-ascii/15611/2 "2024-10-23T07:59:21Z")
> I generate “isolines” adding a range of values between 0 and 1.46 (according to my value range), linearly with 10 samples.
There is no “isolines” filter, which filter are you using for that step ?
---
### Author:  [@ndariaso](https://discourse.paraview.org/u/ndariaso)
#### Post date: [October 23, 2024, 11:21am UTC](https://discourse.paraview.org/t/streamlines-isolines-is-not-working-with-2d-ascii/15611/3 "2024-10-23T11:21:29Z")
> [@ndariaso](#):
>
> 1. I generate “isolines” adding a range of values between 0 and 1.46 (according to my value range), linearly with 10 samples.
There is an icon that says: generate isolines or isosurface (beside calculator). Same icon as the filter “contour”
---
### Author:  [@mwestphal](https://discourse.paraview.org/u/mwestphal)
#### Post date: [October 23, 2024, 12:14pm UTC](https://discourse.paraview.org/t/streamlines-isolines-is-not-working-with-2d-ascii/15611/4 "2024-10-23T12:14:40Z")
Contour will never work with a point cloud, but can work with structured grid:
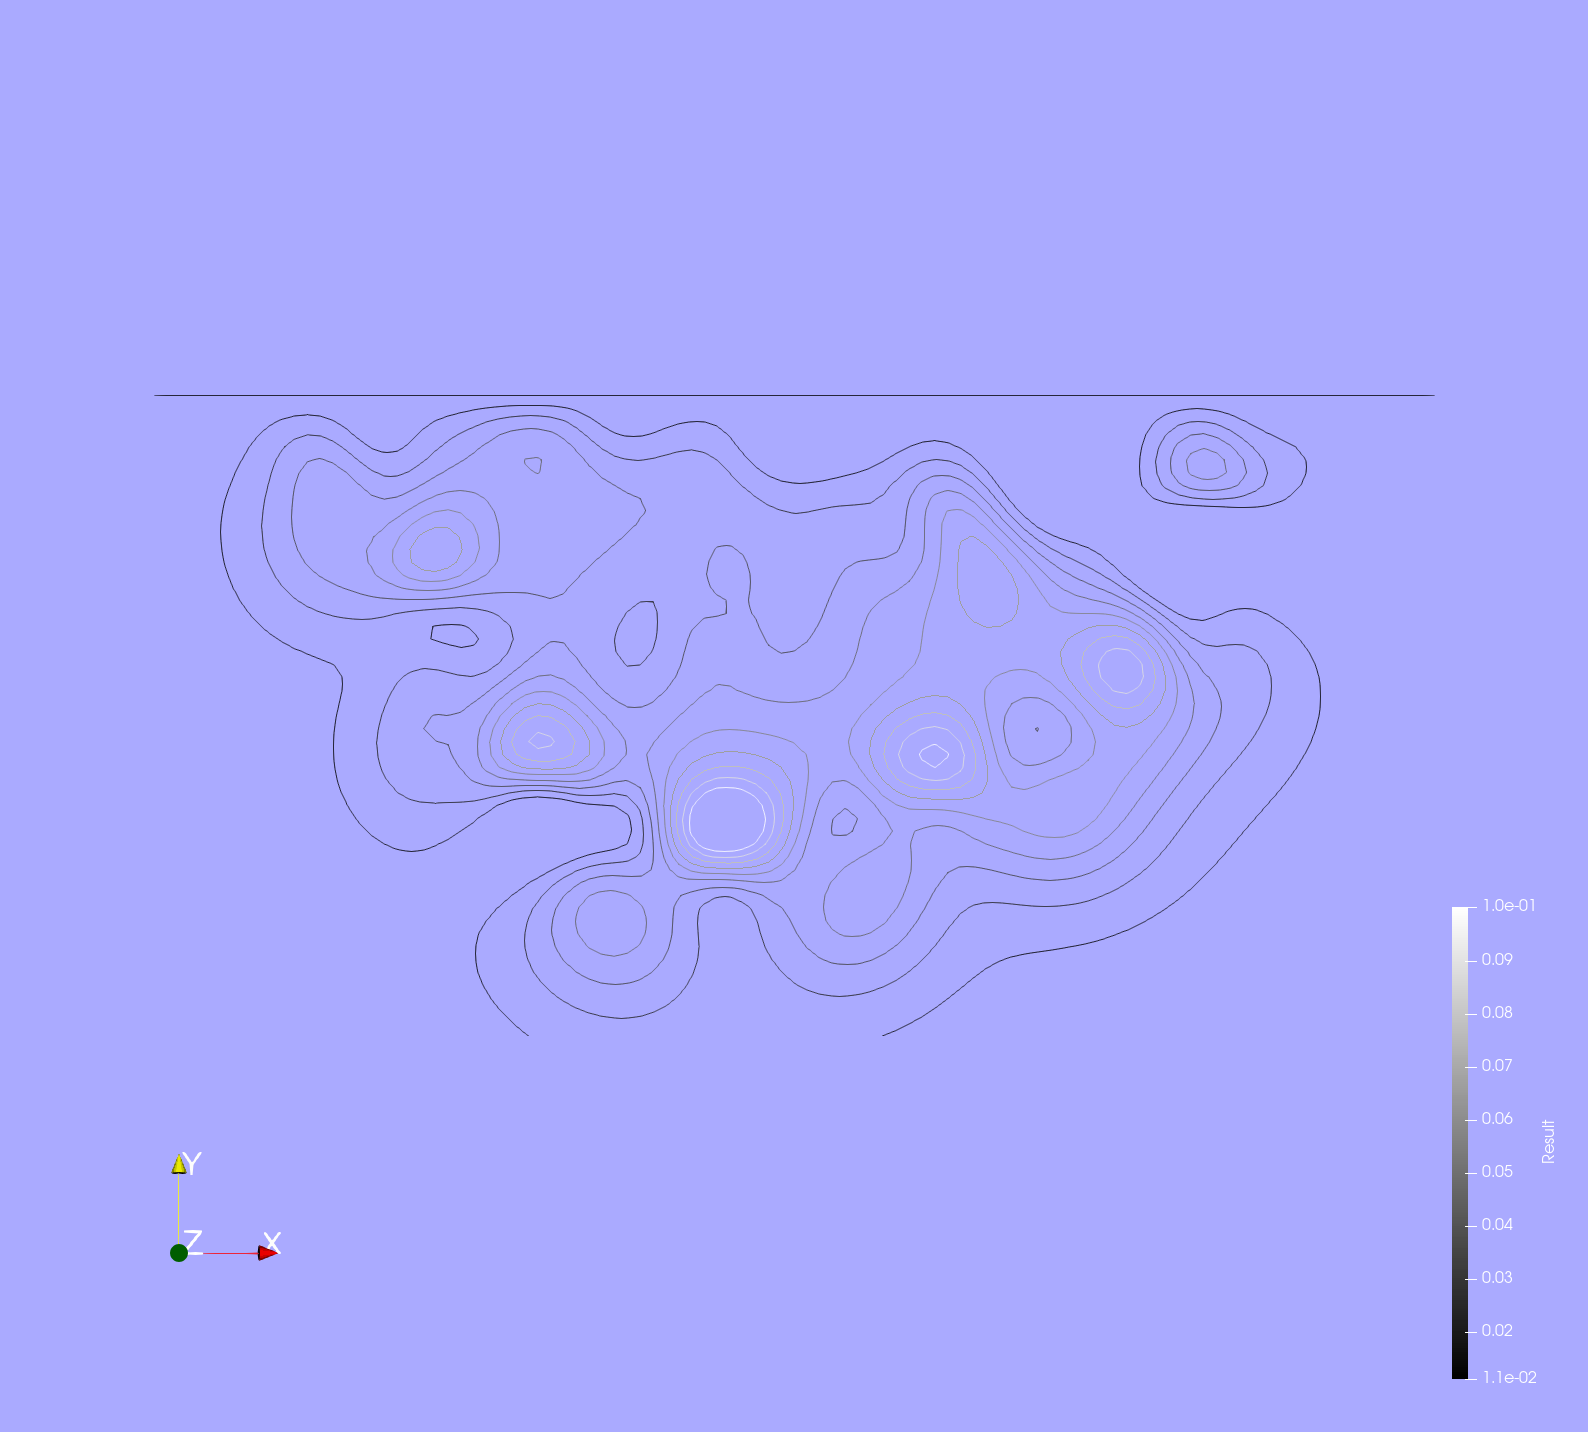
You can use TableToStructuredGrid to do that.
Statefile is here:
[structu.pvsm](https://discourse.paraview.org/uploads/short-url/sKGN1F4lmwNWQ2ExeXLd1aQR3Q4.pvsm) (585.2 KB)