# Streamlines on a 2D slice from a 3D domain
**URL:** https://discourse.paraview.org/t/streamlines-on-a-2d-slice-from-a-3d-domain/4701
**Category:** ParaView Support
**Created:** [June 27, 2020, 3:02pm UTC](https://discourse.paraview.org/t/streamlines-on-a-2d-slice-from-a-3d-domain/4701 "2020-06-27T15:02:40Z")
**Posts on this page:** 6
**Page:** 1
### Author:  [@sthavishtha](https://discourse.paraview.org/u/sthavishtha)
#### Post date: [June 27, 2020, 3:02pm UTC](https://discourse.paraview.org/t/streamlines-on-a-2d-slice-from-a-3d-domain/4701/1 "2020-06-27T15:02:40Z")
Hello everyone
I wanted to know if there exists any approach to plot streamlines on a 2D slice of a 3D domain.
Based on the discussions in this forum, I have managed to generate Surface LIC - a good way of visualizing streamlines on a 2D slice of a 3D domain with the following steps :
- I load the .pvd file in the **attachment** below.
- Use a _calculator_ to compute the velocity vector (named vel) from the physical velocity components.
- Slice the domain using the _slice_ filter.
- Visualize vel using _Surface LIC_
Paraview screen below :
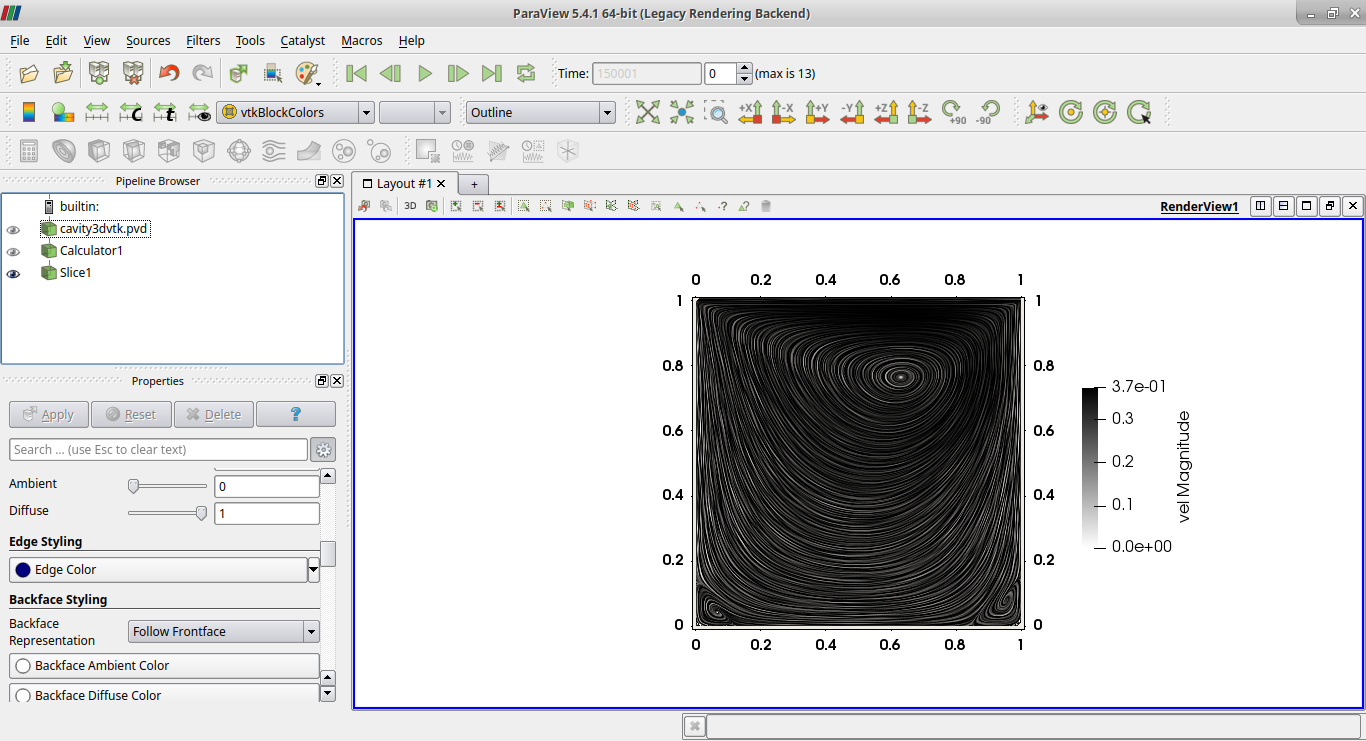
Unfortunately, the density of these lines is very high which makes it difficult for the reader to visualize the corner vortex structures if put on a paper. So, I wanted to know if any alternative approach exists.
For the case of a 2D domain, I adopt a usual approach - generate points using the _Mask points_ filter and apply the _Stream Tracer With Custom Source_ filter to visualize the streamlines. By controlling the number of mask points, I can appropriately control the density of these streamlines.
I have tried a similar approach for the current 3D case by using the _Mask points_ filter after _slicing_ the domain. Unfortunately, I get an error - “No points to mask” with an empty figure in the layout.
For reference the **attachment** can be found in this [link](https://drive.google.com/file/d/16v3JUkl2ObRXy3YAdwewkUxNBqzzAh3U/view?usp=sharing).
Thanks
Sthavishtha
---
### Author:  [@danlipsa](https://discourse.paraview.org/u/danlipsa)
#### Post date: [June 27, 2020, 6:12pm UTC](https://discourse.paraview.org/t/streamlines-on-a-2d-slice-from-a-3d-domain/4701/2 "2020-06-27T18:12:29Z")
Seems like you need something like:
[https://blog.kitware.com/evenly-spaced-streamlines-2d/](https://blog.kitware.com/evenly-spaced-streamlines-2d/)
Unfortunately, this only works on 2D planes perpendicular on Z for now.
It could be extended to work on arbitrarily oriented planes, but we’ll need to identify funding for this work.
dan
---
### Author:  [@sthavishtha](https://discourse.paraview.org/u/sthavishtha)
#### Post date: [June 28, 2020, 4:50am UTC](https://discourse.paraview.org/t/streamlines-on-a-2d-slice-from-a-3d-domain/4701/3 "2020-06-28T04:50:09Z")
Thanks for the reply. As of now, I just need it to work on planes perpendicular to the X, Y and Z axes.
I use Paraview 5.4.1 and I am unfortunately unable to find the filter you mention - _EvenlySpacedStreamlines2D_. Additionally, the clt dataset in the link you mention doesn’t seem to open - it gives me an error.
I have also tried the approach from this [link](https://www.cfd-online.com/Forums/paraview/121547-draw-streamlines-2d-slice.html) but can’t get it to work as well. This should sound obvious, but I am not sure where I am going wrong. Do you have any suggestions?
Thanks
Sthavishtha
---
### Author:  [@danlipsa](https://discourse.paraview.org/u/danlipsa)
#### Post date: [June 29, 2020, 12:09am UTC](https://discourse.paraview.org/t/streamlines-on-a-2d-slice-from-a-3d-domain/4701/4 "2020-06-29T00:09:09Z")
It might be that the ParaView version you are using is too old. The filter is available in the latest ParaView version 5.8.
There is a link in the blog to both the clt dataset and a paraview state file that creates the visualizations in the blog.
Dan
---
### Author:  [@sthavishtha](https://discourse.paraview.org/u/sthavishtha)
#### Post date: [June 30, 2020, 3:36pm UTC](https://discourse.paraview.org/t/streamlines-on-a-2d-slice-from-a-3d-domain/4701/5 "2020-06-30T15:36:19Z")
Thanks for your comments @danlipsa.
For the Ubuntu 18.04 bionic, Paraview 5.4.1 is the stable version available via apt-cache. I shall try to update this sometime later.
As of now, I use an inconvenient (and a tedious approach) to resolve this problem - I save the sliced data of the 3D domain into a VTK file (which will essentially be a 2D domain) and import this in a new paraview window. Then, I repeat the procedure for plotting streamlines in 2D as usual.
---
### Author:  [@Il\_Briga](https://discourse.paraview.org/u/Il_Briga)
#### Post date: [February 7, 2026, 10:00am UTC](https://discourse.paraview.org/t/streamlines-on-a-2d-slice-from-a-3d-domain/4701/6 "2026-02-07T10:00:58Z")
Hello there,
See my guide (very simple tutorial) [here](https://discourse.paraview.org/t/tutorial-streamlines-on-a-2d-slice-using-only-stream-tracer-filter/17435).
It perfectly suits your needs!