# Surf plot
**URL:** https://discourse.paraview.org/t/surf-plot/4319
**Category:** ParaView Support
**Tags:** vtk
**Created:** [May 12, 2020, 10:09pm UTC](https://discourse.paraview.org/t/surf-plot/4319 "2020-05-12T22:09:42Z")
**Posts on this page:** 2
**Page:** 1
### Author:  [@Marf](https://discourse.paraview.org/u/Marf)
#### Post date: [May 12, 2020, 10:09pm UTC](https://discourse.paraview.org/t/surf-plot/4319/1 "2020-05-12T22:09:43Z")
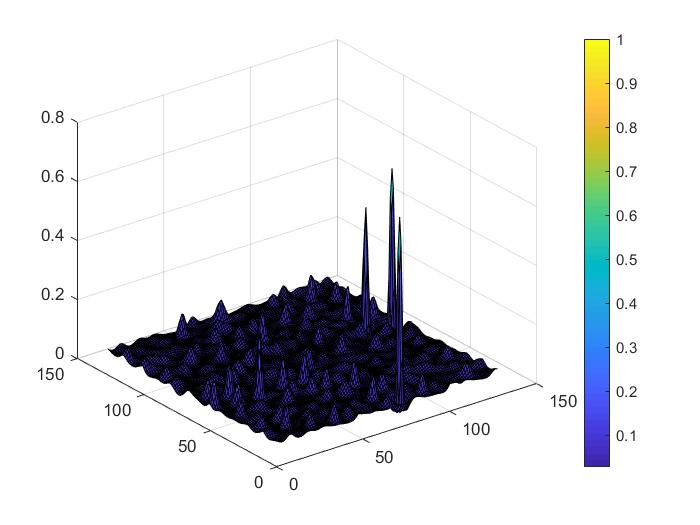
This is a Matlab generated surf plot. I want to plot like it in Paraview. Please let me know where is the option to plot this in Paraview. I have vtk format files.
Thank you for your consideration.
---
### Author:  [@mwestphal](https://discourse.paraview.org/u/mwestphal)
#### Post date: [May 13, 2020, 1:42am UTC](https://discourse.paraview.org/t/surf-plot/4319/2 "2020-05-13T01:42:03Z")
Hard to say if you do not share your file, but if you can generate that surface, then Axes Grid should do the trick.