# Table to Structured Grid, whole extent issue
**URL:** https://discourse.paraview.org/t/table-to-structured-grid-whole-extent-issue/2730
**Category:** ParaView Support
**Created:** [October 8, 2019, 5:15pm UTC](https://discourse.paraview.org/t/table-to-structured-grid-whole-extent-issue/2730 "2019-10-08T17:15:14Z")
**Posts on this page:** 7
**Page:** 1
### Author:  [@LCA](https://discourse.paraview.org/u/LCA)
#### Post date: [October 8, 2019, 5:15pm UTC](https://discourse.paraview.org/t/table-to-structured-grid-whole-extent-issue/2730/1 "2019-10-08T17:15:14Z")
Hi,
I am trying to read in the attached data and plot it out using the Table to Structured Grid command. From the web, it seems as though the extents should be X\_points-1, Y\_points-1, Z\_points-1 (or 9999, 9999, 9999 since there are 10,000 points in each direction). However, when I do that, I keep getting the error that follows this message.
Can someone explain to me what I am doing wrong? Thank you,
Alan
[test4.txt](https://discourse.paraview.org/uploads/short-url/sJSBWiThul79GF490BzZxgY3xIU.txt) (369.3 KB)
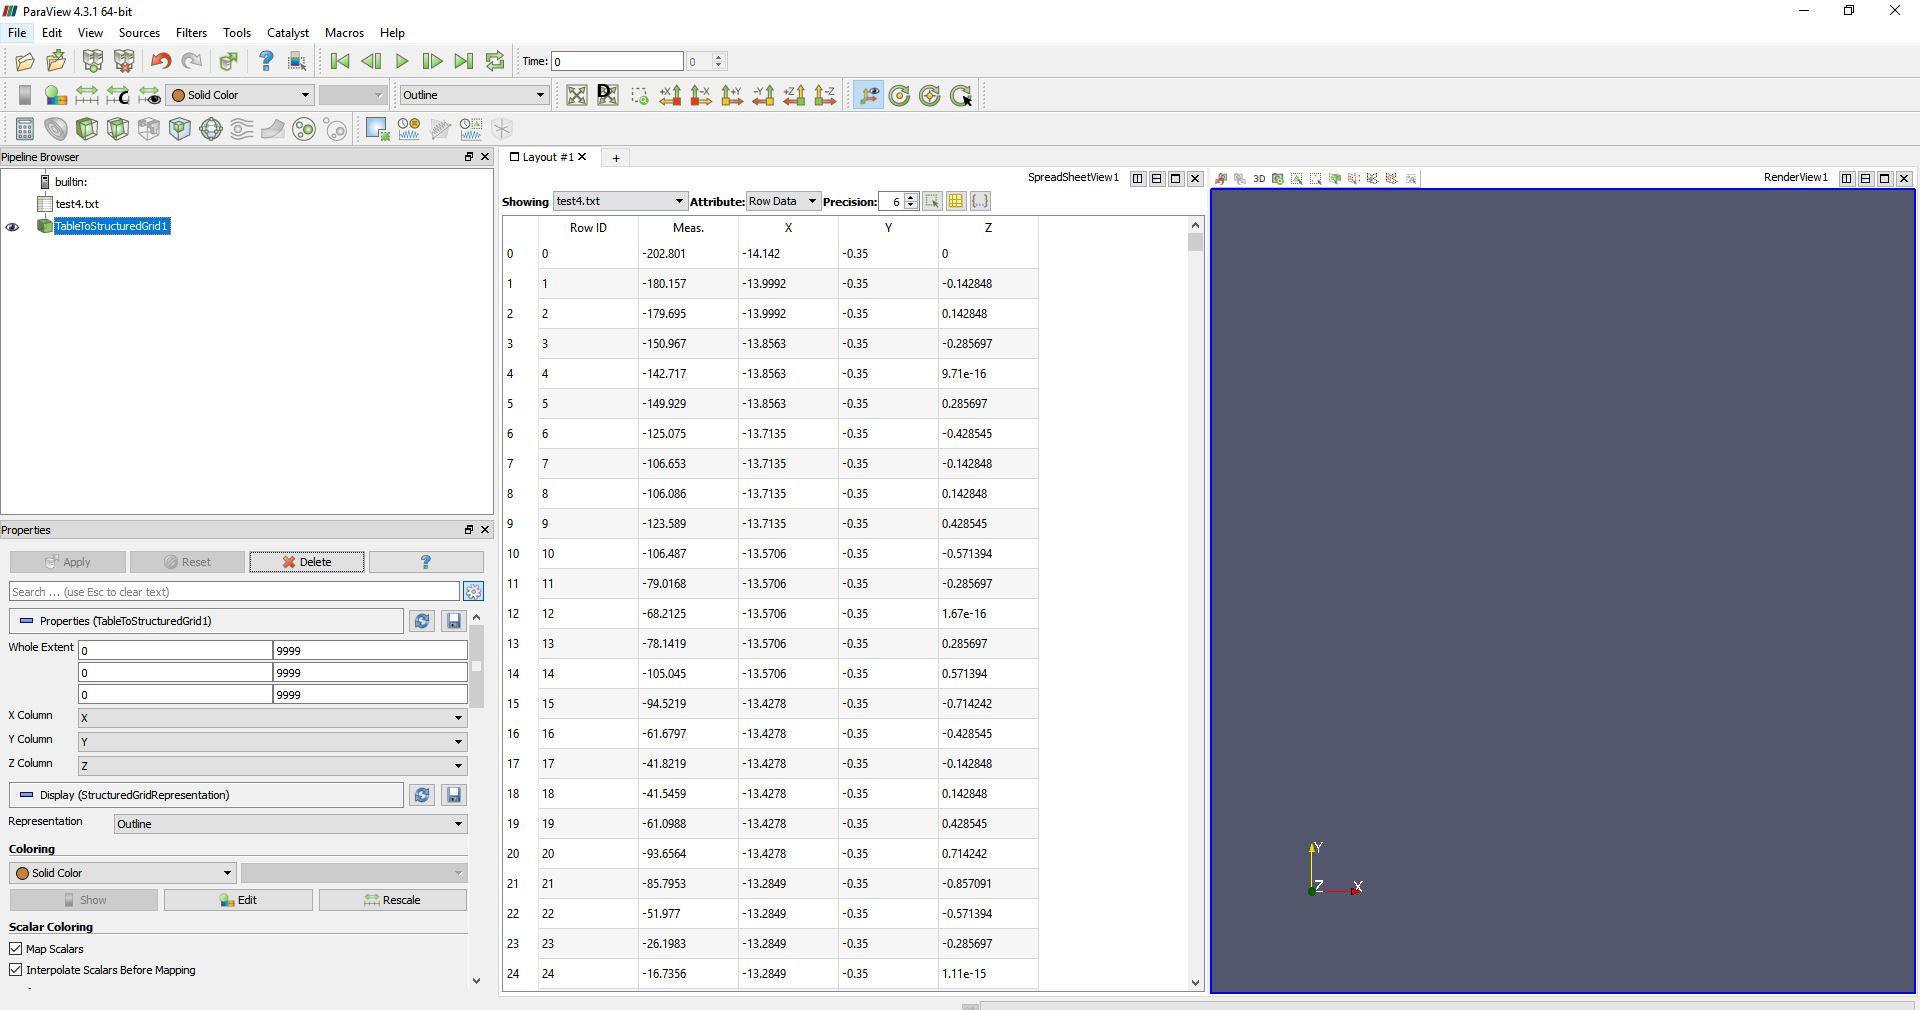
ERROR: In C:\DBD\pvs-x64\paraview\src\paraview\VTK\Filters\General\vtkTableToStructuredGrid.cxx, line 98
vtkTableToStructuredGrid (000000000F40B460): The input table must have exactly -727379968 rows. Currently it has 10000 rows.
ERROR: In C:\DBD\pvs-x64\paraview\src\paraview\VTK\Common\ExecutionModel\vtkExecutive.cxx, line 784
vtkPVCompositeDataPipeline (0000000018549C00): Algorithm vtkTableToStructuredGrid(000000000F40B460) returned failure for request: vtkInformation (000000001A9F24F0)
Debug: Off
Modified Time: 712944
Reference Count: 1
Registered Events: (none)
Request: REQUEST\_DATA
ALGORITHM\_AFTER\_FORWARD: 1
FORWARD\_DIRECTION: 0
FROM\_OUTPUT\_PORT: 0
ERROR: In C:\DBD\pvs-x64\paraview\src\paraview\VTK\Common\ExecutionModel\vtkExecutive.cxx, line 784
vtkCompositeDataPipeline (000000001882B730): Algorithm vtkPVGeometryFilter(000000001882A150) returned failure for request: vtkInformation (000000001A9F1240)
Debug: Off
Modified Time: 712516
Reference Count: 1
Registered Events: (none)
Request: REQUEST\_DATA\_OBJECT
ALGORITHM\_AFTER\_FORWARD: 1
FORWARD\_DIRECTION: 0
FROM\_OUTPUT\_PORT: 0
---
### Author:  [@cory.quammen](https://discourse.paraview.org/u/cory.quammen)
#### Post date: [October 8, 2019, 8:06pm UTC](https://discourse.paraview.org/t/table-to-structured-grid-whole-extent-issue/2730/2 "2019-10-08T20:06:56Z")
Welcome to ParaView, Alan!
You have 10,000 rows in your table, so X\_point \* Y\_points \* Z\_points must equal 10,000. However, you have your whole extent set so that the output will be a structured grid with 10,000 x 10,000 x 10,000 elements, which is obviously far more!
Does your data really form a structured grid? Or is it a set of disorganized points? If it is the latter, you can use the **Table to Points** filter instead.
---
### Author:  [@logmclassrulit](https://discourse.paraview.org/u/logmclassrulit)
#### Post date: [September 7, 2022, 6:59am UTC](https://discourse.paraview.org/t/table-to-structured-grid-whole-extent-issue/2730/3 "2022-09-07T06:59:16Z")
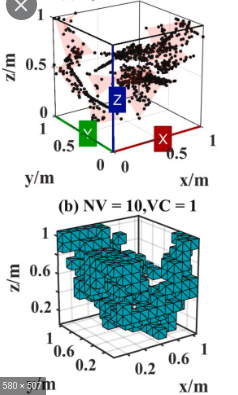
Hello. Cory, How to create cubes instead of point objects, as in the picture?
---
### Author:  [@cory.quammen](https://discourse.paraview.org/u/cory.quammen)
#### Post date: [September 7, 2022, 11:51am UTC](https://discourse.paraview.org/t/table-to-structured-grid-whole-extent-issue/2730/4 "2022-09-07T11:51:03Z")
This is unrelated to the original topic, but you can use **Glyph** filter with “Glyph Type” set to “Box”.
---
### Author:  [@logmclassrulit](https://discourse.paraview.org/u/logmclassrulit)
#### Post date: [September 7, 2022, 1:29pm UTC](https://discourse.paraview.org/t/table-to-structured-grid-whole-extent-issue/2730/5 "2022-09-07T13:29:06Z")
Thank you
---
### Author:  [@Sadra](https://discourse.paraview.org/u/Sadra)
#### Post date: [May 16, 2023, 8:15am UTC](https://discourse.paraview.org/t/table-to-structured-grid-whole-extent-issue/2730/6 "2023-05-16T08:15:07Z")
Hi Quammen,
I have the same problem and I would be thankful if you help me.
I am doing some experimental research and I have the velocity vector in a domain (x,y,vx,vy) in a csv file (16000 rows). I would like to read this file in the paraview in order to postprocess it. As far as I know, after importing the file, I need to use “table to point” filter. I did it successfully. Now, I would like to plot velocity over a line, but it does not work. I think there are some missing seteps in between in order to be able to post process further. I would be thankful if you share your opinion with me.
Best regards
---
### Author:  [@Sadra](https://discourse.paraview.org/u/Sadra)
#### Post date: [May 16, 2023, 11:15am UTC](https://discourse.paraview.org/t/table-to-structured-grid-whole-extent-issue/2730/7 "2023-05-16T11:15:40Z")
Hi Again,
I just understood how to solve the problem. 😄
In order tohave it here for other people, I explain it here.
**I exported the CSV file from the experiment. “n” different csv files for different time steps. Then, I named them .csv.0, .csv.1, .csv.2 and so on for different time steps. Then, I imported the csv sequence and selected the csv reader. Then, I applied the “table to point filter”. Then, I applied the Delaunay2D in order to see the mesh and be ready for the postprocessing. Before applying the Delaunay2D, it was not possible for me to plot over line or time, for example**.
I hope this explanation helps other people. Good luck.