# TabletoPoints-\>Delauny3D vs TabletoStructuredGrid
**URL:** https://discourse.paraview.org/t/tabletopoints-delauny3d-vs-tabletostructuredgrid/7587
**Category:** ParaView Support
**Created:** [July 10, 2021, 4:44pm UTC](https://discourse.paraview.org/t/tabletopoints-delauny3d-vs-tabletostructuredgrid/7587 "2021-07-10T16:44:11Z")
**Posts on this page:** 7
**Page:** 1
### Author:  [@eb1064](https://discourse.paraview.org/u/eb1064)
#### Post date: [July 10, 2021, 4:44pm UTC](https://discourse.paraview.org/t/tabletopoints-delauny3d-vs-tabletostructuredgrid/7587/1 "2021-07-10T16:44:11Z")
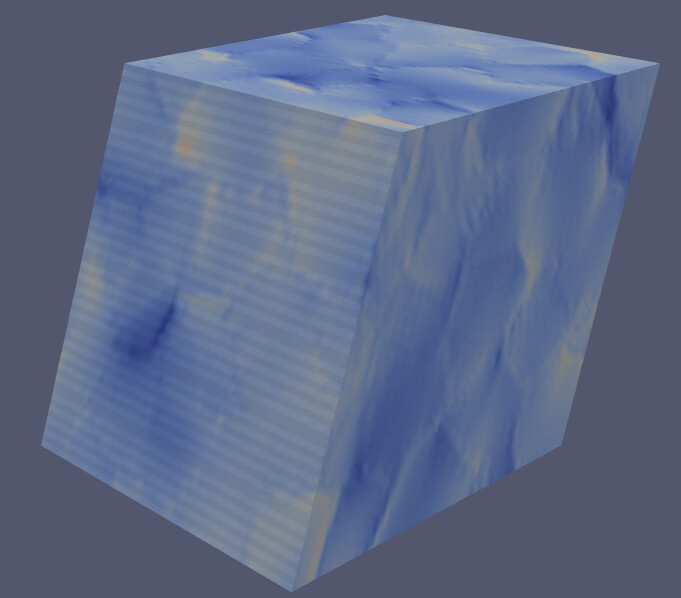
Help! I am trying to convert a .csv to a 3D plot. The .csv contains x, y, and z voxel coordinates. If I use **TabletoStructured Grid** , I get:
But if I use **TabletoPoints** → **Delauny3D** I get:
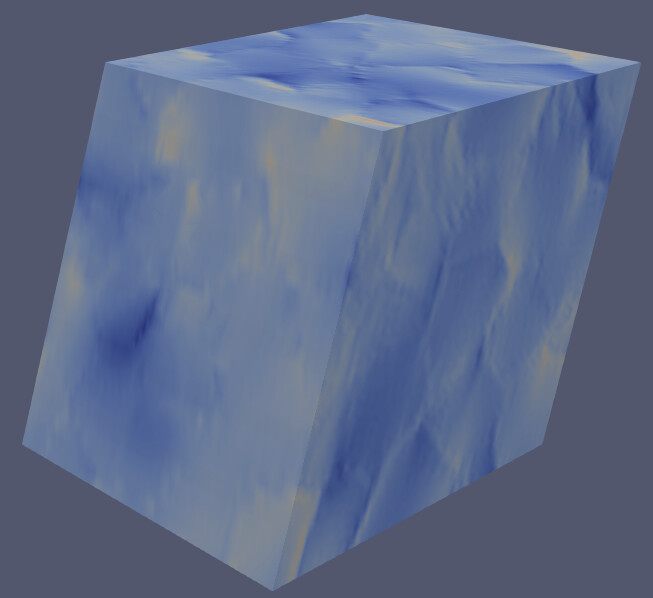
BUT. The **TabletoPoints** and **Delauny3D** filters takes about 10 minutes to load, and for my larger .csv files, it gets stuck after 5 HOURS. This is why I tried the **TabletoStructured Grid** filter, but it gives me these weird lines across the surface. Is there a way to make it smoother/no lines??
---
### Author:  [@Kenichiro-Yoshimi](https://discourse.paraview.org/u/Kenichiro-Yoshimi)
#### Post date: [July 11, 2021, 6:10am UTC](https://discourse.paraview.org/t/tabletopoints-delauny3d-vs-tabletostructuredgrid/7587/2 "2021-07-11T06:10:41Z")
Hello,
If you click the **Reset** icon  in the toolbar, will the artifacts be removed?
---
### Author:  [@eb1064](https://discourse.paraview.org/u/eb1064)
#### Post date: [July 11, 2021, 3:17pm UTC](https://discourse.paraview.org/t/tabletopoints-delauny3d-vs-tabletostructuredgrid/7587/3 "2021-07-11T15:17:54Z")
Hi Kyoshimi,
No, nothing happens when I click the **Reset** icon.
---
### Author:  [@Kenneth\_Moreland](https://discourse.paraview.org/u/Kenneth_Moreland)
#### Post date: [July 12, 2021, 5:27am UTC](https://discourse.paraview.org/t/tabletopoints-delauny3d-vs-tabletostructuredgrid/7587/4 "2021-07-12T05:27:28Z")
I suspect those “lines,” which look to me like small creases in the surface, are just a part of your data. It looks like the points on that face of your data do not all lie on the same plane. You wouldn’t see these creases using the `Delaunay` filter because that filter, which knows nothing about the structure of the points, fills a convex hull around the points. So, the `Delaunay` filter fills those creases so you don’t see them.
---
### Author:  [@eb1064](https://discourse.paraview.org/u/eb1064)
#### Post date: [July 13, 2021, 4:02am UTC](https://discourse.paraview.org/t/tabletopoints-delauny3d-vs-tabletostructuredgrid/7587/5 "2021-07-13T04:02:33Z")
Hi Kenneth,
I see what you are saying. Is there a way to view the .csv in 3D that won’t take hours? The **TabletoStructuredGrid** is very fast, but gives me those small creases.
Thanks
---
### Author:  [@Kenneth\_Moreland](https://discourse.paraview.org/u/Kenneth_Moreland)
#### Post date: [July 13, 2021, 12:23pm UTC](https://discourse.paraview.org/t/tabletopoints-delauny3d-vs-tabletostructuredgrid/7587/6 "2021-07-13T12:23:15Z")
What I’m trying to say is that the creases _are_ the correct 3D representation. Delaunay isn’t just slow, it’s wrong.
There might be some tricks you can pull to hide the fact that the face of your data isn’t flat (such turning off lighting or playing with the normals), but I suggest going back to the source of your .csv files and checking why the point coordinates you think should be on a flat plane are actually perturbed from that plane.
---
### Author:  [@eb1064](https://discourse.paraview.org/u/eb1064)
#### Post date: [July 20, 2021, 2:02pm UTC](https://discourse.paraview.org/t/tabletopoints-delauny3d-vs-tabletostructuredgrid/7587/7 "2021-07-20T14:02:28Z")
Hi Kenneth,
You are right, I went back to my .csv files and found an error. After correction, the **TabletoStructuredGrid** produced the same 3D plot as **Delaunay**. Thanks for your input!