# TAWSS AND OSI visualization in paraview
**URL:** https://discourse.paraview.org/t/tawss-and-osi-visualization-in-paraview/8650
**Category:** ParaView Support
**Created:** [December 18, 2021, 1:01pm UTC](https://discourse.paraview.org/t/tawss-and-osi-visualization-in-paraview/8650 "2021-12-18T13:01:12Z")
**Posts on this page:** 3
**Page:** 1
### Author:  [@Sumit\_Kumar](https://discourse.paraview.org/u/Sumit_Kumar)
#### Post date: [December 18, 2021, 1:01pm UTC](https://discourse.paraview.org/t/tawss-and-osi-visualization-in-paraview/8650/1 "2021-12-18T13:01:12Z")
I have a question that is about post-processing using Paraview to extract time-averaged values.
For my simulations (using simvascular) of flow in the human aorta, I am currently calculating the instantaneous wall shear stress (WSS) values at the surface of the geometry.
Now, additionally, I would like to calculate the time-averaged wall shear stress and the oscillating shear index.
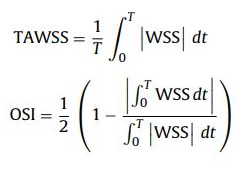
My WSS values for every timestep are saved to a time-series .vtp and .vtu format file
In ParaView, I can access the WSS values for every timestep
I would like to average these WSS values over three cardiac cycles.
Would it be possible to use a Programmable Filter to compute the oscillating shear index (OSI) and time-averaged Wall Shear Stress (Tawss)? Perhaps, could you refer me to an example of how to use this filter for a purpose such as this?
Thank you in advance for your time.
With kind regards,
---
### Author:  [@pavel](https://discourse.paraview.org/u/pavel)
#### Post date: [December 29, 2021, 3:41pm UTC](https://discourse.paraview.org/t/tawss-and-osi-visualization-in-paraview/8650/2 "2021-12-29T15:41:19Z")
Hi Sumit,
For time-averaged Wall Shear Stress (Tawss), you can try existing filter ‘Temporal Statistics’. I attached two figures to illustrate it for standard ParaView dataset ‘can.ex2’.
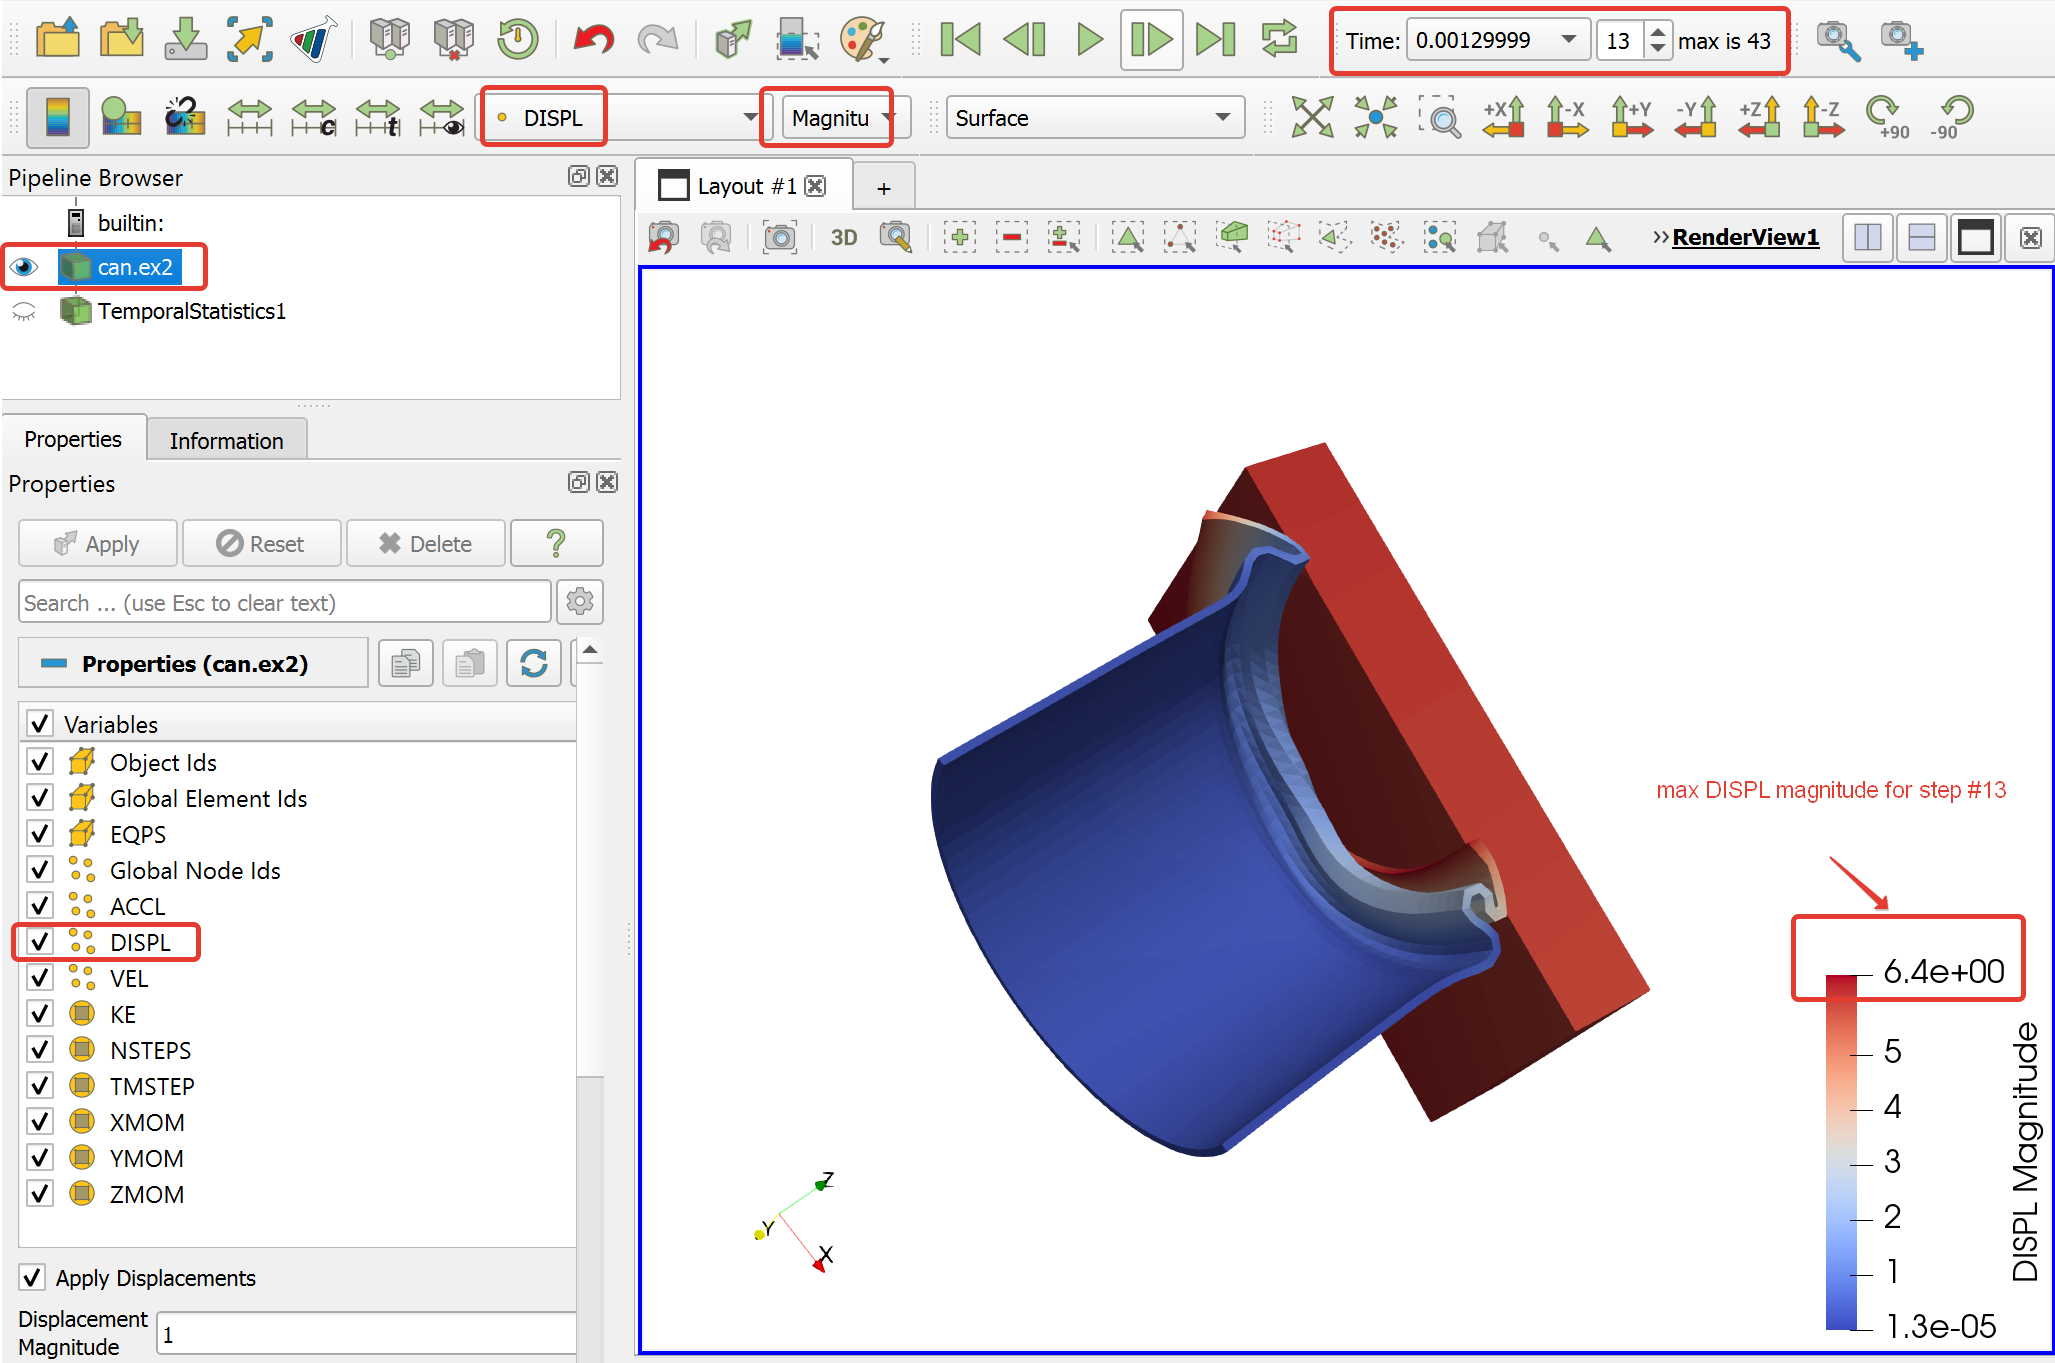
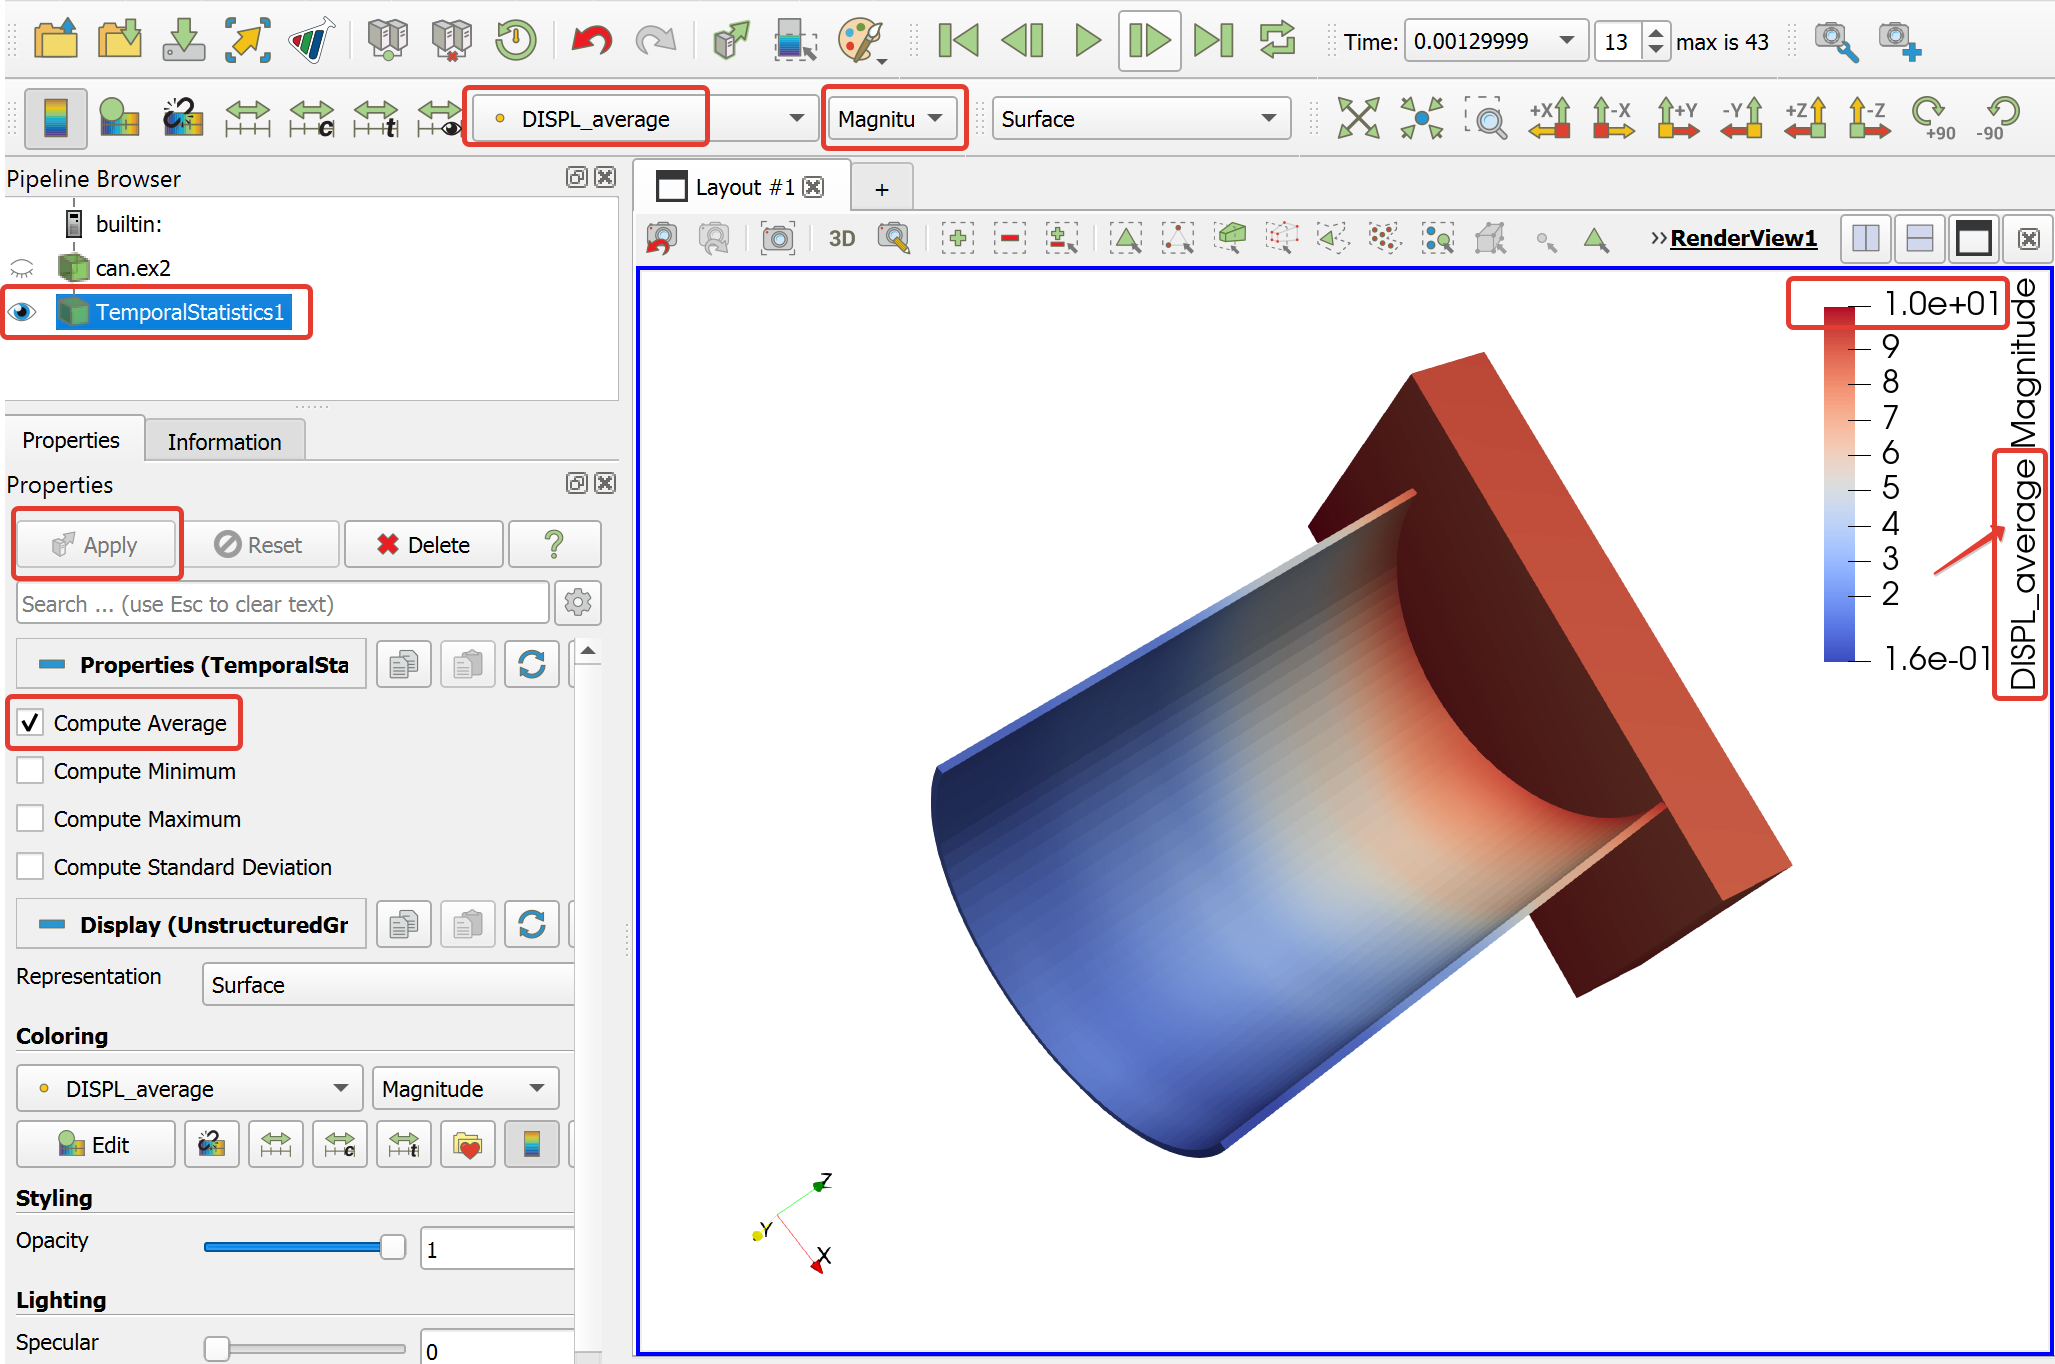
Does this approach work for your task (I mean Tawss)? Or do you need a solution through Programmable Filter only?
Best Regards,
Pavel
---
### Author:  [@Thansiya\_P\_A](https://discourse.paraview.org/u/Thansiya_P_A)
#### Post date: [September 11, 2024, 1:40pm UTC](https://discourse.paraview.org/t/tawss-and-osi-visualization-in-paraview/8650/3 "2024-09-11T13:40:22Z")
hi pavel,
i am working on same thing (tawss)…
by doing the same as told here - i couldnt find the answer . can you suggest different approach/more