# The question about how to obtain a graph of the product changes over time.
**URL:** https://discourse.paraview.org/t/the-question-about-how-to-obtain-a-graph-of-the-product-changes-over-time/14633
**Category:** ParaView Support
**Tags:** vtk
**Created:** [May 15, 2024, 11:32am UTC](https://discourse.paraview.org/t/the-question-about-how-to-obtain-a-graph-of-the-product-changes-over-time/14633 "2024-05-15T11:32:40Z")
**Posts on this page:** 7
**Page:** 1
### Author:  [@Guanlong](https://discourse.paraview.org/u/Guanlong)
#### Post date: [May 15, 2024, 11:32am UTC](https://discourse.paraview.org/t/the-question-about-how-to-obtain-a-graph-of-the-product-changes-over-time/14633/1 "2024-05-15T11:32:40Z")
Researchers, I have some VTK files about particle information and different gas products. I want to obtain a graph of the product’s variation over time, but I don’t know how to operate it. Can you help me get the result? It will be appreciated if the problem can be solved. Thanks
[VTK.zip](https://discourse.paraview.org/uploads/short-url/lOr4aCRuJWE3qsWNGhjAyTMgy7v.zip) (3.7 MB)
everyone.
---
### Author:  [@mwestphal](https://discourse.paraview.org/u/mwestphal)
#### Post date: [May 15, 2024, 11:39am UTC](https://discourse.paraview.org/t/the-question-about-how-to-obtain-a-graph-of-the-product-changes-over-time/14633/2 "2024-05-15T11:39:50Z")
> [@Guanlong](#):
>
> product’s variation over time
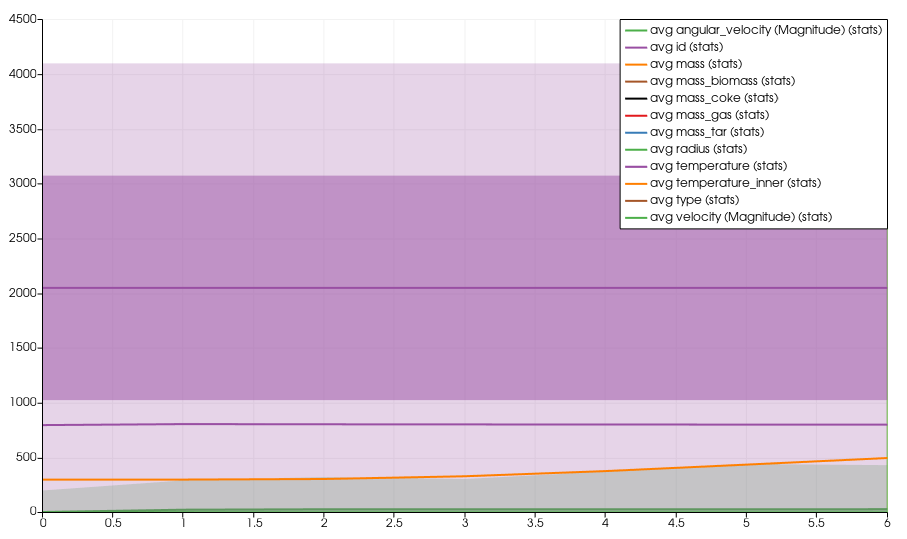
how do you define “product variation” ?
PlotDataOvetTime give you this:
---
### Author:  [@Guanlong](https://discourse.paraview.org/u/Guanlong)
#### Post date: [May 15, 2024, 11:41am UTC](https://discourse.paraview.org/t/the-question-about-how-to-obtain-a-graph-of-the-product-changes-over-time/14633/3 "2024-05-15T11:41:25Z")
Thank you very much for your reply. I would like to know the specific operation process. Can you provide it?
---
### Author:  [@mwestphal](https://discourse.paraview.org/u/mwestphal)
#### Post date: [May 15, 2024, 11:54am UTC](https://discourse.paraview.org/t/the-question-about-how-to-obtain-a-graph-of-the-product-changes-over-time/14633/4 "2024-05-15T11:54:47Z")
- run ParaView
- File → Open → particle…vtk → Apply
- Filters → Alphabetical → PlotDataOverTime → Apply
---
### Author:  [@Guanlong](https://discourse.paraview.org/u/Guanlong)
#### Post date: [May 15, 2024, 12:29pm UTC](https://discourse.paraview.org/t/the-question-about-how-to-obtain-a-graph-of-the-product-changes-over-time/14633/5 "2024-05-15T12:29:01Z")
Thank you for your patient reply. I just succeeded. But I also want to export a file with data that changes over time. How should I do this?
---
### Author:  [@Kenneth\_Moreland](https://discourse.paraview.org/u/Kenneth_Moreland)
#### Post date: [May 15, 2024, 12:41pm UTC](https://discourse.paraview.org/t/the-question-about-how-to-obtain-a-graph-of-the-product-changes-over-time/14633/6 "2024-05-15T12:41:56Z")
After following @mwestphal’s instructions, save the data. Either `File` → `Save Data...` or click  in the toolbar on the upper left.
You can save the data as a csv file, which can be loaded in other tools such as a spreadsheet like Excel or Google Sheets.
---
### Author:  [@Guanlong](https://discourse.paraview.org/u/Guanlong)
#### Post date: [May 15, 2024, 2:03pm UTC](https://discourse.paraview.org/t/the-question-about-how-to-obtain-a-graph-of-the-product-changes-over-time/14633/7 "2024-05-15T14:03:57Z")
Thank you for your patient reply.