# The radius display of particles is incorrect
**URL:** https://discourse.paraview.org/t/the-radius-display-of-particles-is-incorrect/14962
**Category:** ParaView Support
**Tags:** vtk
**Created:** [July 1, 2024, 11:46am UTC](https://discourse.paraview.org/t/the-radius-display-of-particles-is-incorrect/14962 "2024-07-01T11:46:57Z")
**Posts on this page:** 7
**Page:** 1
### Author:  [@Guanlong](https://discourse.paraview.org/u/Guanlong)
#### Post date: [July 1, 2024, 11:46am UTC](https://discourse.paraview.org/t/the-radius-display-of-particles-is-incorrect/14962/1 "2024-07-01T11:46:57Z")
Hello researchers, I have several VTK files containing two different particle sizes, with radii of 3.55e-4 m (particle 1) and 5e-4 m (particle 2), respectively. As the reaction progresses, the radius of particle 2 gradually decreases. I want to obtain the variation of the radius of particle 2 over time. When I select the function of PlotDataOverTime in the Paraview, the radius does not decrease from the initial radius of 5–4 m, but from 3.87–4 m. However, the radius at this point was 5e-4 m when I looked at the file particle-0 (initial time), which means that the radius of particle-2 should start to decrease from 5e-4 m. In fact, I want to obtain a curve that starts to decrease over time at 5e-4 m when time is 0. How should I proceed?
[VTK.zip](https://discourse.paraview.org/uploads/short-url/q7dNWeoiqPaok9zKiKh6KWpfJuv.zip) (3.7 MB)
---
### Author:  [@Kenneth\_Moreland](https://discourse.paraview.org/u/Kenneth_Moreland)
#### Post date: [July 1, 2024, 12:33pm UTC](https://discourse.paraview.org/t/the-radius-display-of-particles-is-incorrect/14962/2 "2024-07-01T12:33:27Z")
I don’t think the files you posted has the data you think it has. I opened your files in ParaView and first verified with the spreadsheet view that the first two points have `id` 1 and 2, respectively. These do not change over any timestep. I then looked at the `radius` value. The radius is reported as `0.000355` and also does not change on any timestep.
To make sure ParaView is reading the data correct, I opened up your files with a text editor. (They are written in ASCII format, which makes it a lot easier.) I opened `particle-0.vtk` and searched for the `id` field. I found it starting at line 17034.
```auto
SCALARS id float 1
LOOKUP_TABLE default
1
2
```
I then found the `radius` field starting on line 25550.
```auto
SCALARS radius float 1
LOOKUP_TABLE default
3.5500000000000001e-04
3.5500000000000001e-04
```
So both particles definitely start with radius 3.55e-4, just like ParaView reports. I checked all 8 files, and they all have the same values for radius. What I get with ParaView and its `Plot Selection Over Time` matches this.
---
### Author:  [@Guanlong](https://discourse.paraview.org/u/Guanlong)
#### Post date: [July 2, 2024, 1:21am UTC](https://discourse.paraview.org/t/the-radius-display-of-particles-is-incorrect/14962/3 "2024-07-02T01:21:21Z")
No, it isn’t. When you open the particle-0.vtk file (the time is 0, that is the initial moment), you will see two radii, as shown below.
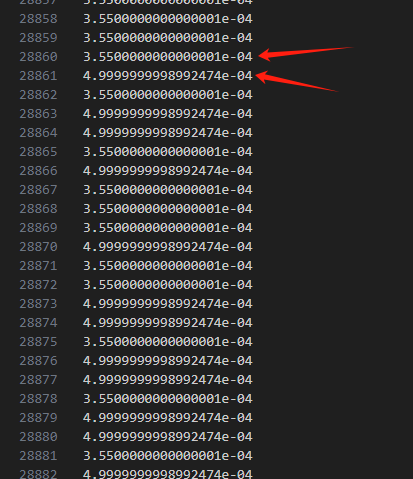
When opening the particle-1000.vtk file (which is the file for the next moment), you will also see two radii, as shown below.
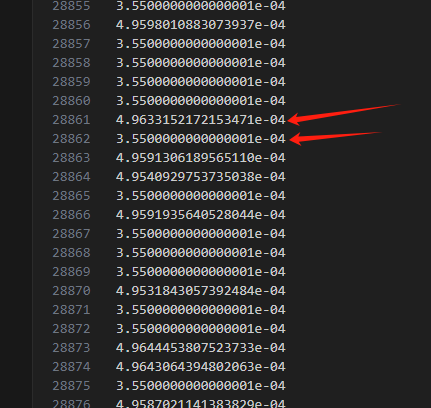
When opening the particle-2000.vtk file (which is the file for the next moment), you will also see two radii, as shown below.
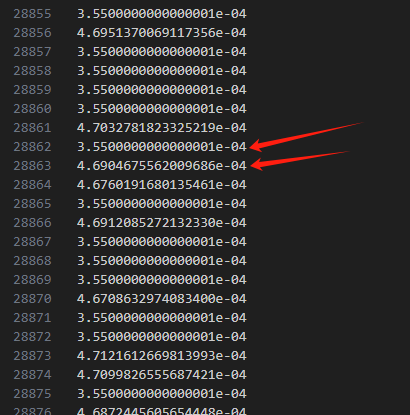
When opening the particle-3000.vtk file (which is the file for the next moment), you will also see two radii, as shown below.
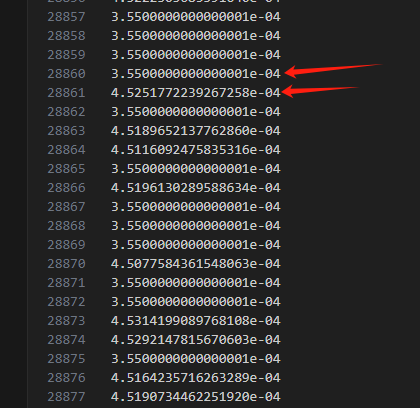
At this point, you will see particles with an initial radius of 5e-4, whose radius gradually decreases.
---
### Author:  [@Kenneth\_Moreland](https://discourse.paraview.org/u/Kenneth_Moreland)
#### Post date: [July 2, 2024, 11:26am UTC](https://discourse.paraview.org/t/the-radius-display-of-particles-is-incorrect/14962/4 "2024-07-02T11:26:03Z")
I am really confused about what you expect to see. You originally said particle 1 and particle 2, so I assumed you meant the first two particles, which also have `id`s 1 and 2. Now you are giving a screenshot showing lines 28860 and 28861 of your first file. This corresponds to the radii for the 3309th and 3310th particles. These will be given internal point ids in ParaView as 3308 and 3309. When I look at these values in the ParaView spreadsheet, I see that these correspond to particles with `id`s of 2559 and 3821, and their corresponding radius values match what is in the file. In the screenshot from ParaView below, I am highlighting the particles corresponding to lines 28860 to 28863.

Now in the next screenshot you show for `particle-1000.vtk`, you are pointing to two different lines. You are point to 28861 and 28862 instead of 28860 and 28861. Regardless, when I update ParaView to the next time step, the values match those in the file.
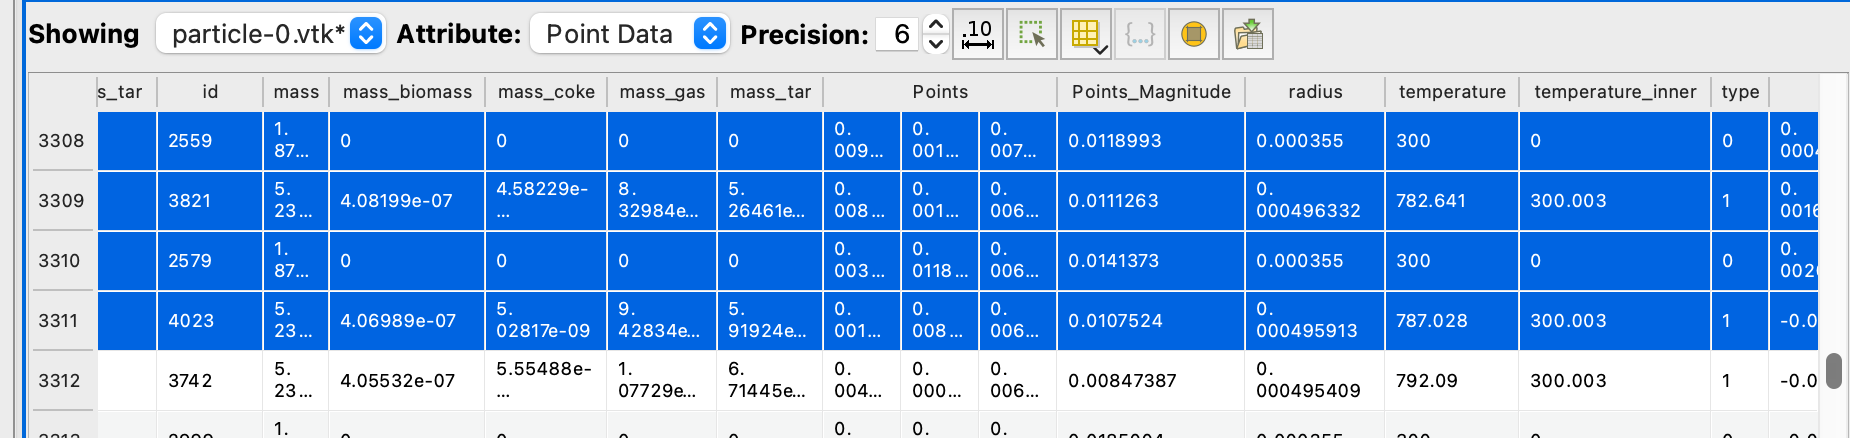
Your next two screenshots shift around some more, pointing to lines 28862-28863 and then back to 28860-28861. Nevertheless, ParaView is consistent with what is in the file.
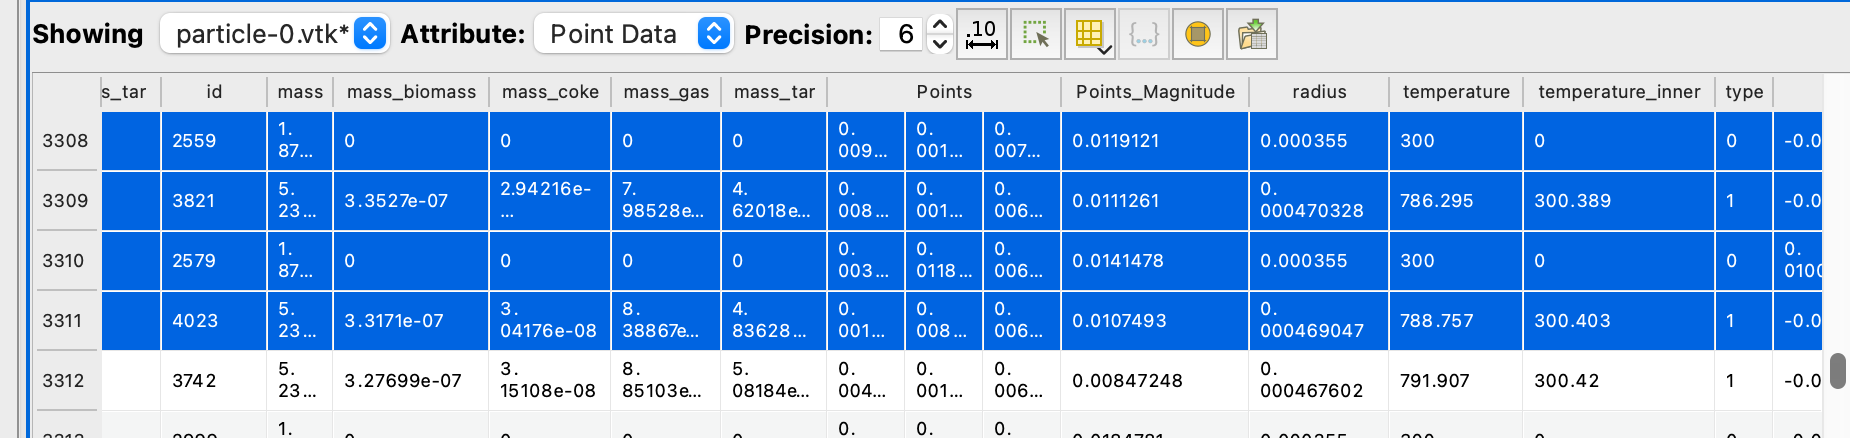
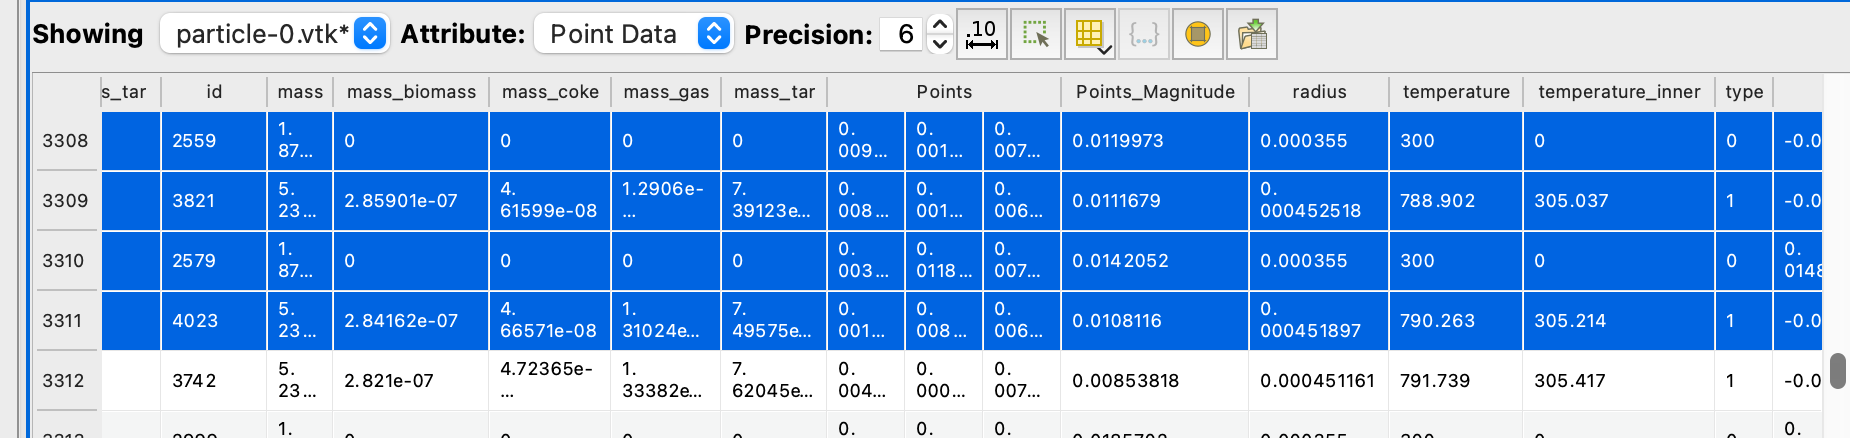
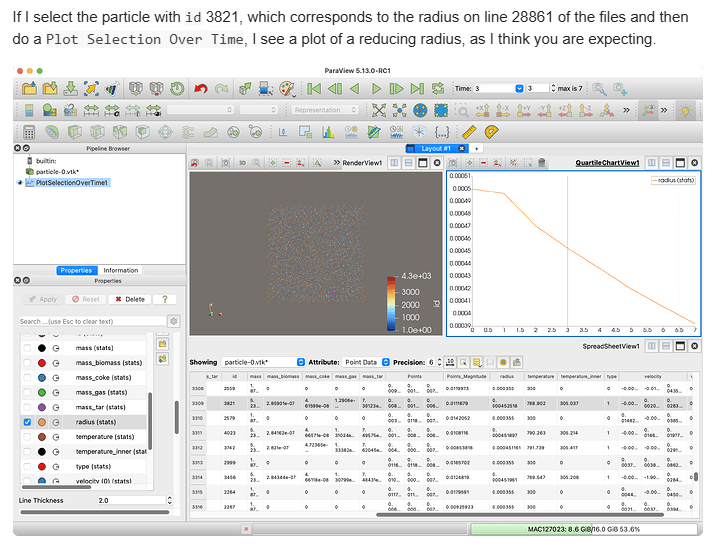
If I select the particle with `id` 3821, which corresponds to the radius on line 28861 of the files and then do a `Plot Selection Over Time`, I see a plot of a reducing radius, as I think you are expecting.
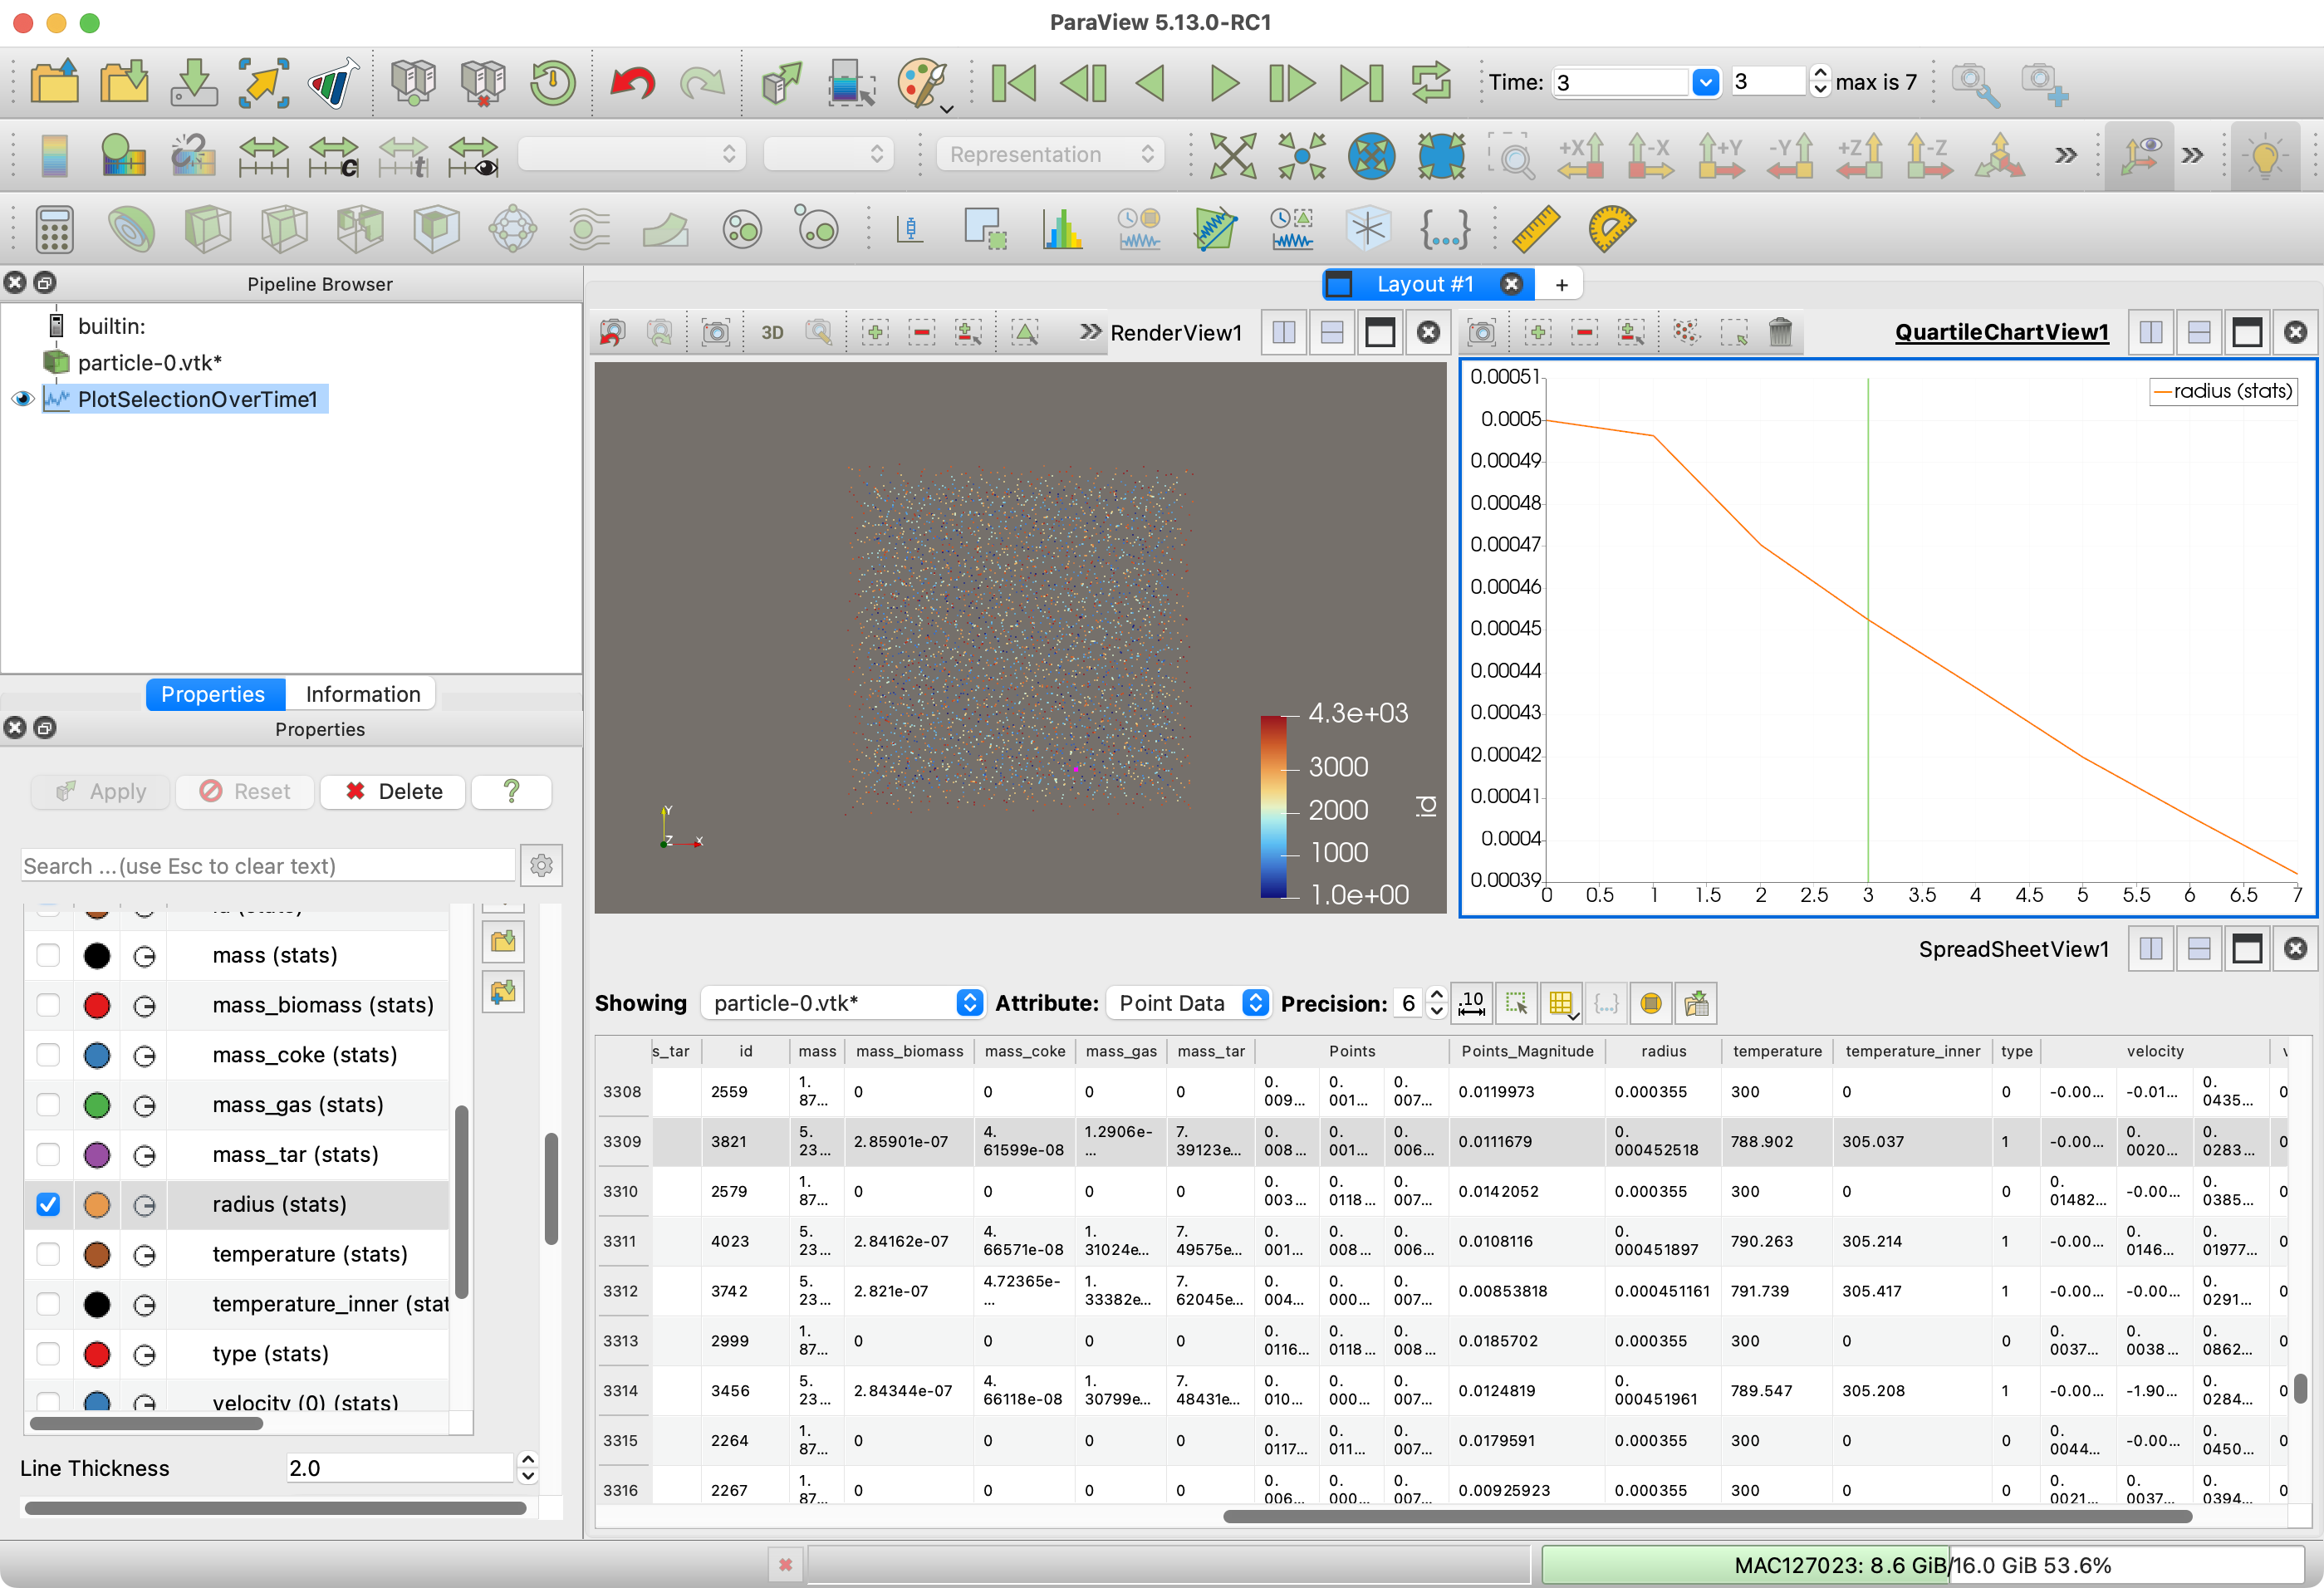
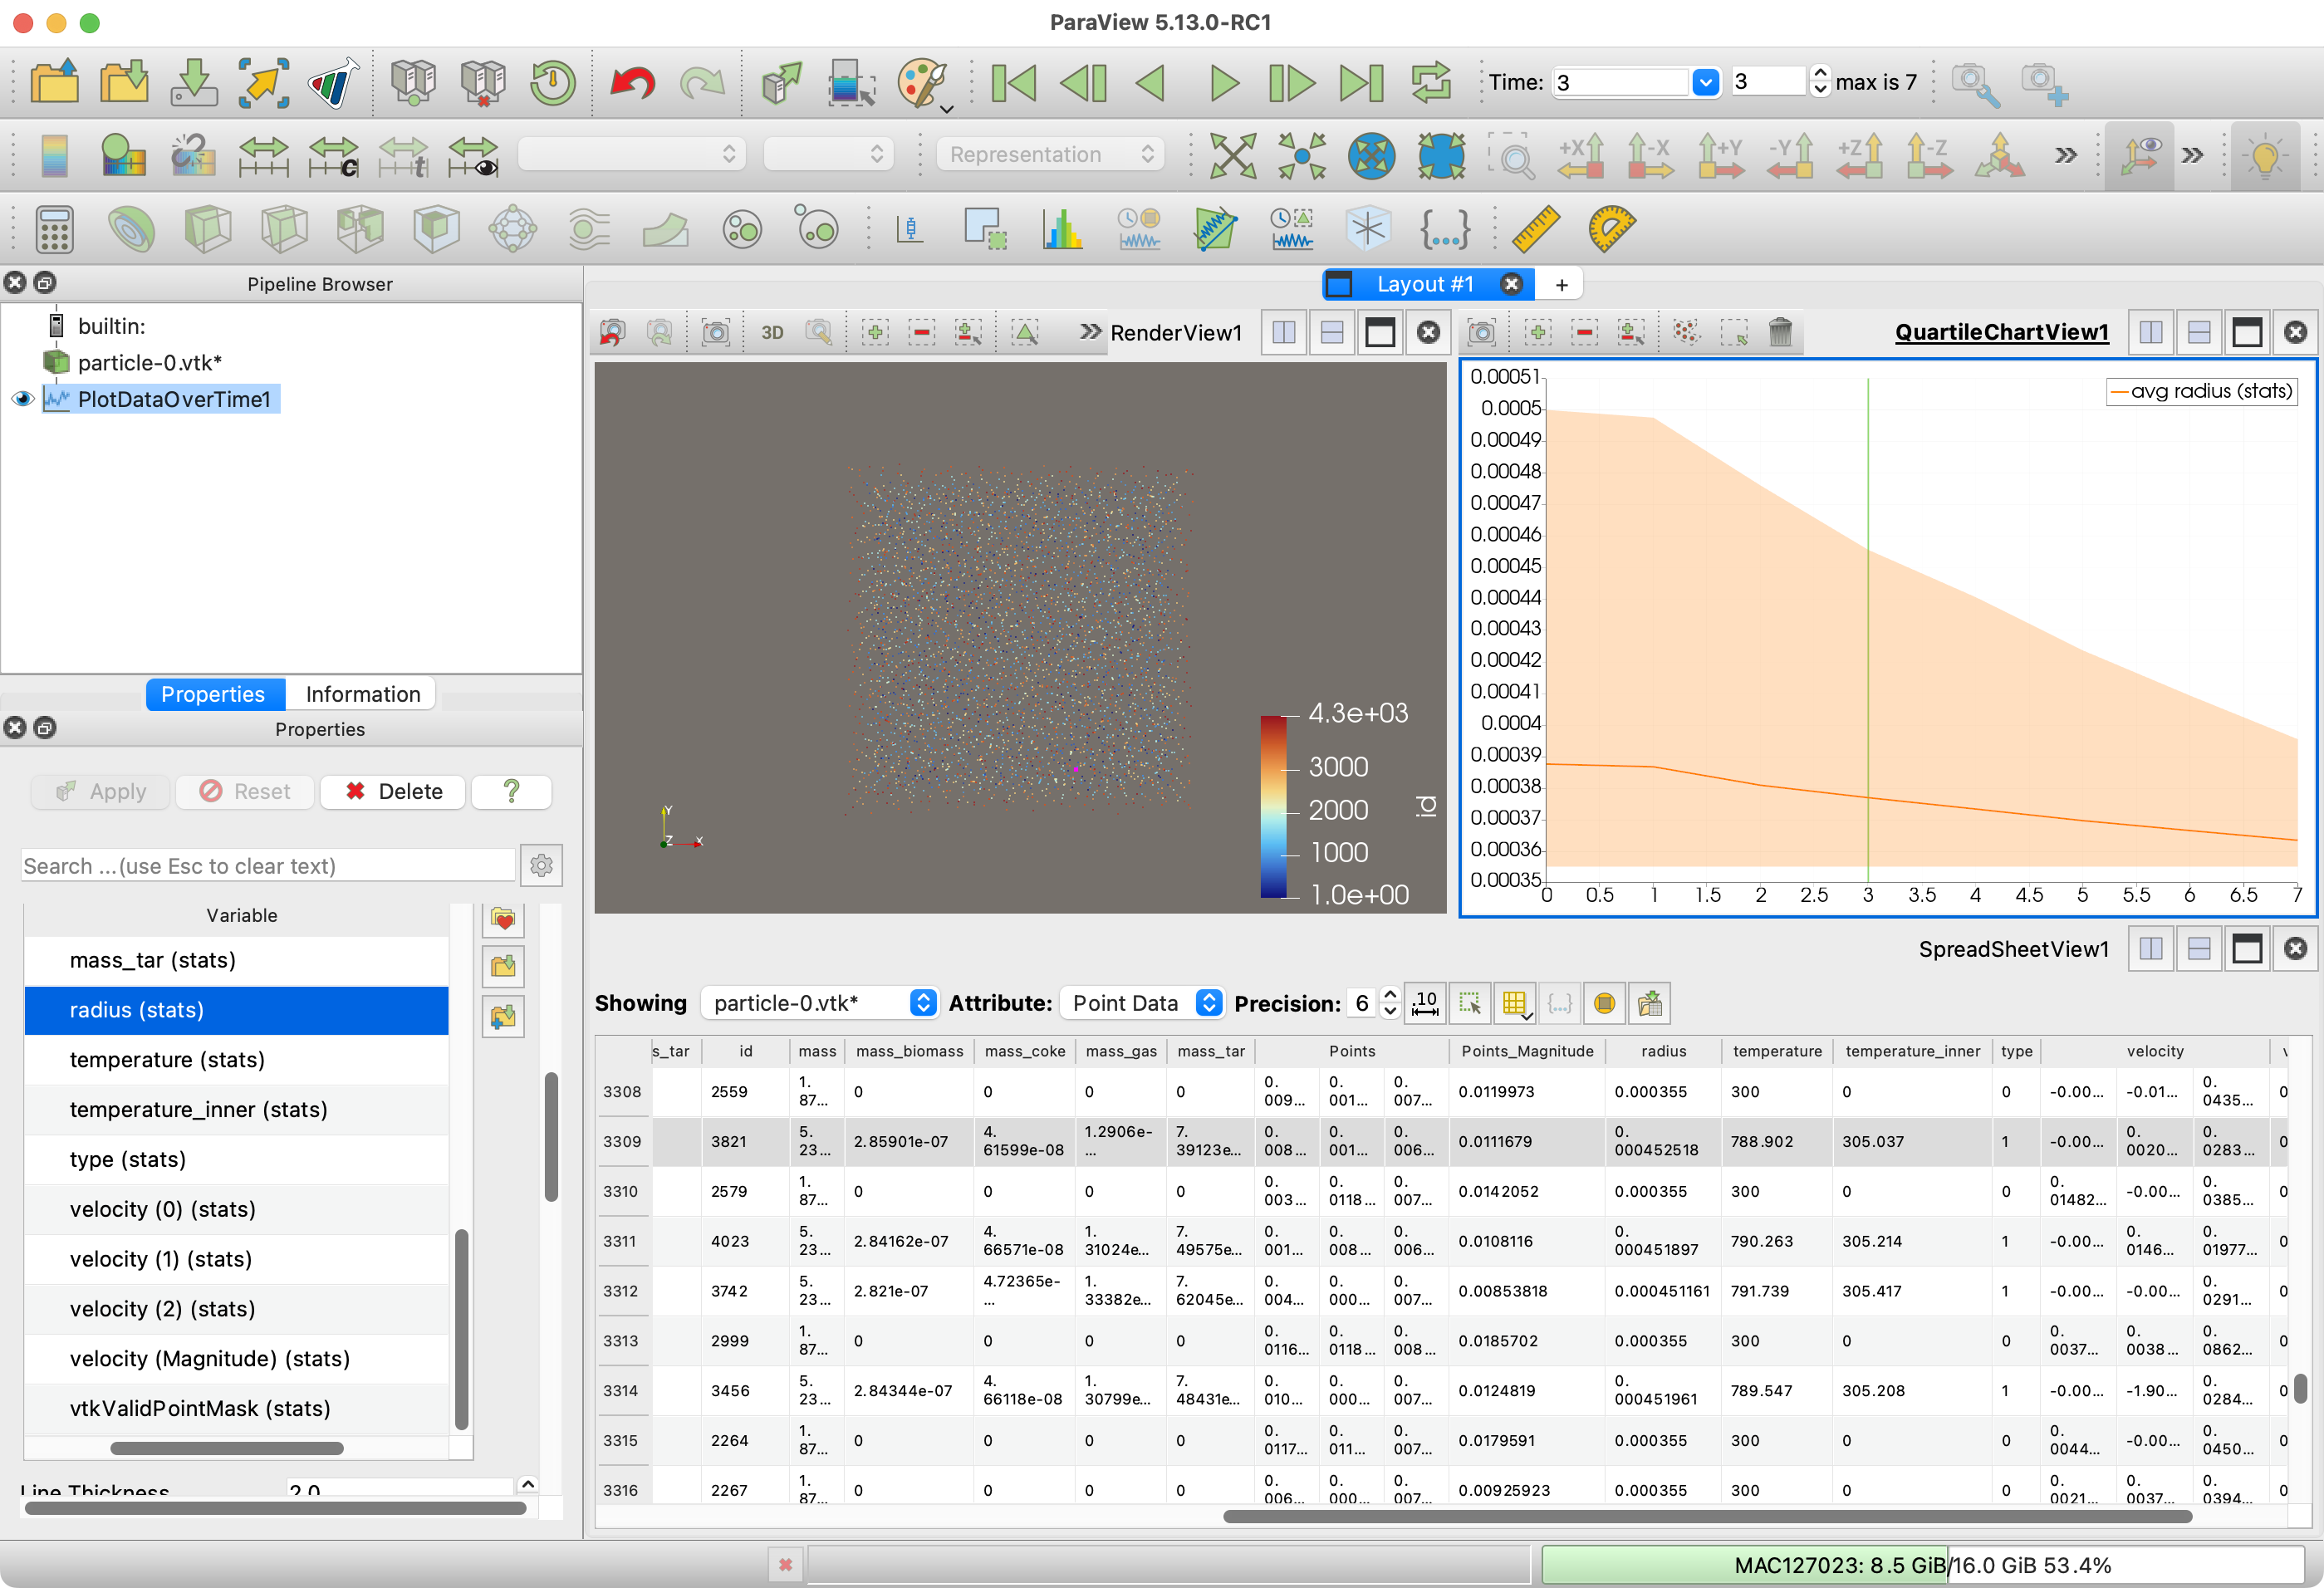
If I instead do a `Plot Data Over Time`. which will instead show statistics for all particles, I see a general decrease of radius across the particles.
---
### Author:  [@Guanlong](https://discourse.paraview.org/u/Guanlong)
#### Post date: [July 3, 2024, 1:02am UTC](https://discourse.paraview.org/t/the-radius-display-of-particles-is-incorrect/14962/5 "2024-07-03T01:02:59Z")
I sincerely appreciate your very detailed and patient response. Perhaps I didn’t clarify my question. I’m very sorry, but your answer solved my problem, as shown in the following picture. How can I operate Paraview to get the same interface and results as you?
---
### Author:  [@Kenneth\_Moreland](https://discourse.paraview.org/u/Kenneth_Moreland)
#### Post date: [July 3, 2024, 1:25am UTC](https://discourse.paraview.org/t/the-radius-display-of-particles-is-incorrect/14962/6 "2024-07-03T01:25:19Z")
Here are the steps to create this plot.
1. Select the particle you want to plot the radius of. There are lots of ways to select things in ParaView, and the user’s guide has [a whole chapter on selection](https://docs.paraview.org/en/v5.12.1/UsersGuide/selectingData.html). Most likely you will select things [in the 3D view](https://docs.paraview.org/en/v5.12.1/UsersGuide/selectingData.html#selecting-in-render-view), [in the spreadsheet view](https://docs.paraview.org/en/v5.12.1/UsersGuide/selectingData.html#selecting-in-spreadsheet-view), or [the Find Data dialog](https://docs.paraview.org/en/v5.12.1/UsersGuide/selectingData.html#creating-selections-using-the-find-data-panel).
2. Add the `Plot Selection Over Time` filter. When you create it, your current selection will get populated in the `Properties` panel. When you hit `Apply`, a plot view will be created.
3. The plot will initially be plotting a lot of fields you don’t want to see. Scroll down the `Properties` panel until you see the `Series Parameters`, which has lots of check boxes. Uncheck all the boxes _except_ the one you want (`radius (stats)`).
---
### Author:  [@Guanlong](https://discourse.paraview.org/u/Guanlong)
#### Post date: [July 3, 2024, 1:46am UTC](https://discourse.paraview.org/t/the-radius-display-of-particles-is-incorrect/14962/7 "2024-07-03T01:46:16Z")
Thank you again for helping me solve the problem that has been bothering me for a long time.