# Thresholding Nodal Information in VTK file
**URL:** https://discourse.paraview.org/t/thresholding-nodal-information-in-vtk-file/5613
**Category:** ParaView Support
**Created:** [October 21, 2020, 3:53pm UTC](https://discourse.paraview.org/t/thresholding-nodal-information-in-vtk-file/5613 "2020-10-21T15:53:31Z")
**Posts on this page:** 4
**Page:** 1
### Author:  [@reox](https://discourse.paraview.org/u/reox)
#### Post date: [October 21, 2020, 3:53pm UTC](https://discourse.paraview.org/t/thresholding-nodal-information-in-vtk-file/5613/1 "2020-10-21T15:53:31Z")
I have a VTK file containing scalar values for some points.
I would like to display them as a point gaussian and furthermore threshold some values, for example remove all values which are zero.
Here is a small test sample:
[test\_nodal.vtk](https://discourse.paraview.org/uploads/short-url/fGIcOXRzBSWZHWnf6YPEruPgG0i.vtk) (2.1 KB)
I can load the VTK without problems and display the point gaussian:
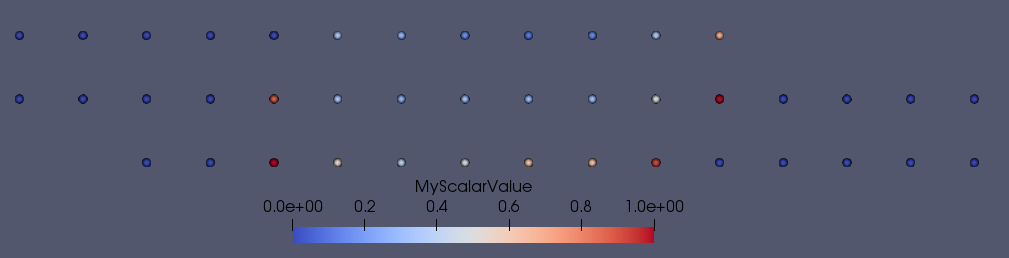
but the threshold gives always an empty result, as the scalar values can not be selected anymore.
Is this possible in paraview or do I need to pre-process the data beforehand?
---
### Author:  [@wascott](https://discourse.paraview.org/u/wascott)
#### Post date: [October 21, 2020, 5:09pm UTC](https://discourse.paraview.org/t/thresholding-nodal-information-in-vtk-file/5613/2 "2020-10-21T17:09:11Z")
I believe the issue is with the dataset, not paraview. From what I can see, you have a bunch of points, but no cells. The threshold filter only works on cells. I tried the clip by scalar filter, that also fails. Basically, you don’t have a viable dataset to work with.
One idea I had did work. Run the Glyph filter, which takes the points and effectively creates a dataset with cell. Now, threshold or clip by scalar on that.
---
### Author:  [@Kenneth\_Moreland](https://discourse.paraview.org/u/Kenneth_Moreland)
#### Post date: [October 21, 2020, 7:10pm UTC](https://discourse.paraview.org/t/thresholding-nodal-information-in-vtk-file/5613/3 "2020-10-21T19:10:17Z")
To be more specific about using the `Glyph` filter as @wascott suggested, you want to create `Vertex`-type glyphs. Doing that is counterintuitive right now (see [bug #18002](https://gitlab.kitware.com/paraview/paraview/-/issues/18002)). This should be fixed in ParaView 5.9, but for now you have to do the following:
- Select `2D Glyph` as the `Glyph Type`
- Turn on advanced properties
- Find another property that is confusingly also named `Glyph Type`
- Change that to `Vertex`
---
### Author:  [@reox](https://discourse.paraview.org/u/reox)
#### Post date: [October 22, 2020, 8:34am UTC](https://discourse.paraview.org/t/thresholding-nodal-information-in-vtk-file/5613/4 "2020-10-22T08:34:37Z")
Okay, using the Glyph seems to work for thresholding.
> I believe the issue is with the dataset, not paraview.
What would be the preferred way to insert such point information into paraview? I.e. when I have several measurements (might be scalars, vectors or tensors) at some coordinates.
In that example, there is actually a rectangular grid involved, however that would mean I have to convert all the information here represented at points into cells…
I’m pretty much free with the input format but existing code already uses ASCII VTK, which I would like to keep.