# Transforming columns of a csv file into a vector field for Stream tracer
**URL:** https://discourse.paraview.org/t/transforming-columns-of-a-csv-file-into-a-vector-field-for-stream-tracer/14436
**Category:** ParaView Support
**Created:** [April 19, 2024, 7:54am UTC](https://discourse.paraview.org/t/transforming-columns-of-a-csv-file-into-a-vector-field-for-stream-tracer/14436 "2024-04-19T07:54:33Z")
**Posts on this page:** 6
**Page:** 1
### Author:  [@mariavd](https://discourse.paraview.org/u/mariavd)
#### Post date: [April 19, 2024, 7:54am UTC](https://discourse.paraview.org/t/transforming-columns-of-a-csv-file-into-a-vector-field-for-stream-tracer/14436/1 "2024-04-19T07:54:34Z")
I have a CSV file containing six columns - x, y, z, Jx, Jy, Jz. I need to create streamlines to visualise the vector field J. What is the correct way to do so?
I tried several things but neither worked out so far. I tried Table to Structured Grid and specified the columns to Field 3, Field 4 and Field 5, i.e., the vector components. For Whole Extent, I entered the number of elements on the grid minus 1. In the output messages, It says that The input table must have exatly 1 rows. Currently it has 236196 rows. I don’t understand what it means.
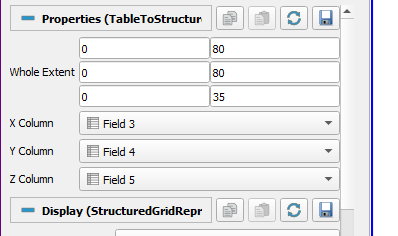
I tried generating a generic file for a 3x3 grid and the Whole Extent 0 - 2 on all dimensions but that was not working, either.
I came across this thread where they suggested using the calculator filter.
> [@How to generate streamline with CSV file](https://discourse.paraview.org/t/how-to-generate-streamline-with-csv-file/9392):
>
> Dear all I would like to generate streamline with my CFD result However, I can’t apply ‘Streamline Tracer fileter’ Does anyone can help me this kinds of problem? I saved my data to csv file format
I entered the following
“Field 3”\*iHat+“Field 4”\*jHat+“Field 5”\*kHat
and in the Information section I can see a 2D array:
Result double [-4,4], [-4,4], [0, 3.5]
The Stream Tracer is grayed out. How can I turn the calculator output into a 3D array?
I use Paraview 5.12.0 on Windows.
---
### Author:  [@mwestphal](https://discourse.paraview.org/u/mwestphal)
#### Post date: [April 19, 2024, 7:59am UTC](https://discourse.paraview.org/t/transforming-columns-of-a-csv-file-into-a-vector-field-for-stream-tracer/14436/2 "2024-04-19T07:59:43Z")
Please share your data
---
### Author:  [@RaphaelBerger](https://discourse.paraview.org/u/RaphaelBerger)
#### Post date: [April 19, 2024, 9:04am UTC](https://discourse.paraview.org/t/transforming-columns-of-a-csv-file-into-a-vector-field-for-stream-tracer/14436/3 "2024-04-19T09:04:48Z")
Hello,
I am cooperating with Maria Dimitrova, and the question arose of our common work. A small example file would be like
[exam01.txt](https://discourse.paraview.org/uploads/short-url/zdrjn6h4ISgGEvxmJvaEJsJfNXv.txt) (510 Bytes)
the full data mentioned in the post is this (bzip2 ed):
[all.txt.bz2](https://discourse.paraview.org/uploads/short-url/wdRge2G3bCfeC6lAyHsDZdHZXoI.bz2) (2.3 MB)
Thank you & kind regards
---
### Author:  [@mwestphal](https://discourse.paraview.org/u/mwestphal)
#### Post date: [April 19, 2024, 9:22am UTC](https://discourse.paraview.org/t/transforming-columns-of-a-csv-file-into-a-vector-field-for-stream-tracer/14436/4 "2024-04-19T09:22:15Z")
Here it is:
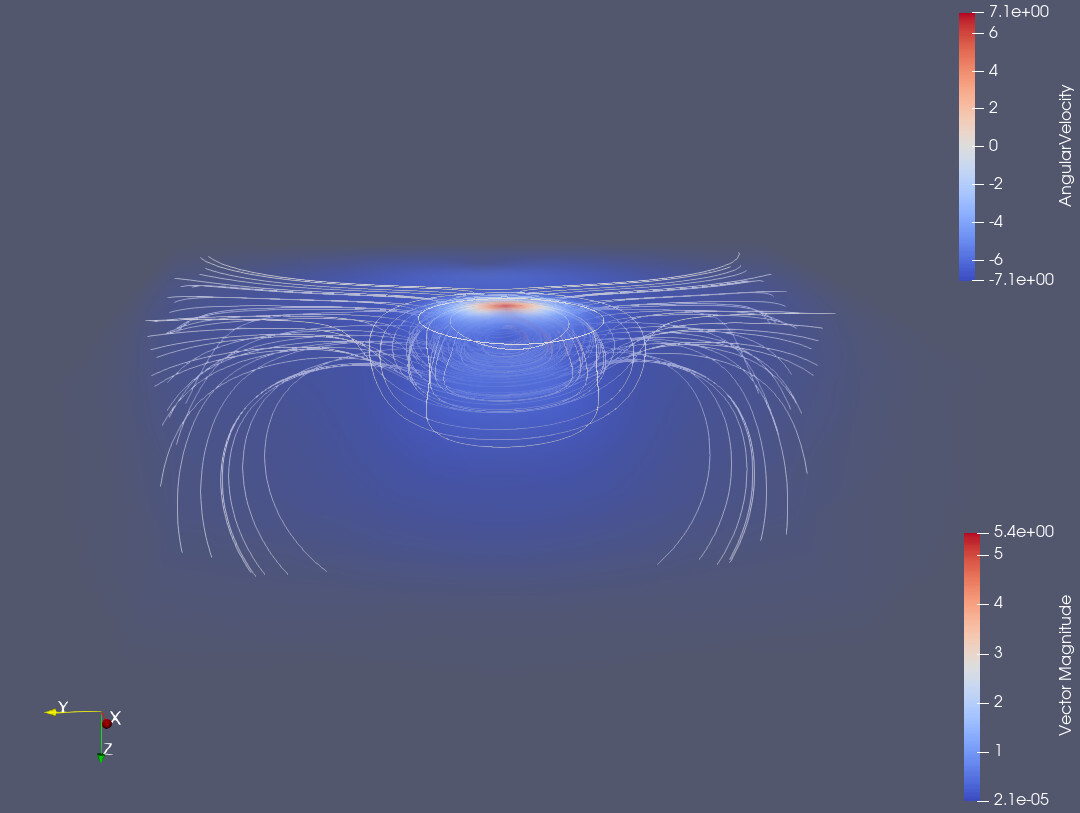
Here is the state file:
[streamAndVol.pvsm](https://discourse.paraview.org/uploads/short-url/hfiZfWS6sSIuKd7WSDVV3Azmg9h.pvsm) (600.5 KB)
In short:
- Open with the delimited text reader, with the right parameters
- Figure out the extent (-40, 40, -40, 40, 0, 35)
- TableToStructuredGrid
- MergeVectorComponents
---
### Author:  [@RaphaelBerger](https://discourse.paraview.org/u/RaphaelBerger)
#### Post date: [April 19, 2024, 9:27am UTC](https://discourse.paraview.org/t/transforming-columns-of-a-csv-file-into-a-vector-field-for-stream-tracer/14436/5 "2024-04-19T09:27:05Z")
I see now how it works, awesome, thank you very much indeed!
Raphael
---
### Author:  [@mariavd](https://discourse.paraview.org/u/mariavd)
#### Post date: [April 19, 2024, 3:15pm UTC](https://discourse.paraview.org/t/transforming-columns-of-a-csv-file-into-a-vector-field-for-stream-tracer/14436/6 "2024-04-19T15:15:18Z")
Thank you for the quick response! Works perfectly.