# trasforming geophisical data into a 3d mesh
**URL:** https://discourse.paraview.org/t/trasforming-geophisical-data-into-a-3d-mesh/1442
**Category:** ParaView Support
**Created:** [March 11, 2019, 8:09pm UTC](https://discourse.paraview.org/t/trasforming-geophisical-data-into-a-3d-mesh/1442 "2019-03-11T20:09:40Z")
**Posts on this page:** 13
**Page:** 1
### Author:  [@ubi\_laptop](https://discourse.paraview.org/u/ubi_laptop)
#### Post date: [March 11, 2019, 8:09pm UTC](https://discourse.paraview.org/t/trasforming-geophisical-data-into-a-3d-mesh/1442/1 "2019-03-11T20:09:40Z")
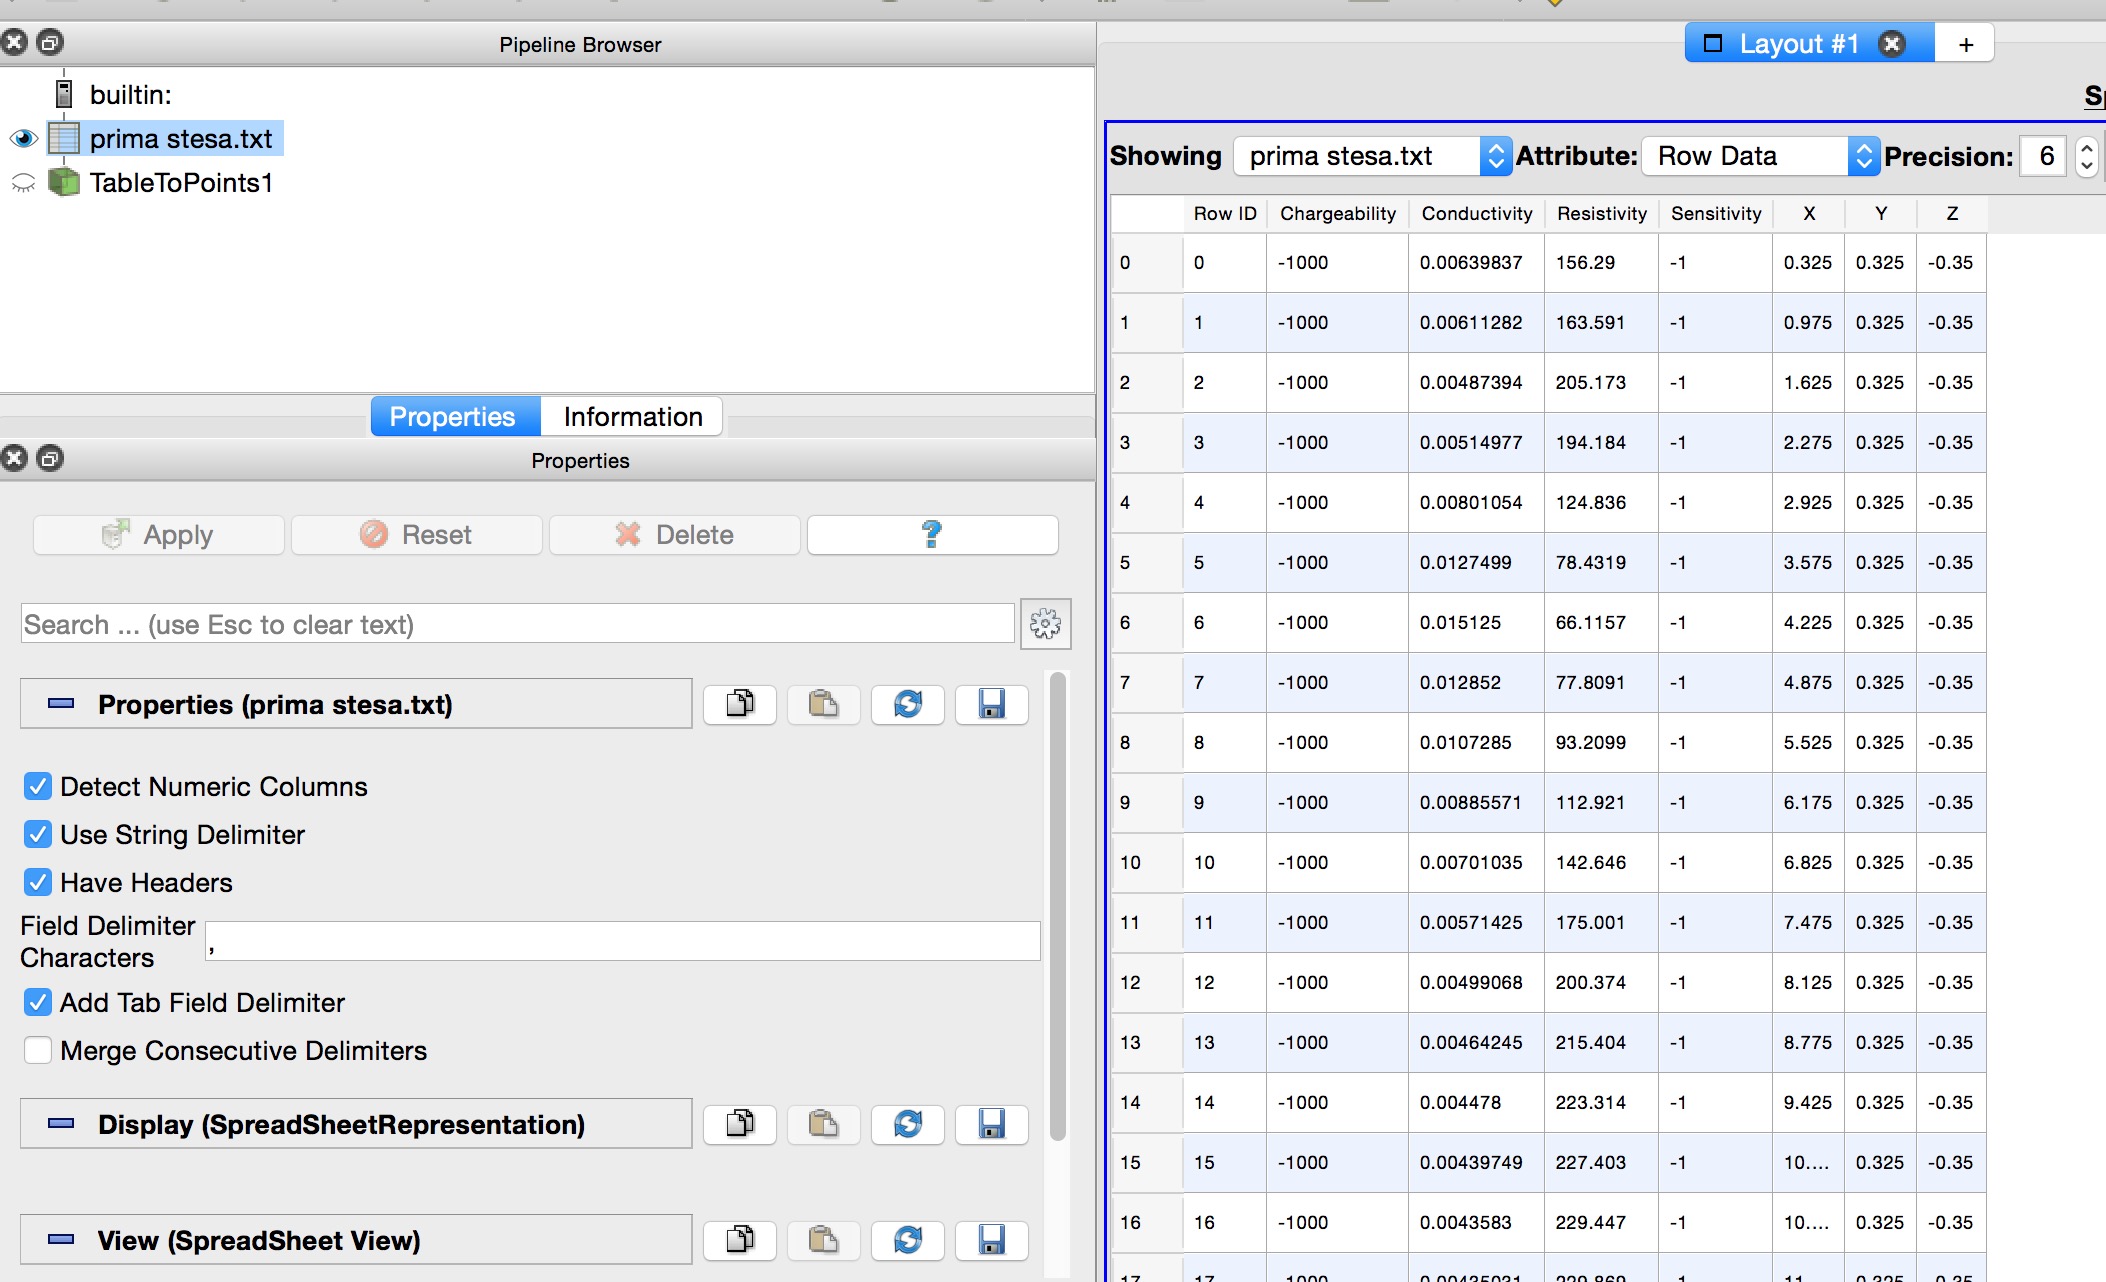
I have a csv data organized like in the first enclosed picture, with resistivity/conducivity data organized in a table.
I have added in my work flow a tableToPoints filter using the values in the conductivity column for the color.
Now, as soon as I try to visualize e possibile surface as shown for instance in this video: https://www.youtube.com/watch?v=UMnIwdQhZE4
I get no result.
here is the relevant picture.
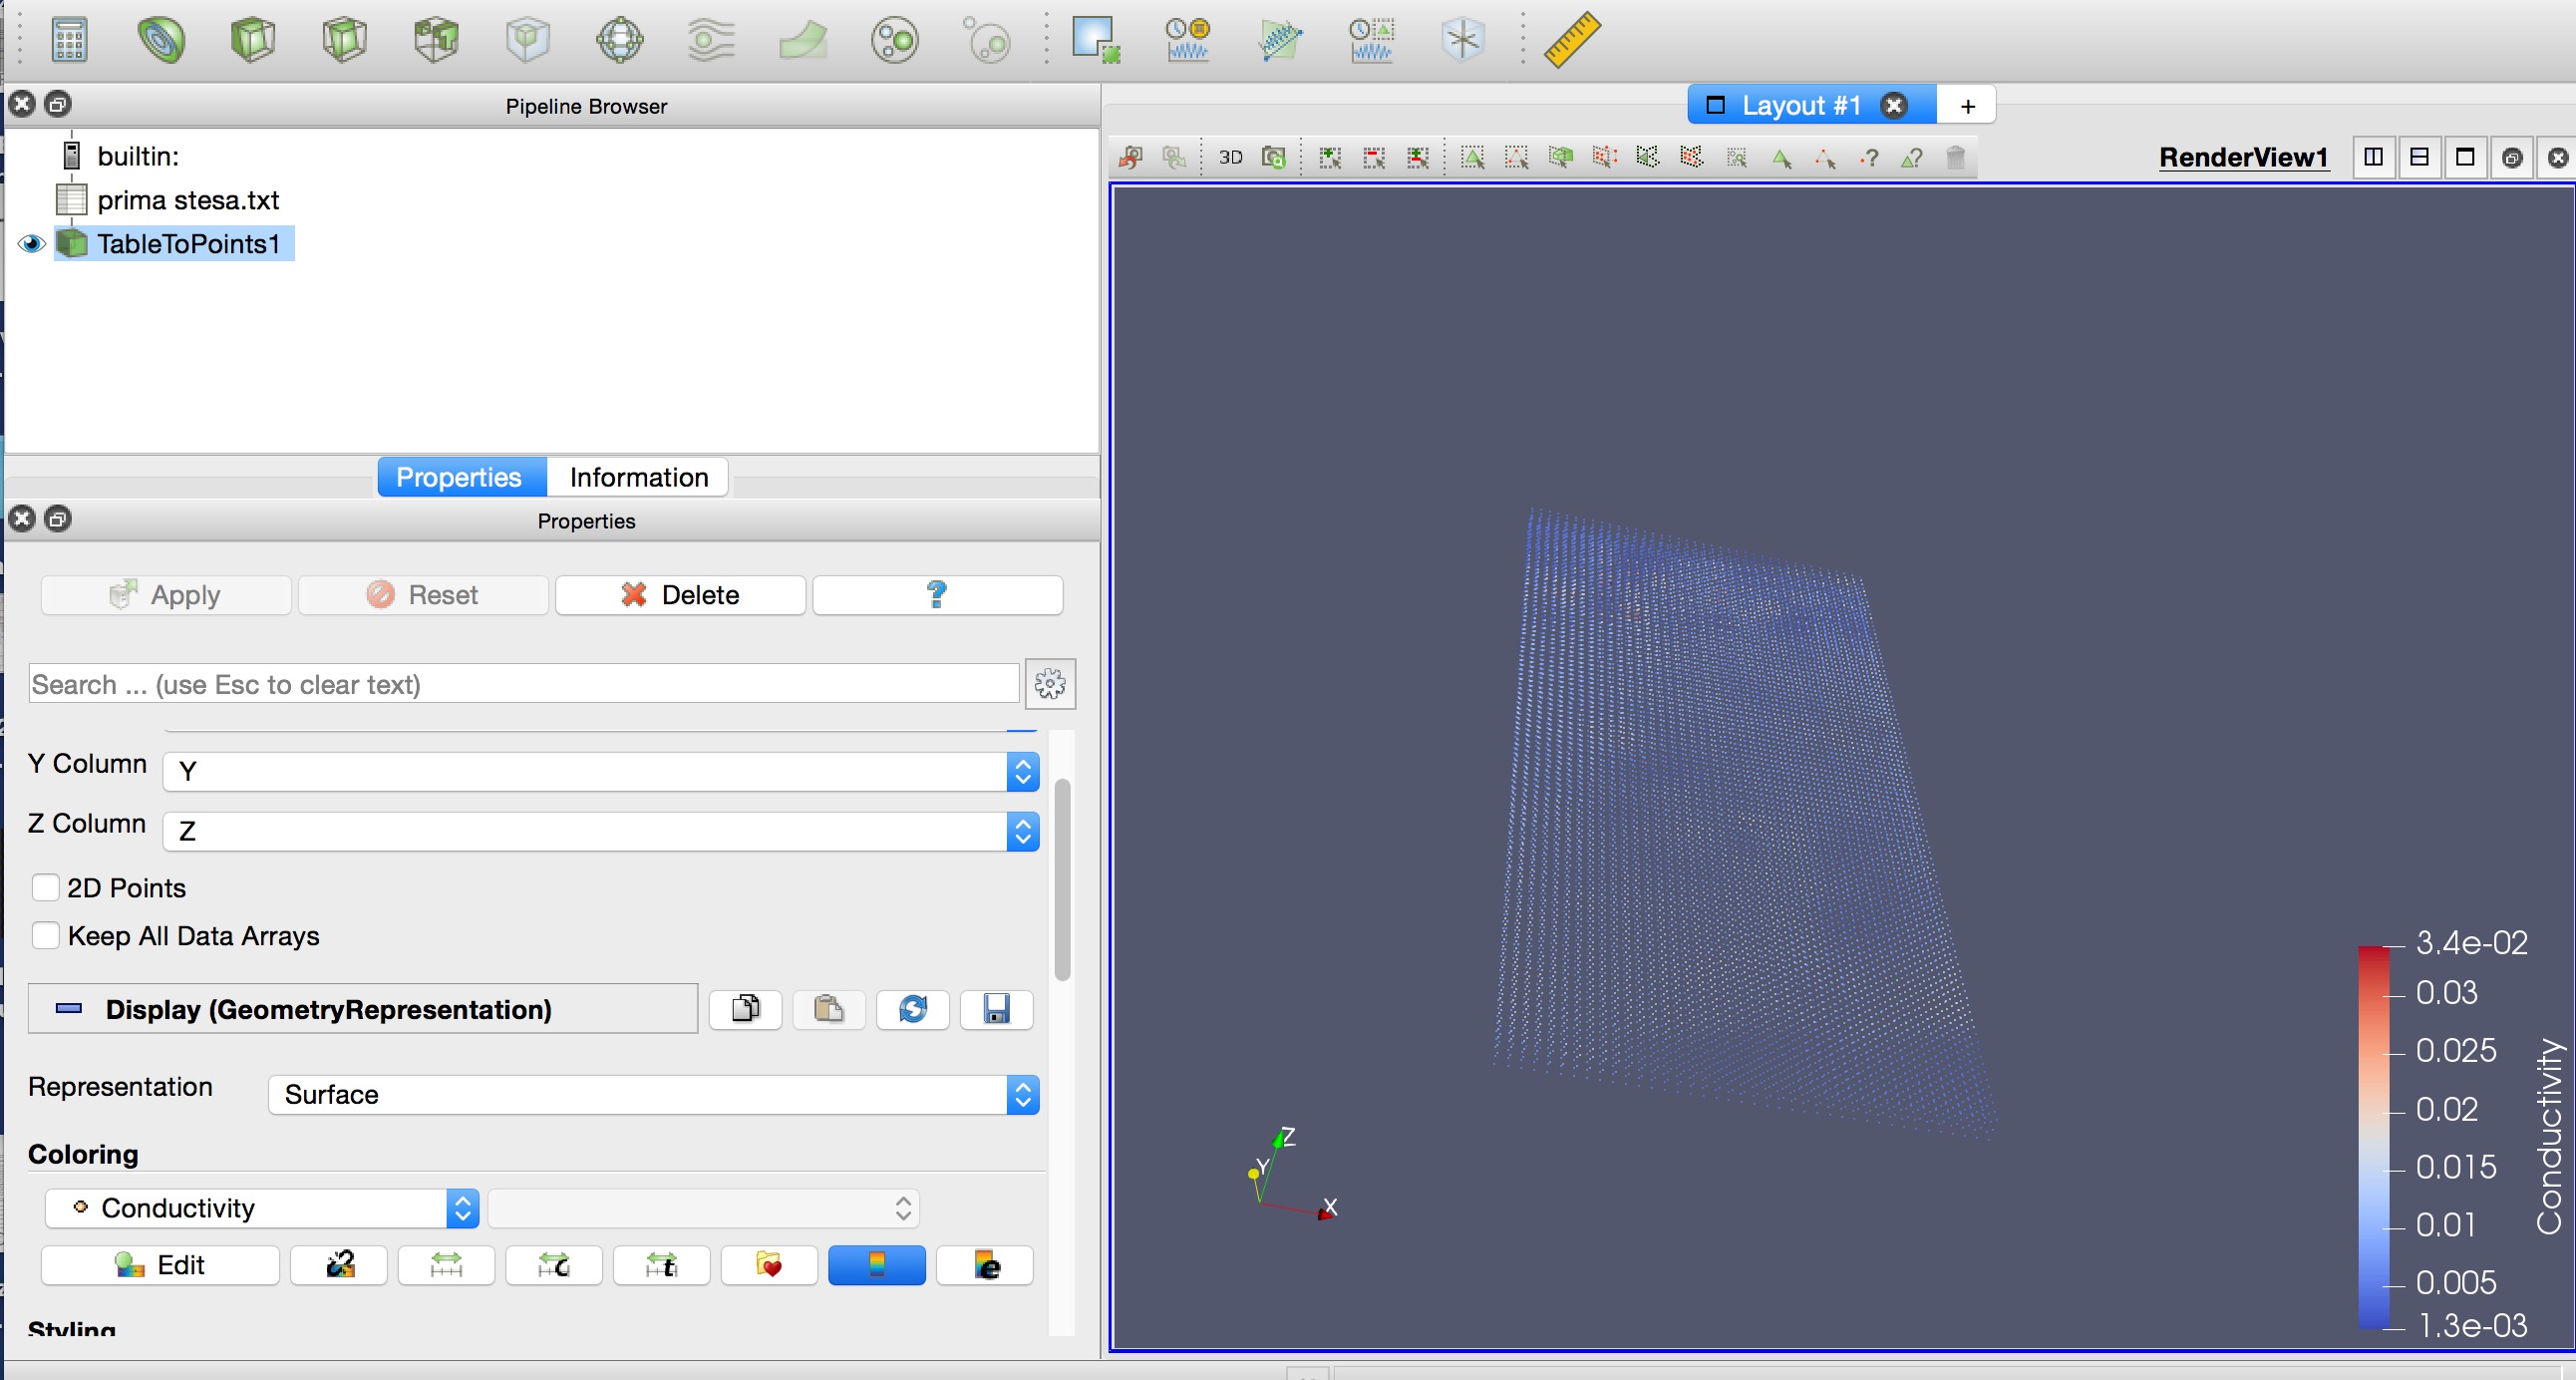
The “Isovolume” or the “contour filter” do not reach the goal.
Is there a filter or a setting I miss ?
as a second step it would be nice if the software would showing the whole range of colours, and it si not, regardless how I rescale the data to a custom range.
Thank you in advance for any explanation and you patience.
---
### Author:  [@cory.quammen](https://discourse.paraview.org/u/cory.quammen)
#### Post date: [March 11, 2019, 9:23pm UTC](https://discourse.paraview.org/t/trasforming-geophisical-data-into-a-3d-mesh/1442/2 "2019-03-11T21:23:59Z")
Instead of **Table to Points** , try **Table to Structured Grid** instead. That will produce a volumetric data set instead of a set of unconnected points.
---
### Author:  [@banesullivan](https://discourse.paraview.org/u/banesullivan)
#### Post date: [March 12, 2019, 5:40am UTC](https://discourse.paraview.org/t/trasforming-geophisical-data-into-a-3d-mesh/1442/3 "2019-03-12T05:40:51Z")
In case your points aren’t ordered, you could also check out a filter I built for [`PVGeo`](http://pvgeo.org) to recover uniform-ish grids from points sets: After installation, its available throught the filters menu in ParaView as the **Voxelize Points** filter. [Here are the docs for it](http://pvgeo.org/examples/filters-general/voxelize-points/) which are currently lacking a good ParaView example
---
### Author:  [@ubi\_laptop](https://discourse.paraview.org/u/ubi_laptop)
#### Post date: [March 13, 2019, 12:47pm UTC](https://discourse.paraview.org/t/trasforming-geophisical-data-into-a-3d-mesh/1442/4 "2019-03-13T12:47:55Z")
thank you Cory, I’ve tried your suggestion, but I get the error in the enclosed picture.
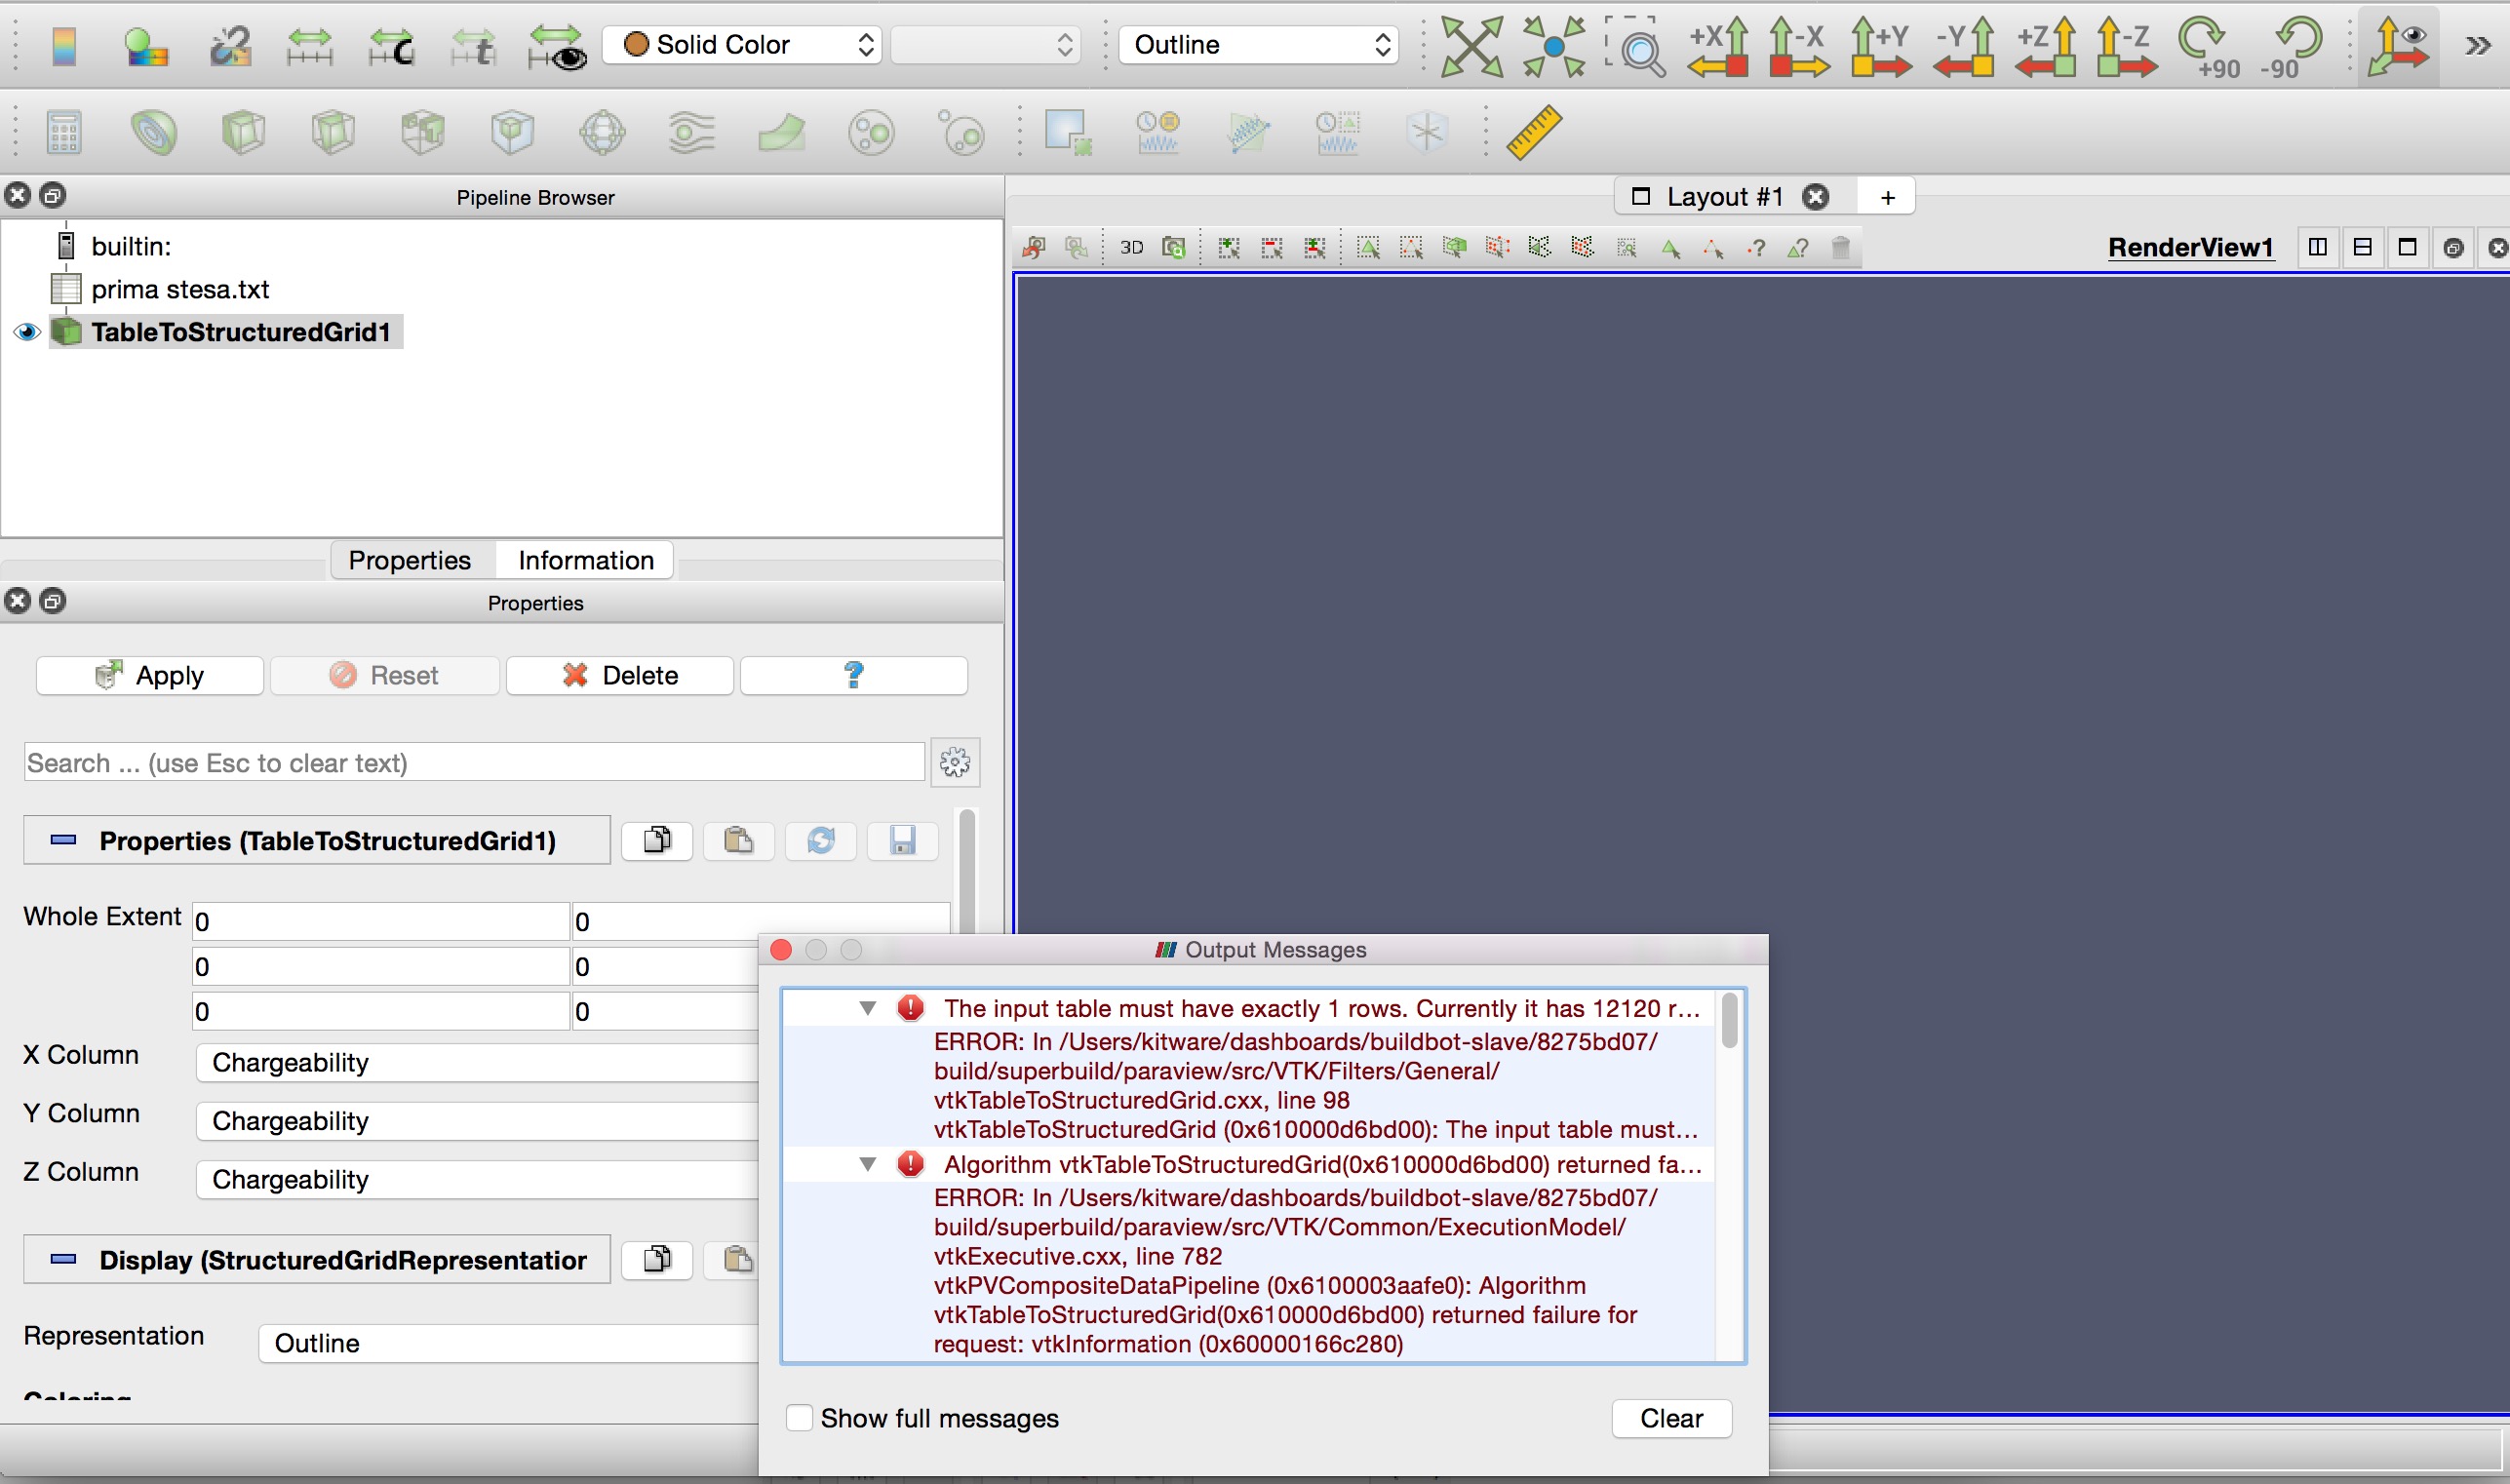
On the other side, Idid try “tabletopoints” filter, scaled the color values for the points, and after that a “3Ddelaunay” filter, and then a top a “isovolume” and it works more or less, except the resolution is not fine enough. Please see the enclosed picture:
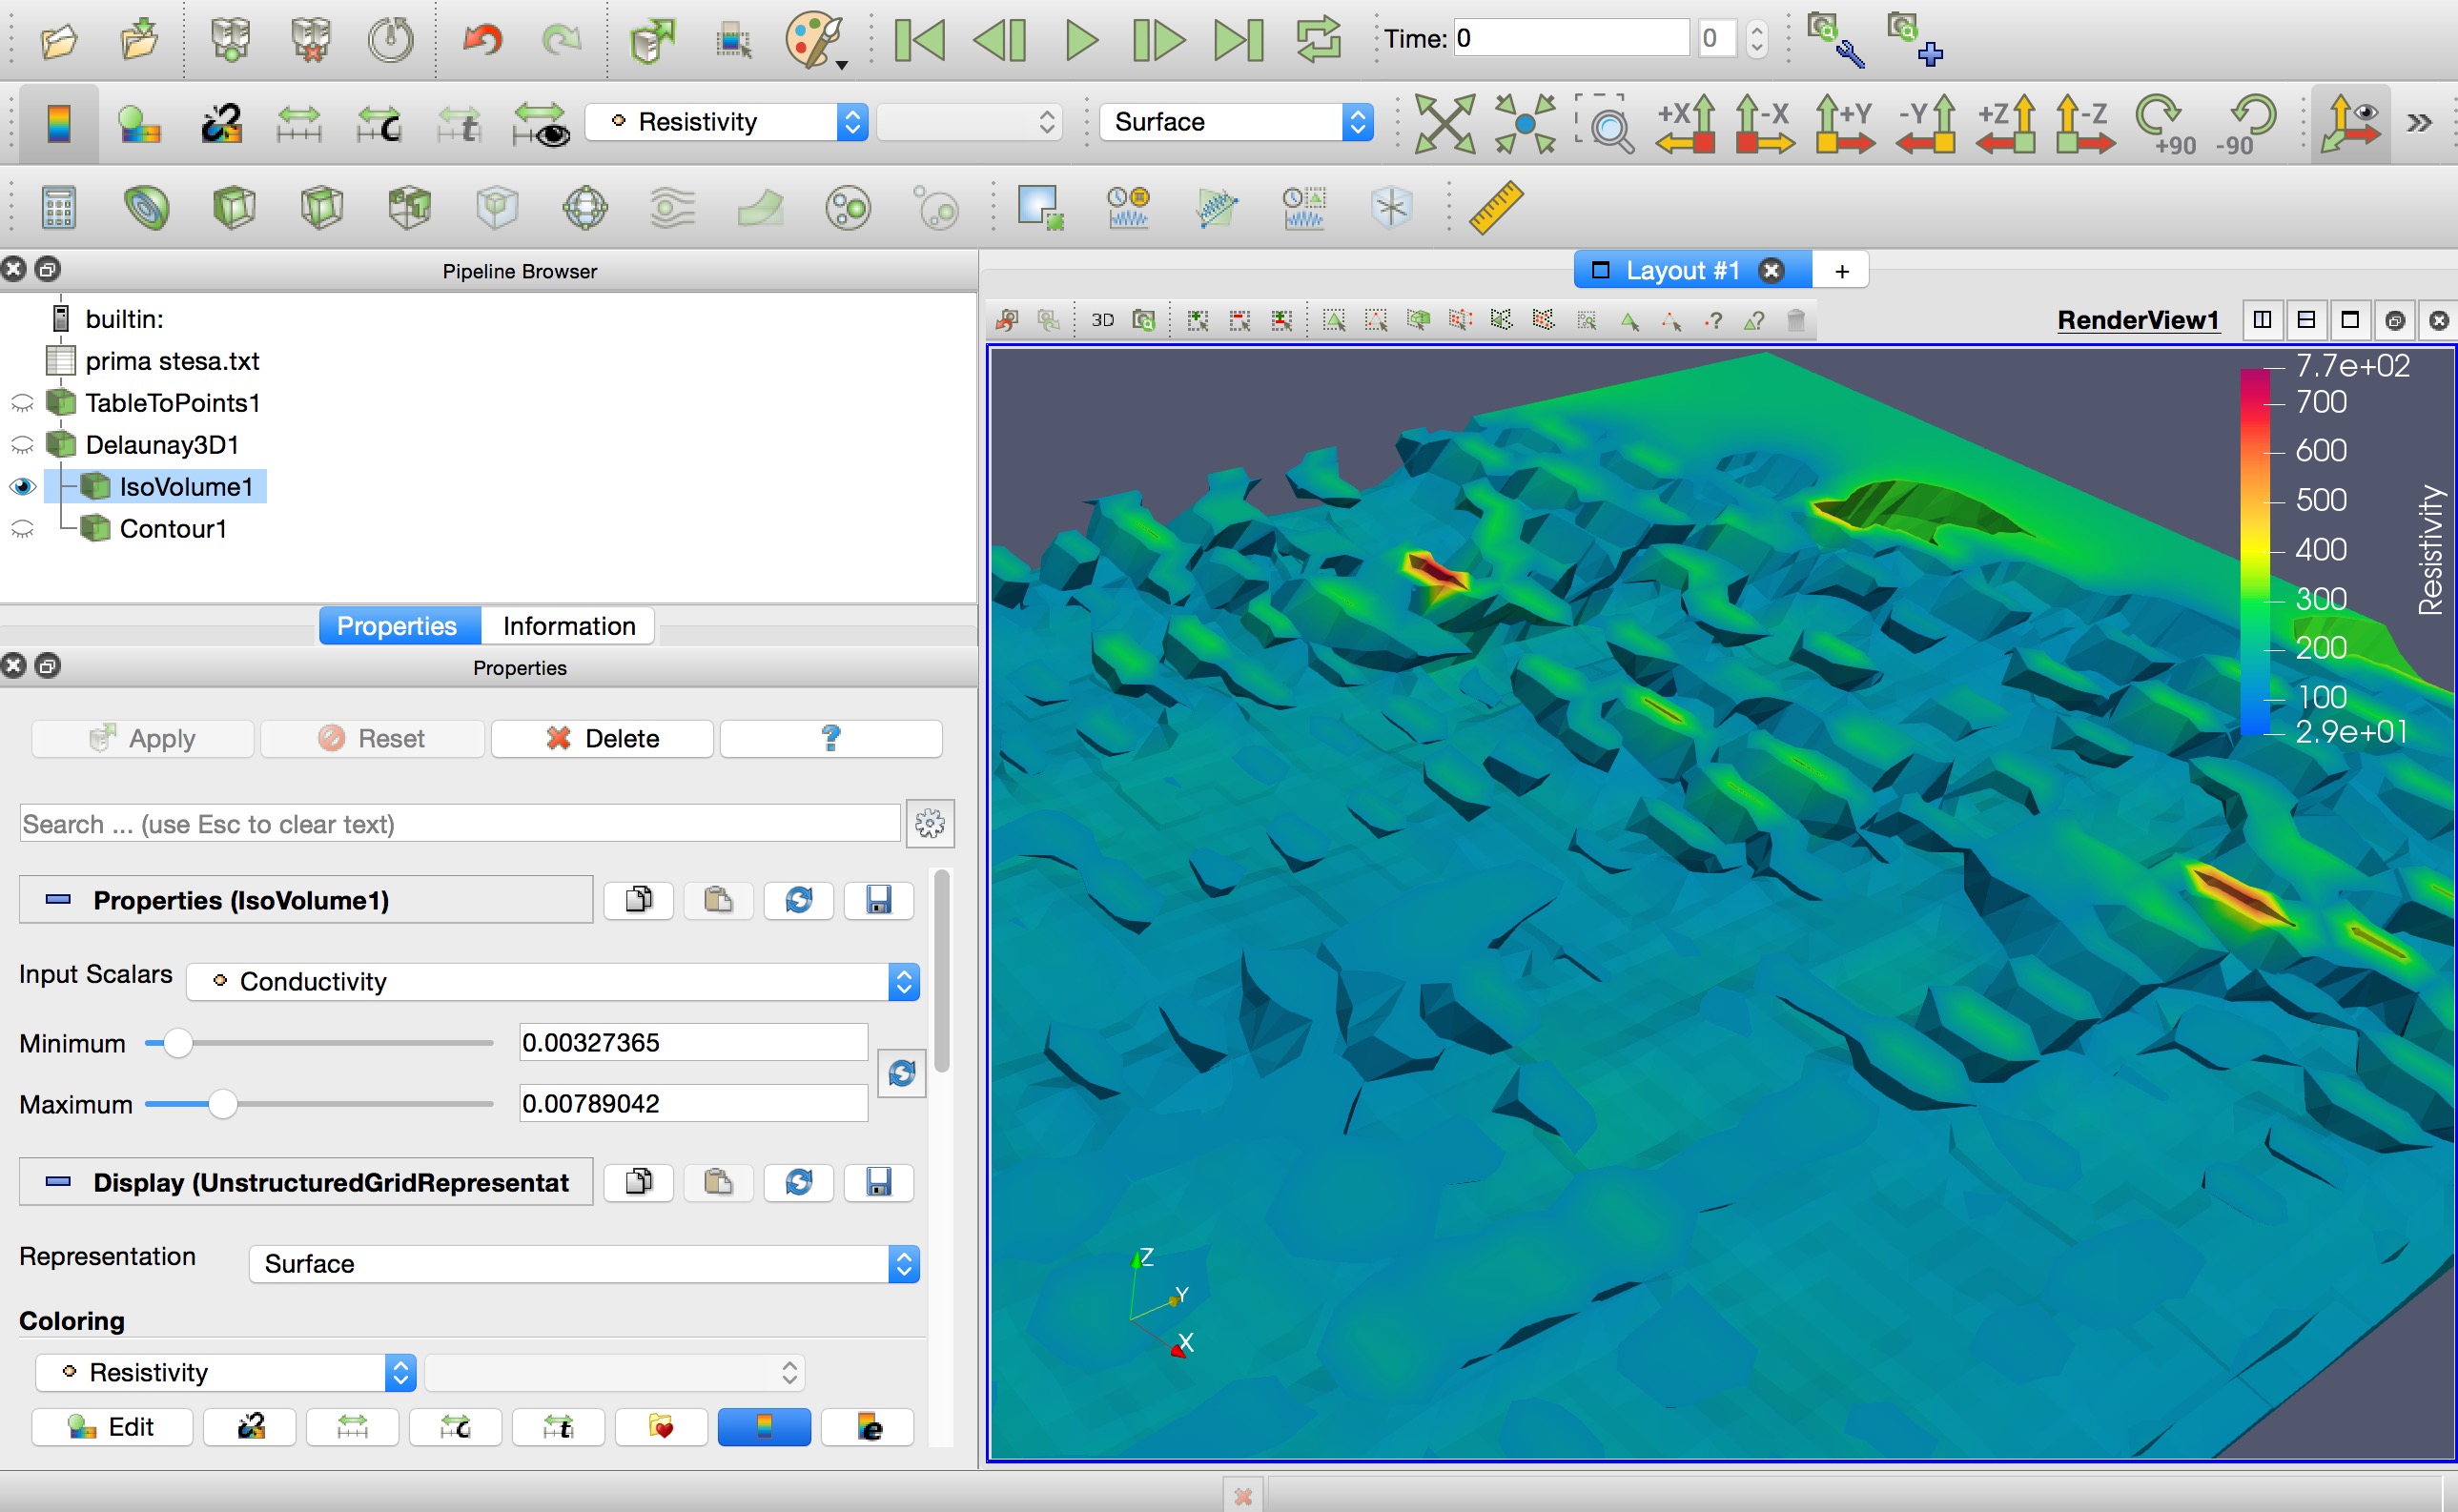. Im searching now to a way to improve the resolution, maybe interpolating the values of the grid, and how to better export it as a geometry. Any suggestion is more than welcome.
---
### Author:  [@ubi\_laptop](https://discourse.paraview.org/u/ubi_laptop)
#### Post date: [March 13, 2019, 12:57pm UTC](https://discourse.paraview.org/t/trasforming-geophisical-data-into-a-3d-mesh/1442/5 "2019-03-13T12:57:46Z")
Thank ypu Bane. You may also take a look to my previous answer for Cory. About your filter for PVGeo, seems very promising. I’m not sure i’m skilled enough to set up all these on my macbook, but I’ll try, starting with anaconda.
---
### Author:  [@cory.quammen](https://discourse.paraview.org/u/cory.quammen)
#### Post date: [March 14, 2019, 3:17am UTC](https://discourse.paraview.org/t/trasforming-geophisical-data-into-a-3d-mesh/1442/6 "2019-03-14T03:17:58Z")
With the **Table to Structured Grid** filter, you’ll need to set the _Whole Extent_ property as well. The first two line edits are the starting index (usually 0) and maximum index in the X direction, the two line edits in the next row are the same, but for Y, and the third row is for Z. So if your grid’s size (in points) is R in X, S in Y, and T in Z, set the whole extent to
0, R-1
0, S-1
0, T-1
---
### Author:  [@ubi\_laptop](https://discourse.paraview.org/u/ubi_laptop)
#### Post date: [March 14, 2019, 8:54am UTC](https://discourse.paraview.org/t/trasforming-geophisical-data-into-a-3d-mesh/1442/7 "2019-03-14T08:54:16Z")
thank you again, I appreciate your answer, but I’m sorry I’m too poor in math !
a google search lead to this: [https://stackoverflow.com/questions/29719796/how-to-converting-by-using-table-to-structed-grid-on-paraview](https://stackoverflow.com/questions/29719796/how-to-converting-by-using-table-to-structed-grid-on-paraview) but did not clarify to subject to me. for instance, I can’t input a letter “R” as a “whole extents” property, but just a number.
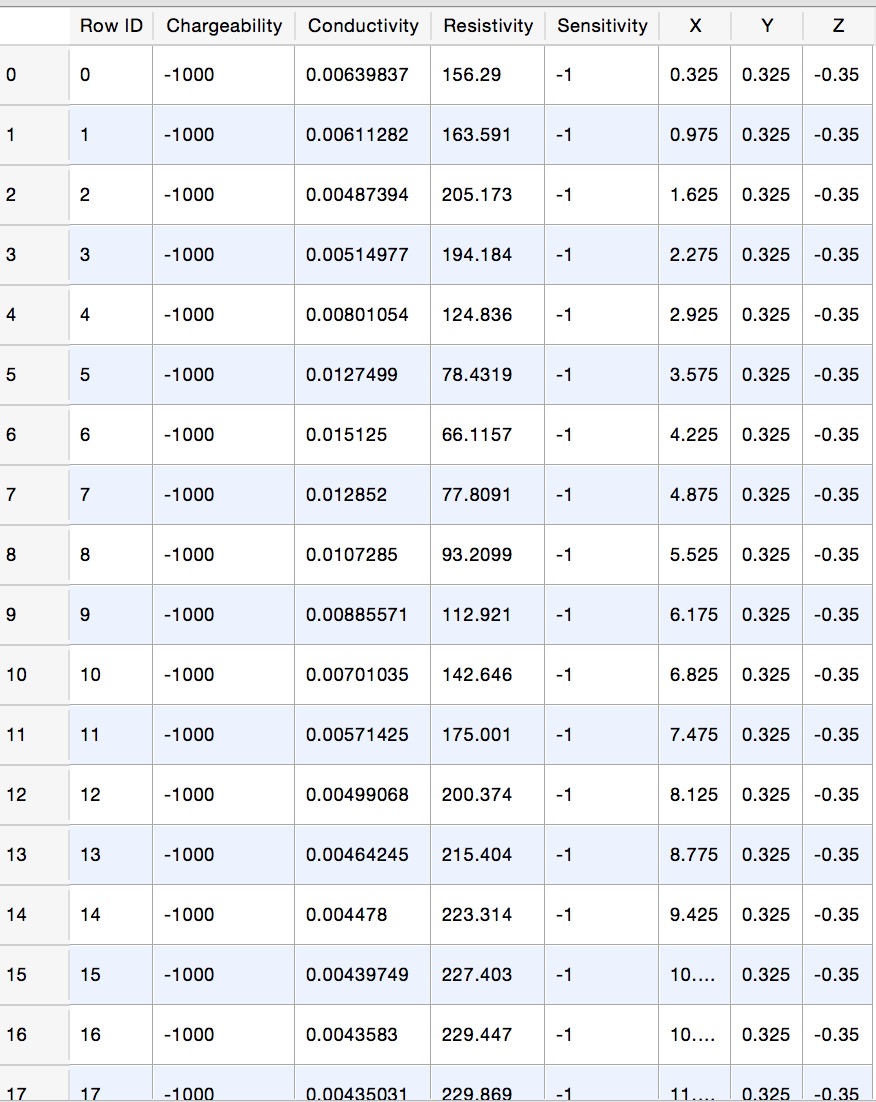
Please find enclosed a screenshot of my grid, and It would be great if you may suggest the correct edit.
thank you in advance!
ps. I did try many combination, as also suggested here:
[https://paraview.paraview.narkive.com/PVNkFNDs/data-structure-for-table-to-structured-grid-filter](https://paraview.paraview.narkive.com/PVNkFNDs/data-structure-for-table-to-structured-grid-filter) but did not work. My grid has 12200 points, as you may see grafically and and as a table in enclosed pictures.
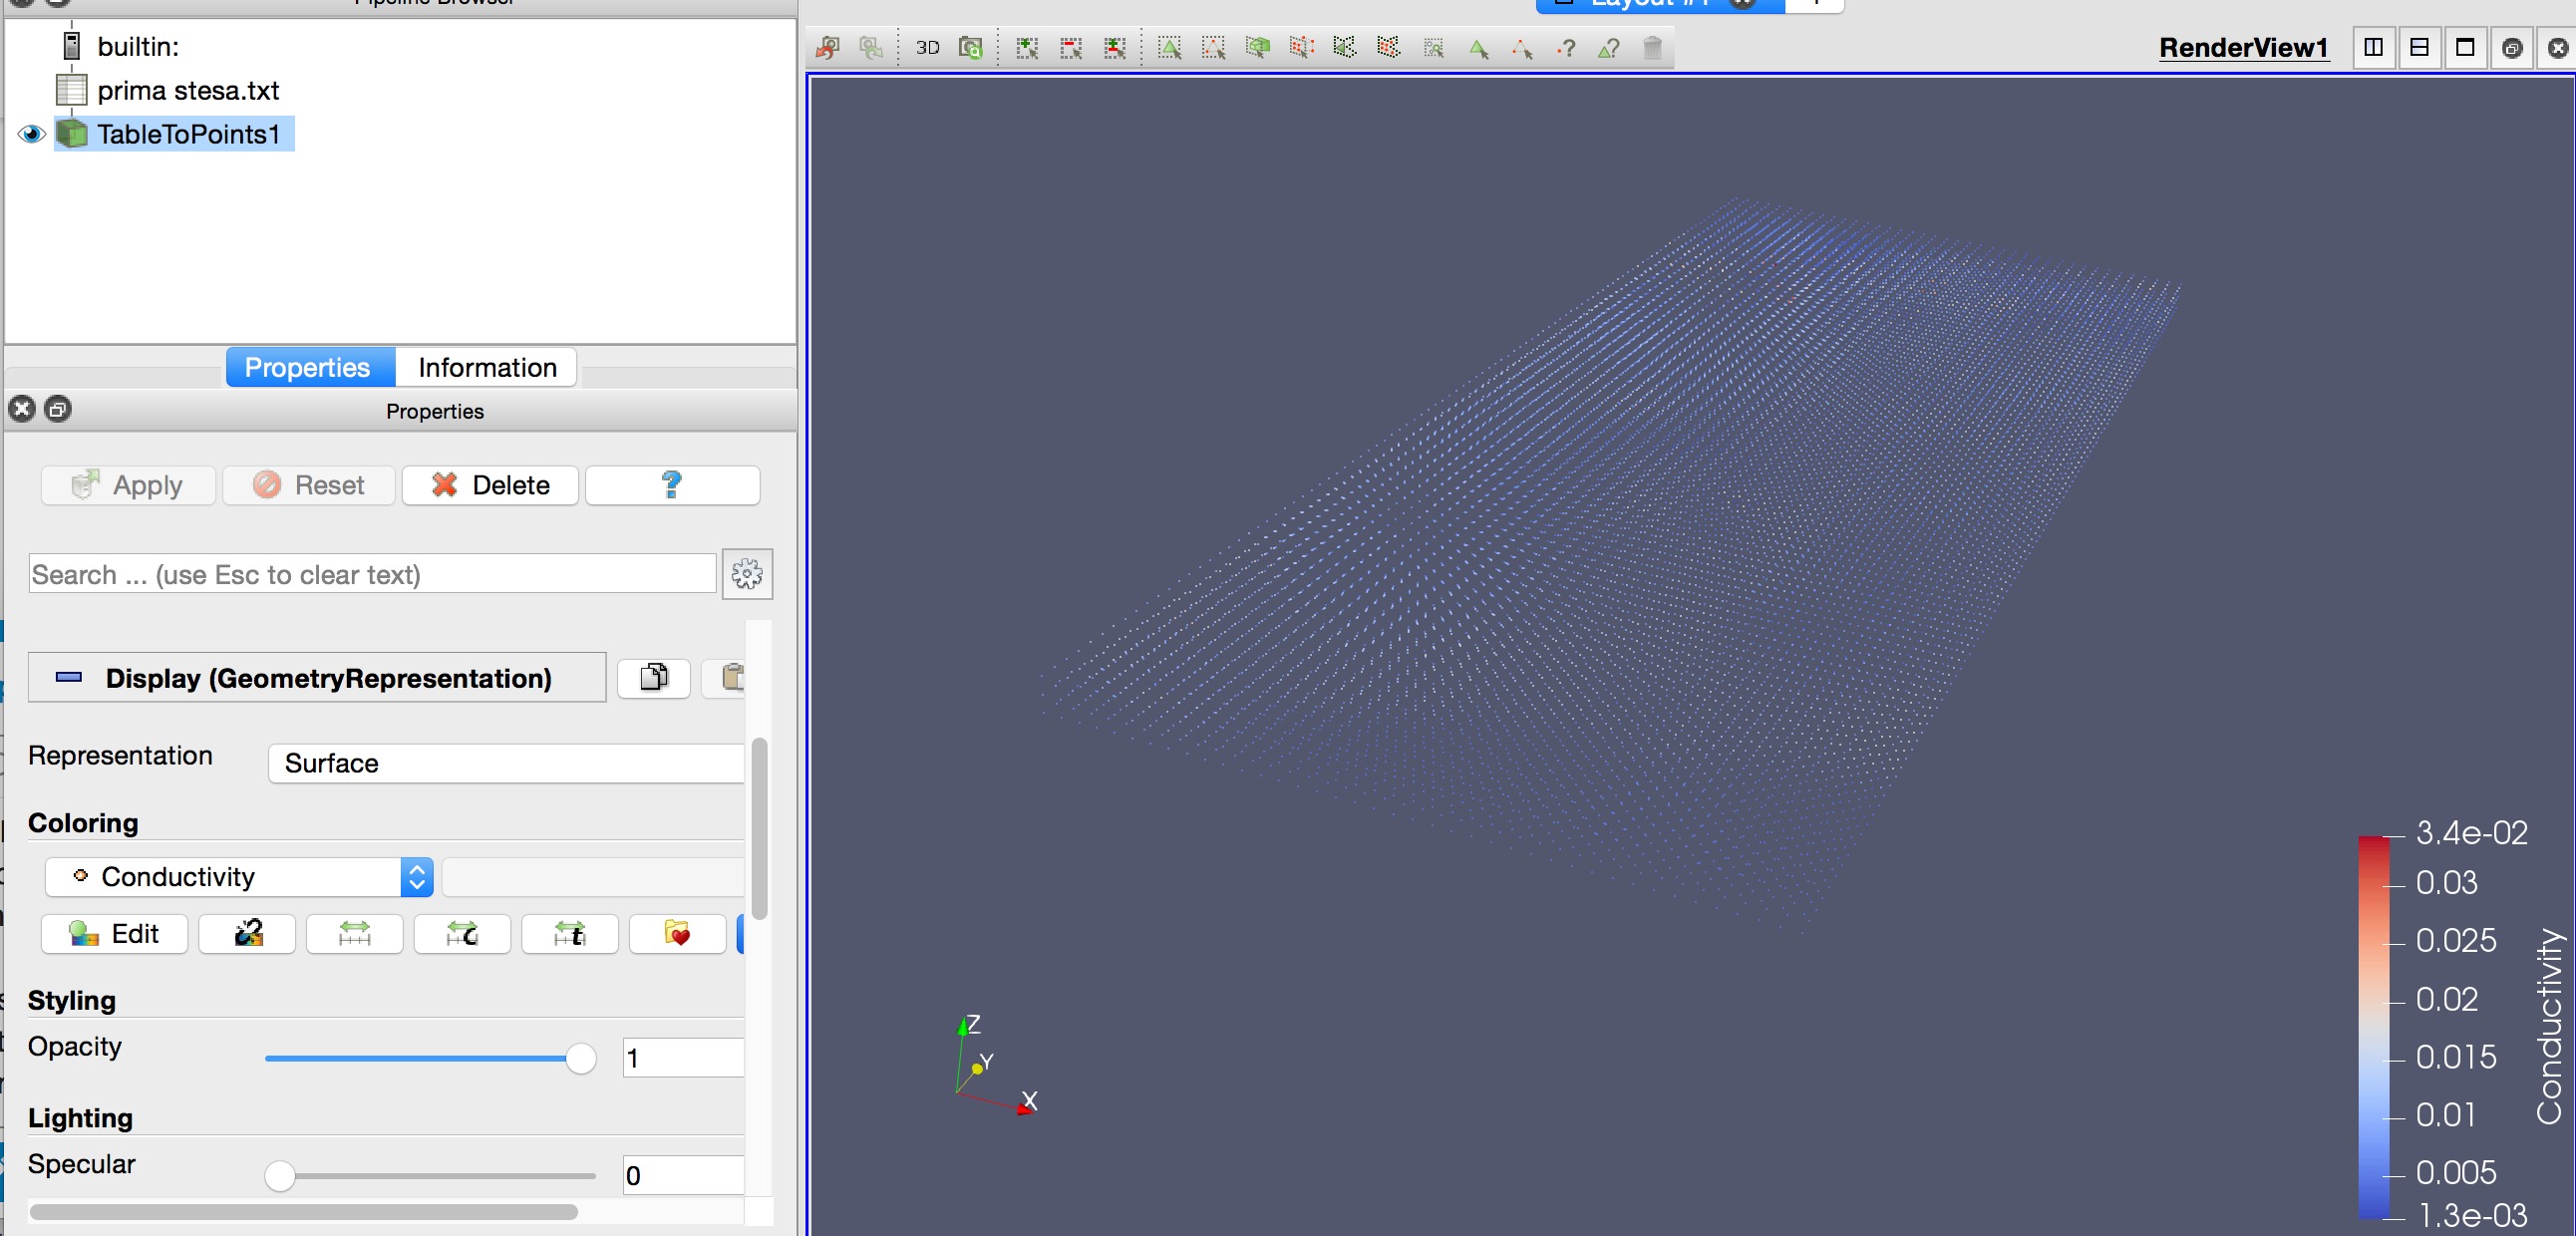

---
### Author:  [@cory.quammen](https://discourse.paraview.org/u/cory.quammen)
#### Post date: [March 14, 2019, 1:21pm UTC](https://discourse.paraview.org/t/trasforming-geophisical-data-into-a-3d-mesh/1442/8 "2019-03-14T13:21:30Z")
Sorry, let me be more specific. If your grid is 200 points in X, 300 points in Y, and 400 points in Z, then your _Whole Extent_ should be
0 199
0 299
0 399
Does that make sense? Basically the first column should be zeroes, and the second column should be one less than the size of the grid in that dimension.
---
### Author:  [@ubi\_laptop](https://discourse.paraview.org/u/ubi_laptop)
#### Post date: [March 14, 2019, 11:51pm UTC](https://discourse.paraview.org/t/trasforming-geophisical-data-into-a-3d-mesh/1442/9 "2019-03-14T23:51:07Z")
Thany again Cory, I suppose my table has 40 point in X, 101 in Y and 3 in Z. So I did set accordling the filter, and I get no error.
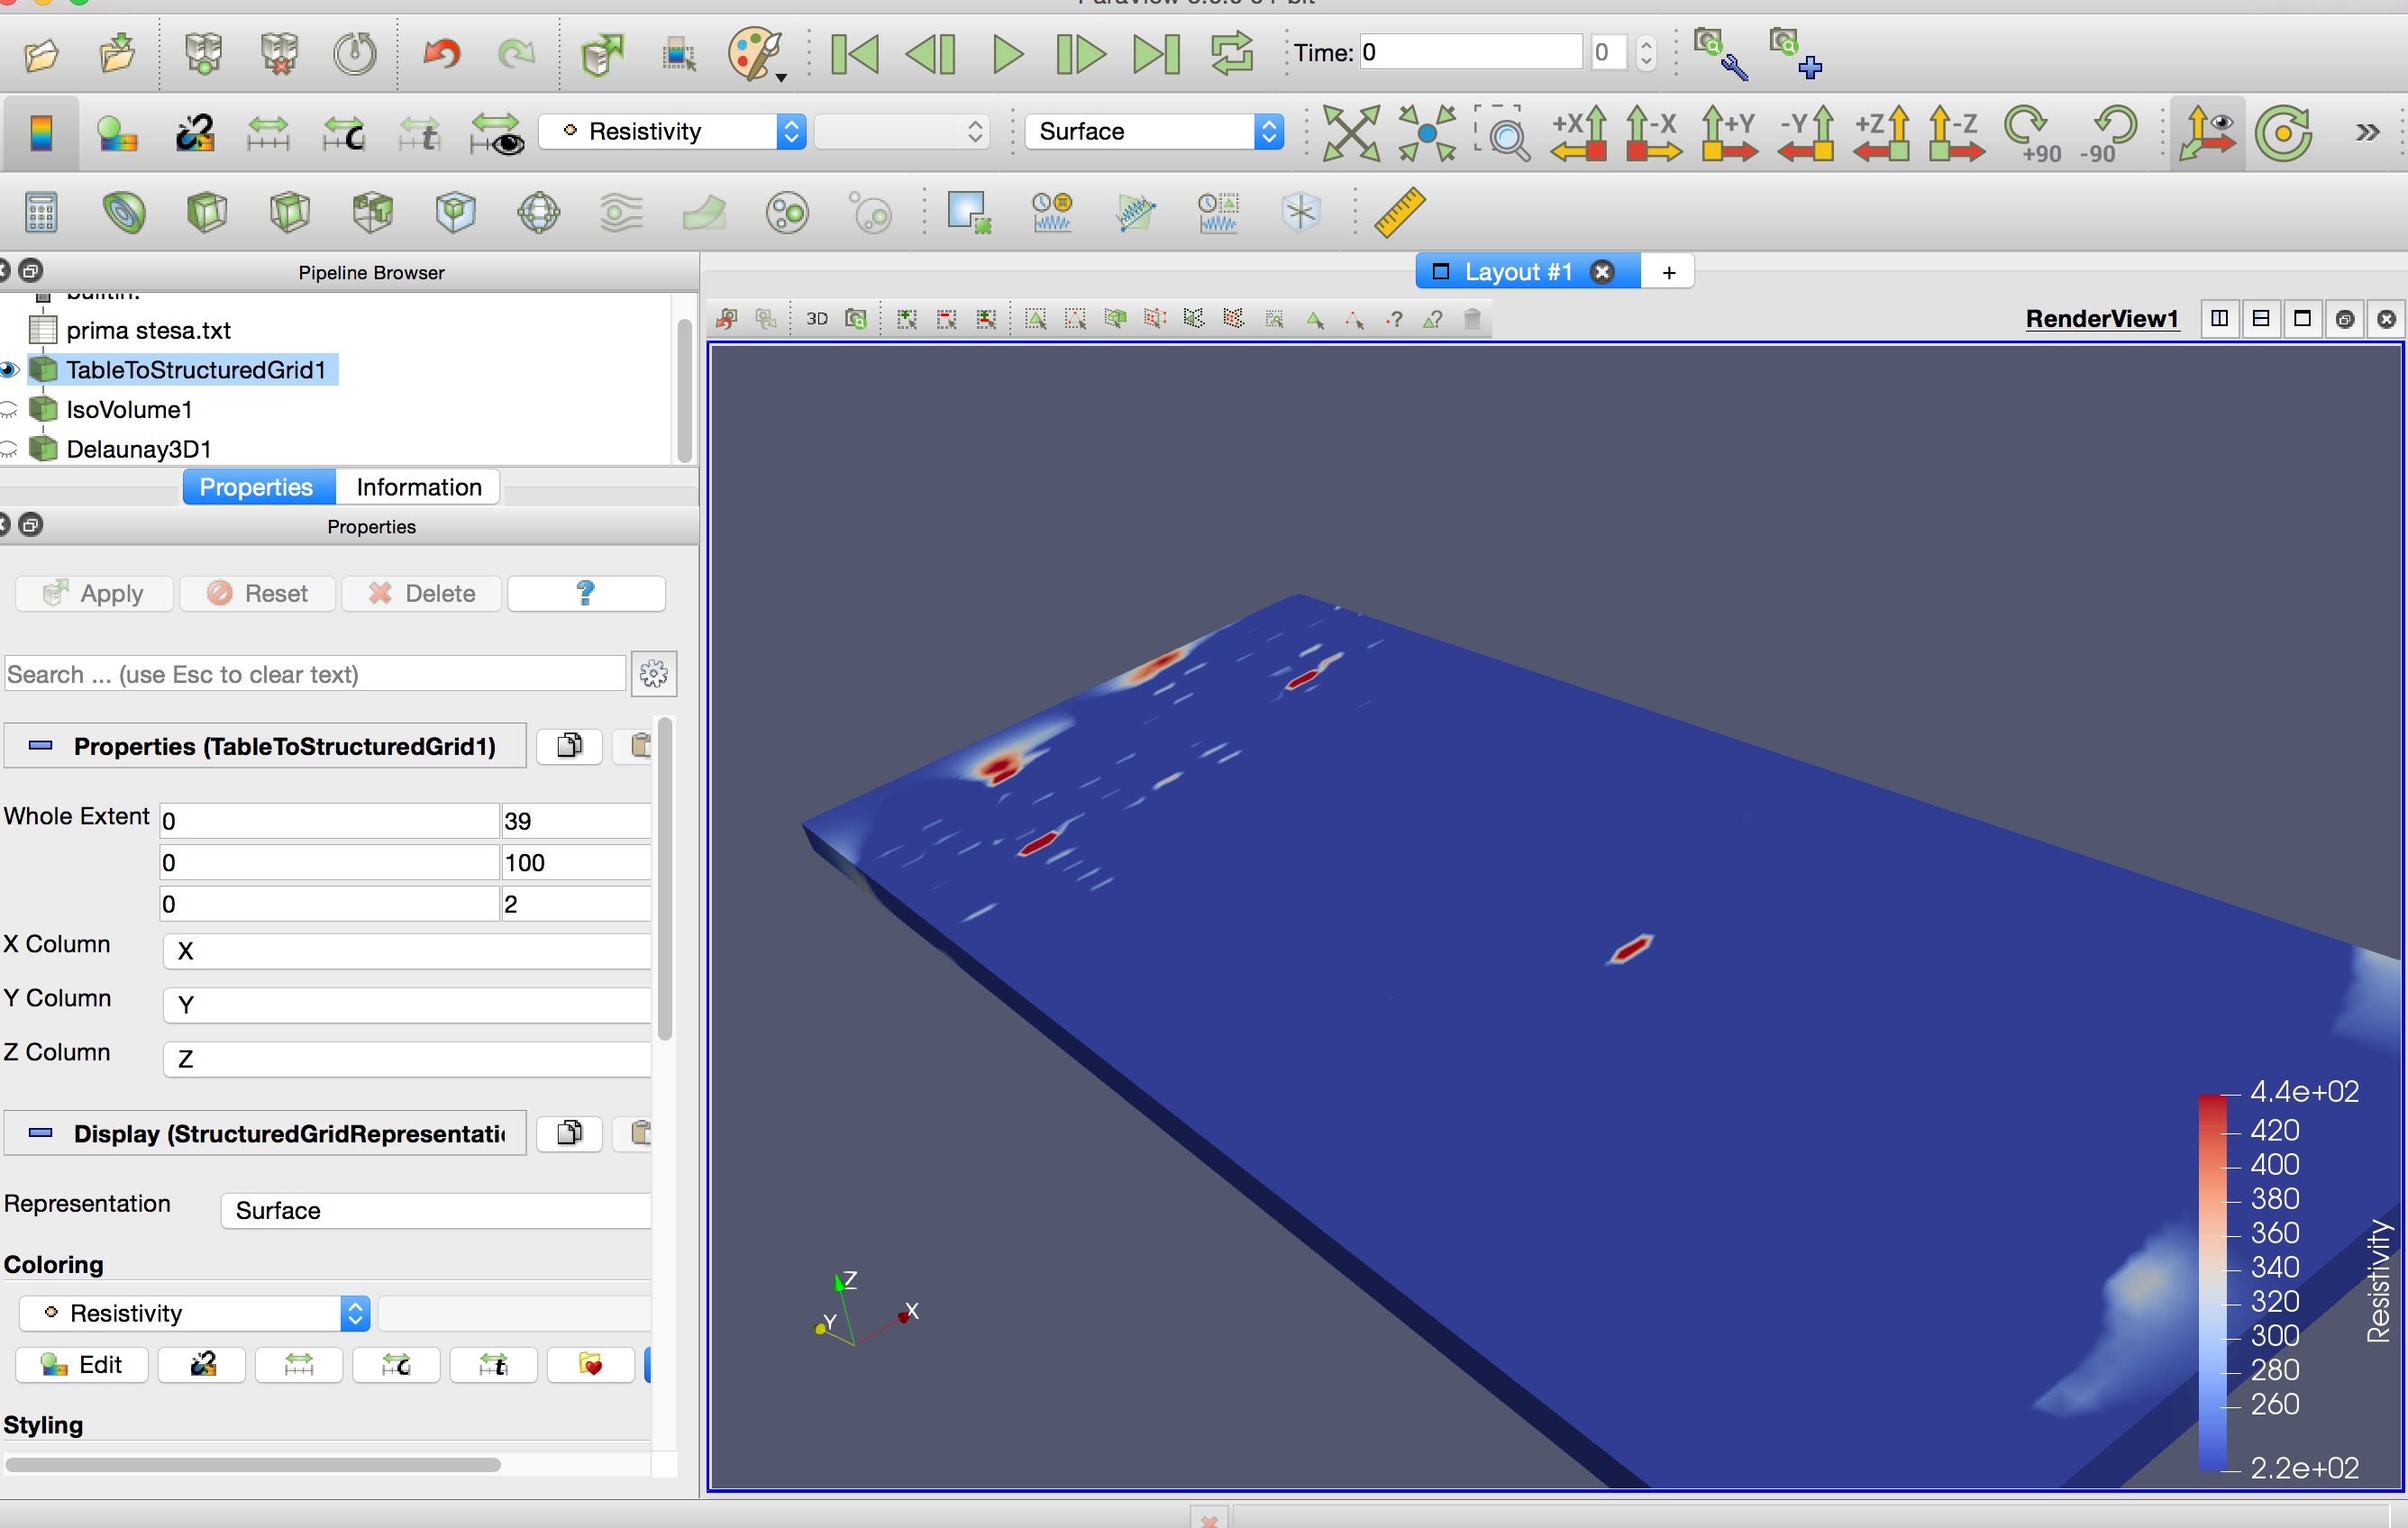
So a big THANK YOU for your answer!
Aftert that, you may want to help me further, I need a finer resolution of the geometry.
As I do apply the Isovolume filter to get the virtually reconstructed surfaces, but the resolution seems not better than with the other way, “tabletopoints” filter. You may compare the two results in the enclosed pictures (Isovolume 1 is via the “tabletostructuredgrid” filter, Isovolume 2 is via the “tabletopoints” filter)
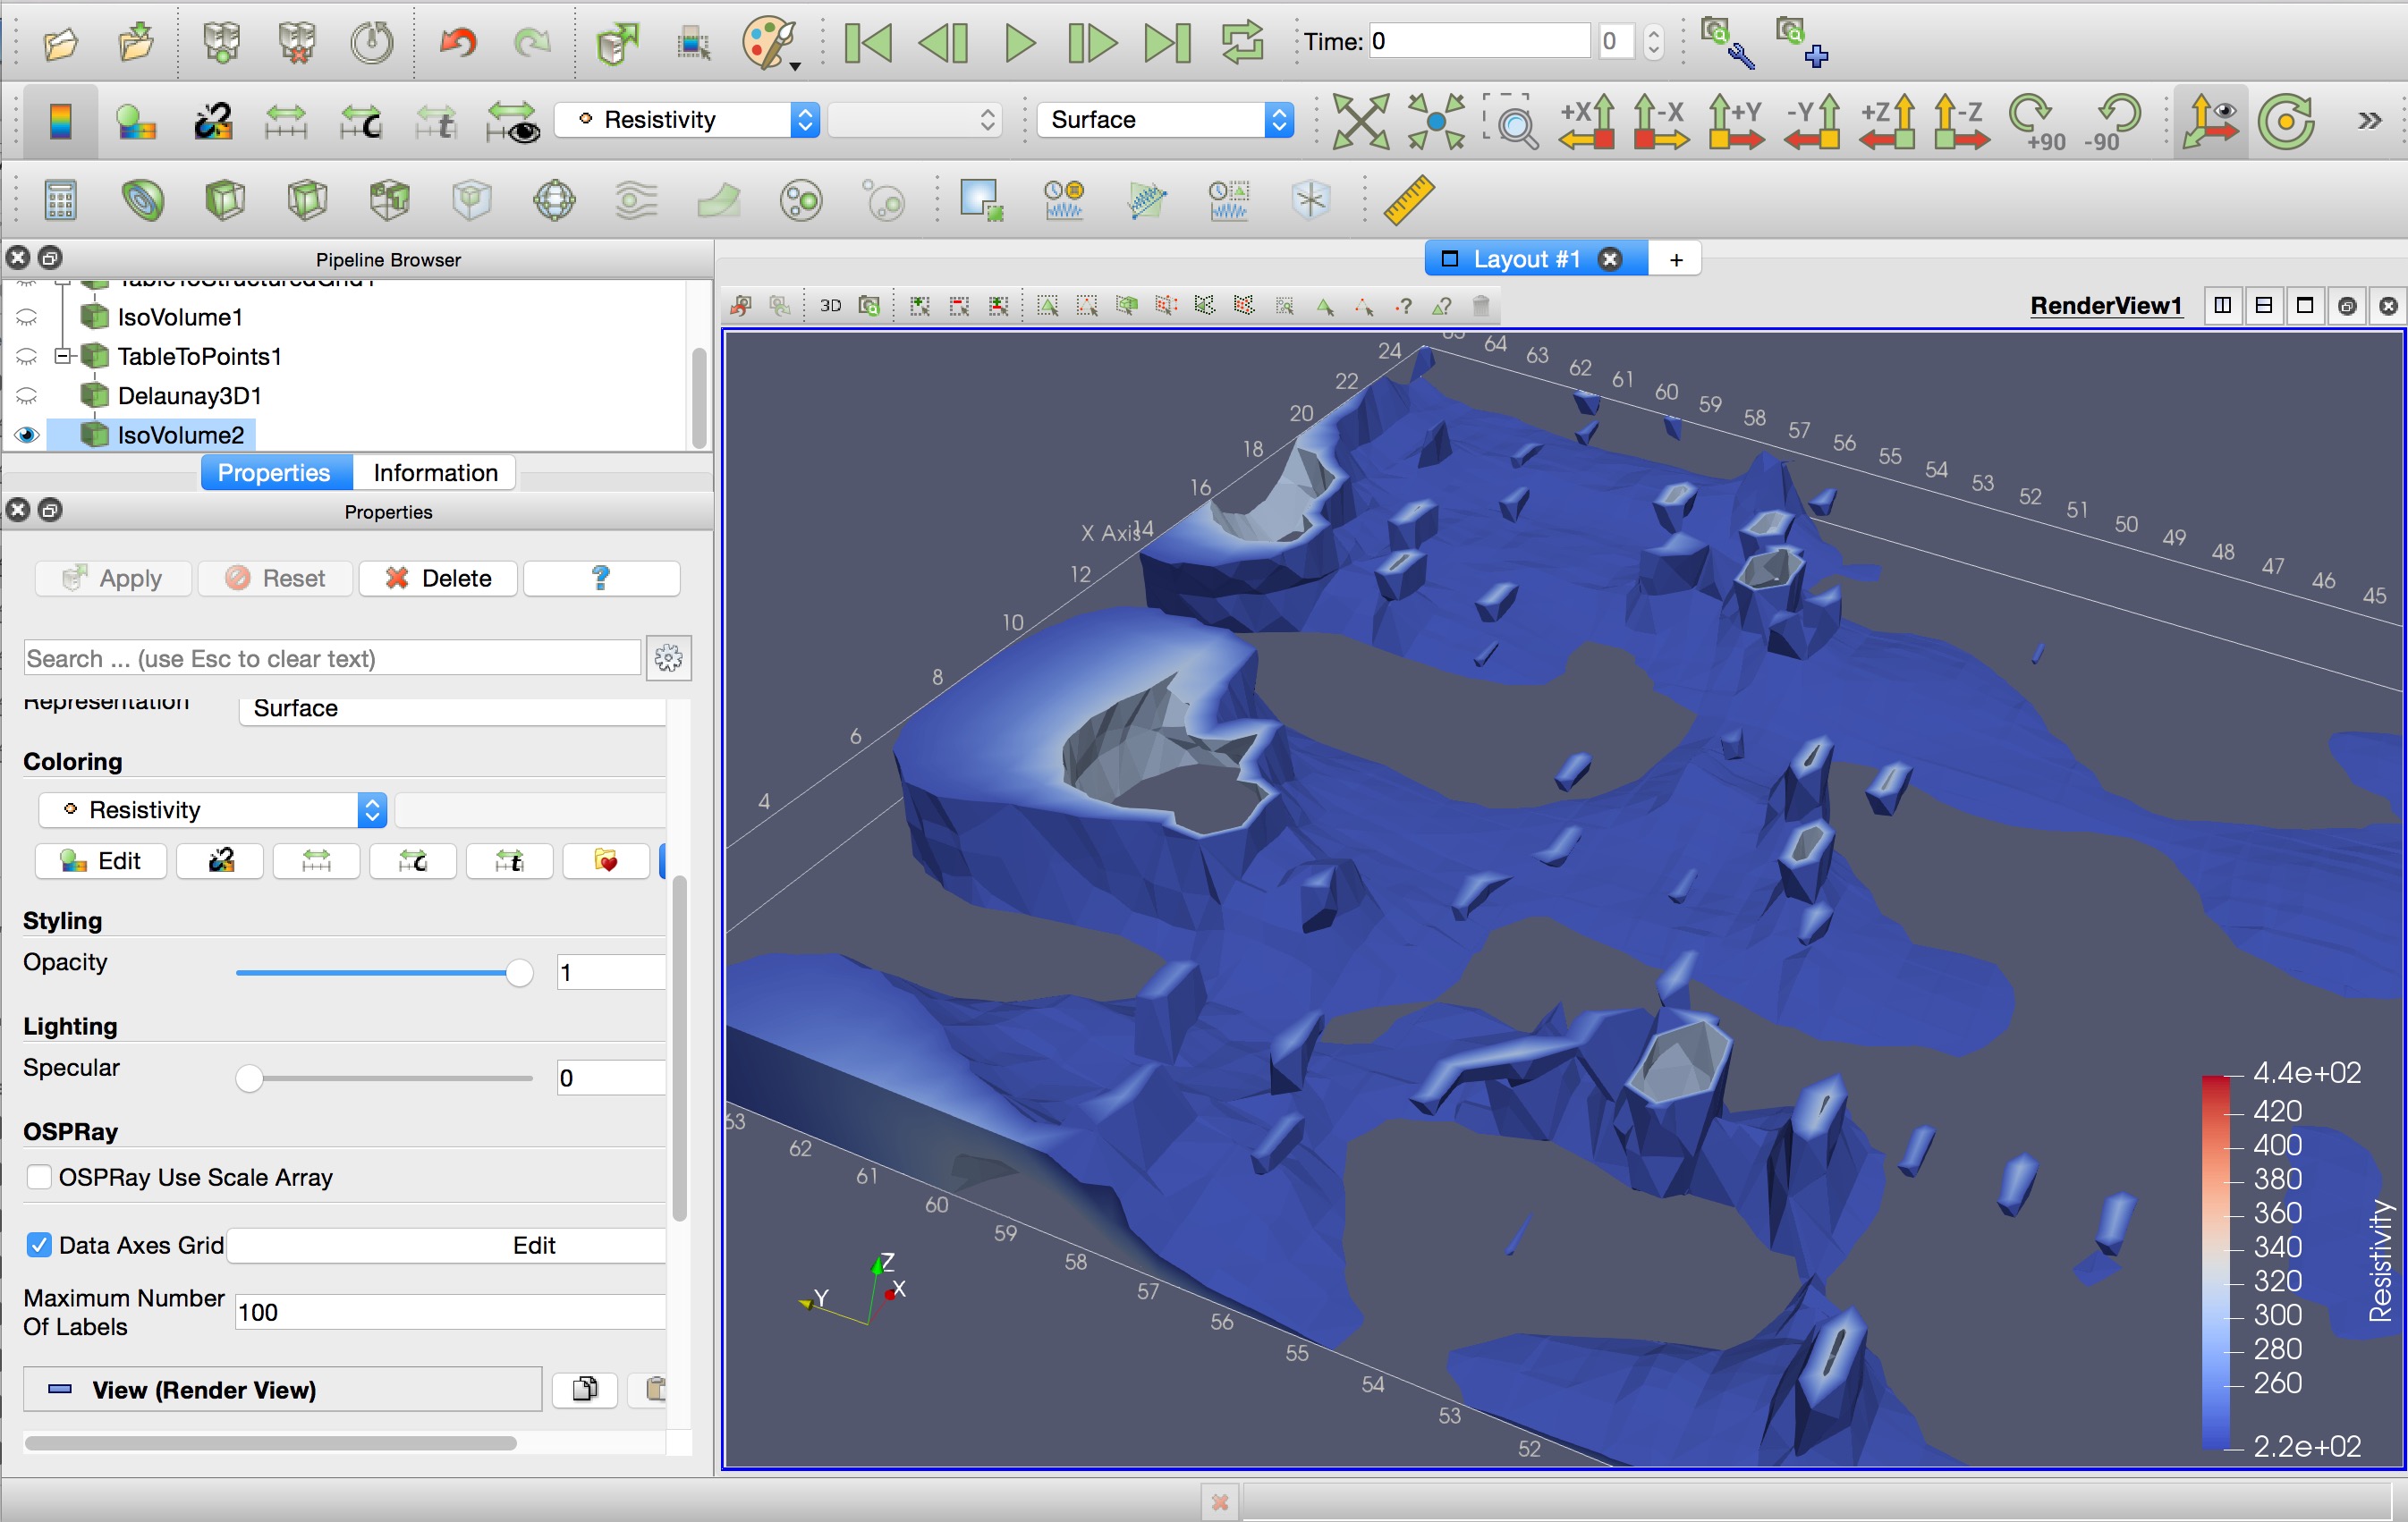
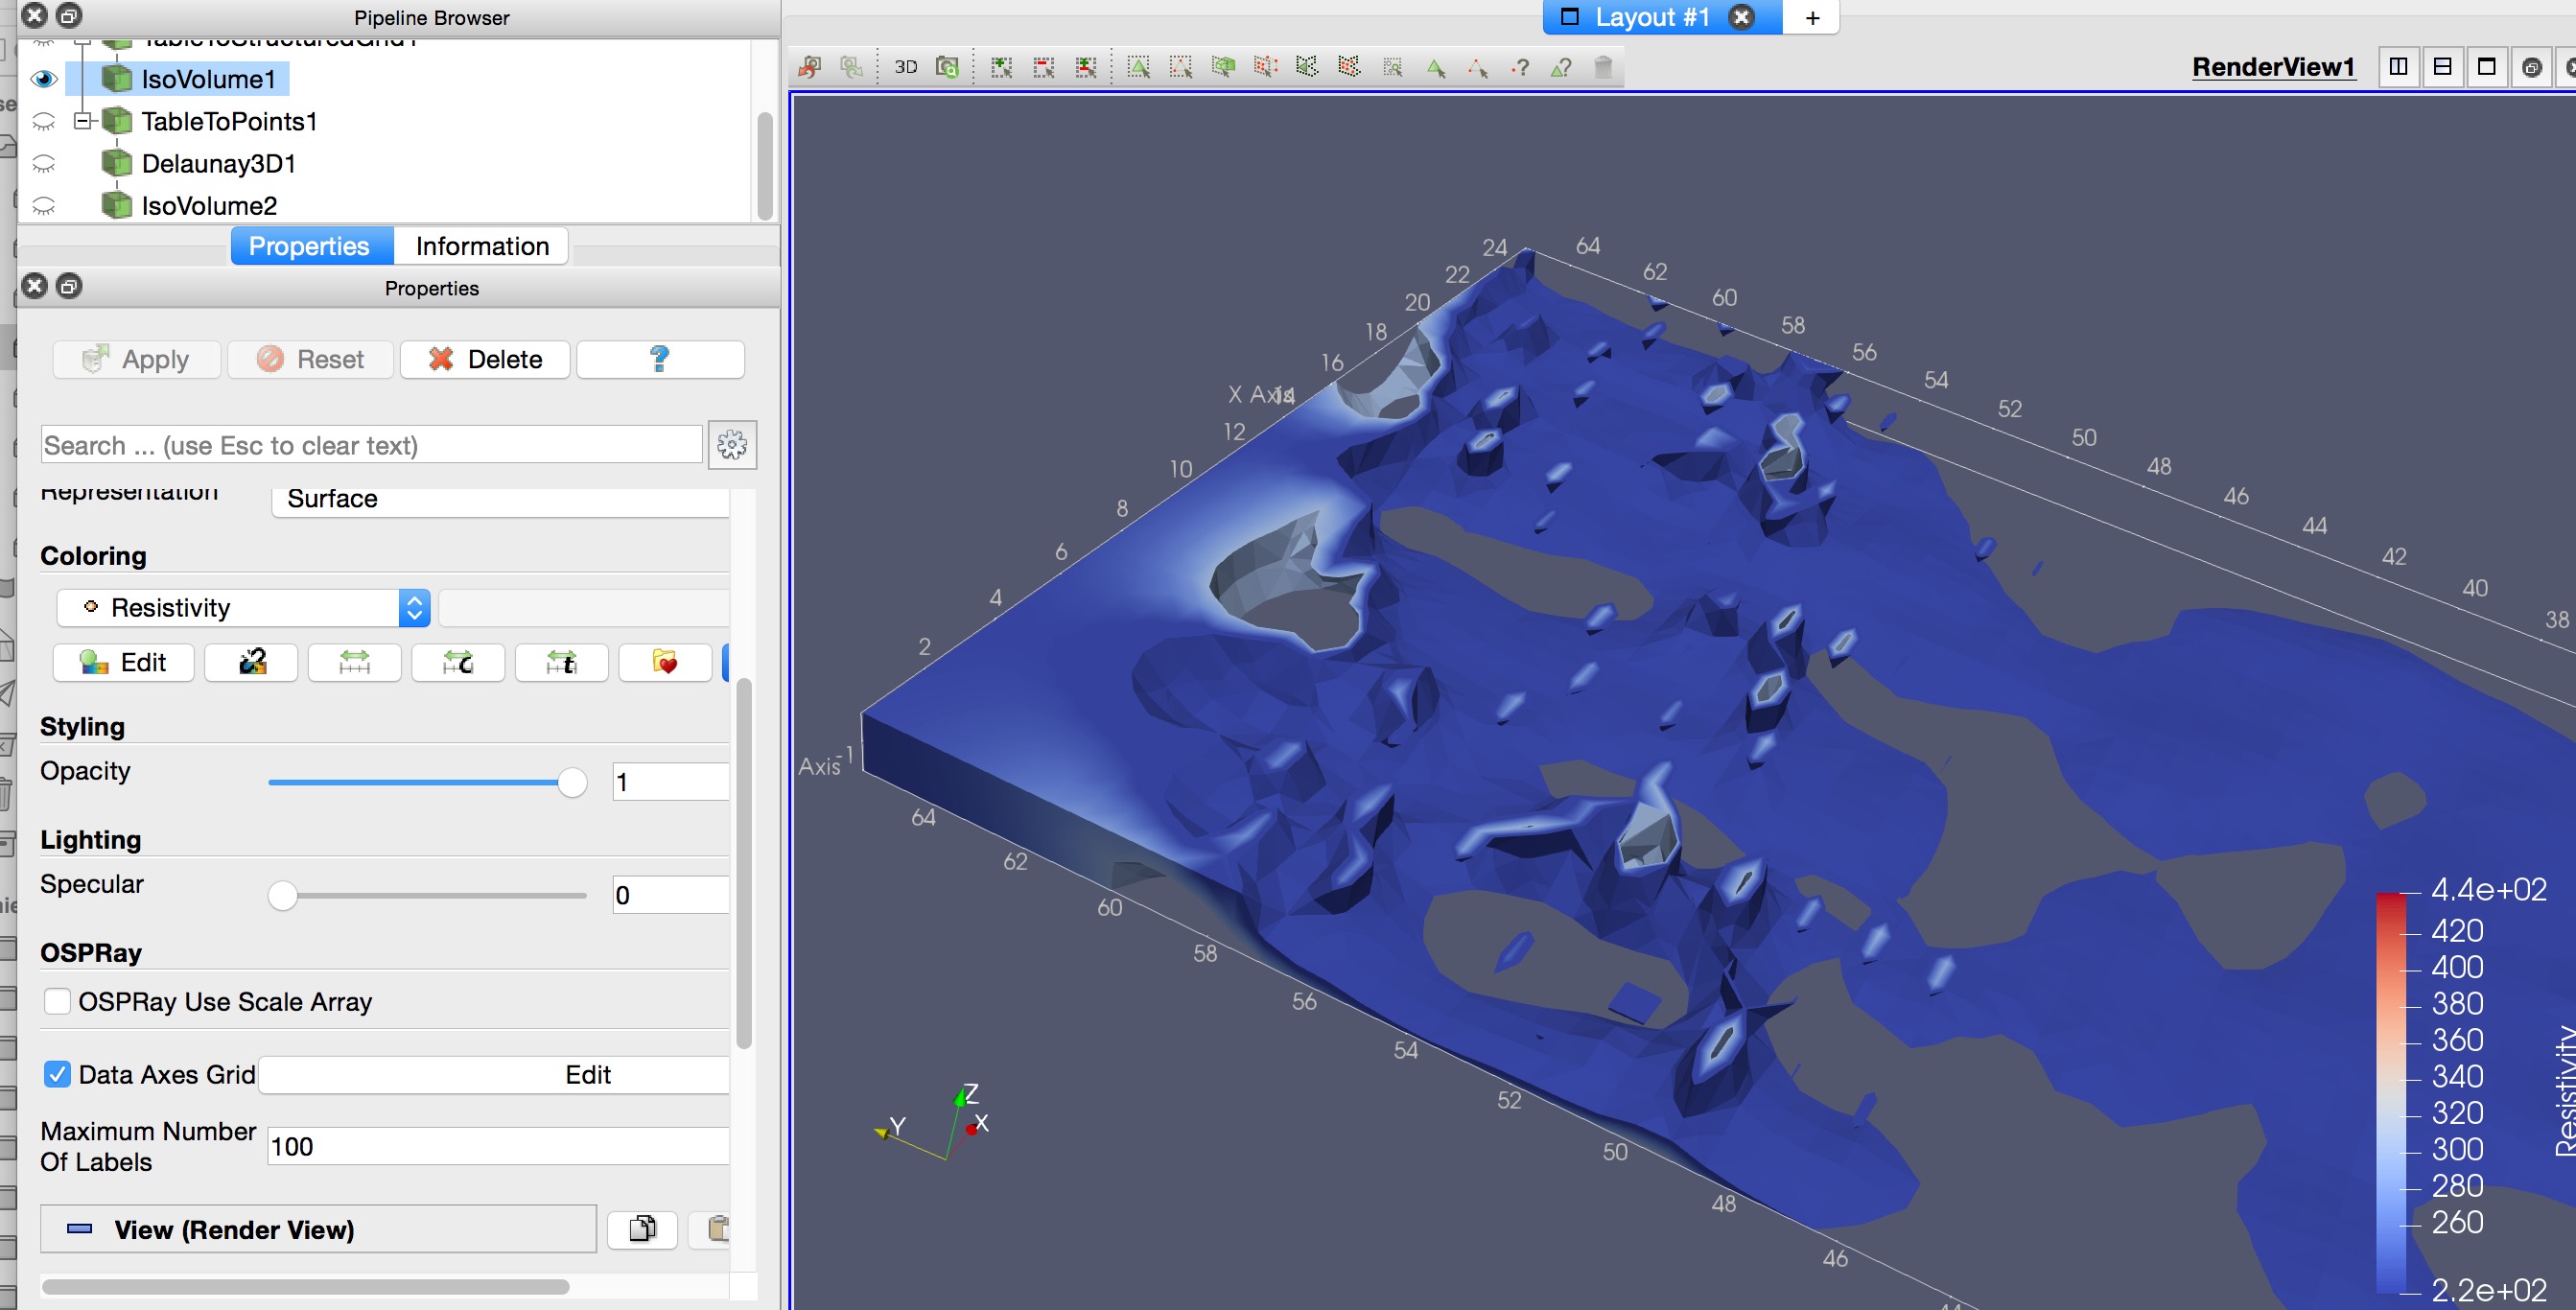.
So I have one filter less in the chain (i.e. "dalaunay3d), but I would like to have a finer resolution.
I did try the contour filter as well, and gives quite similar results.
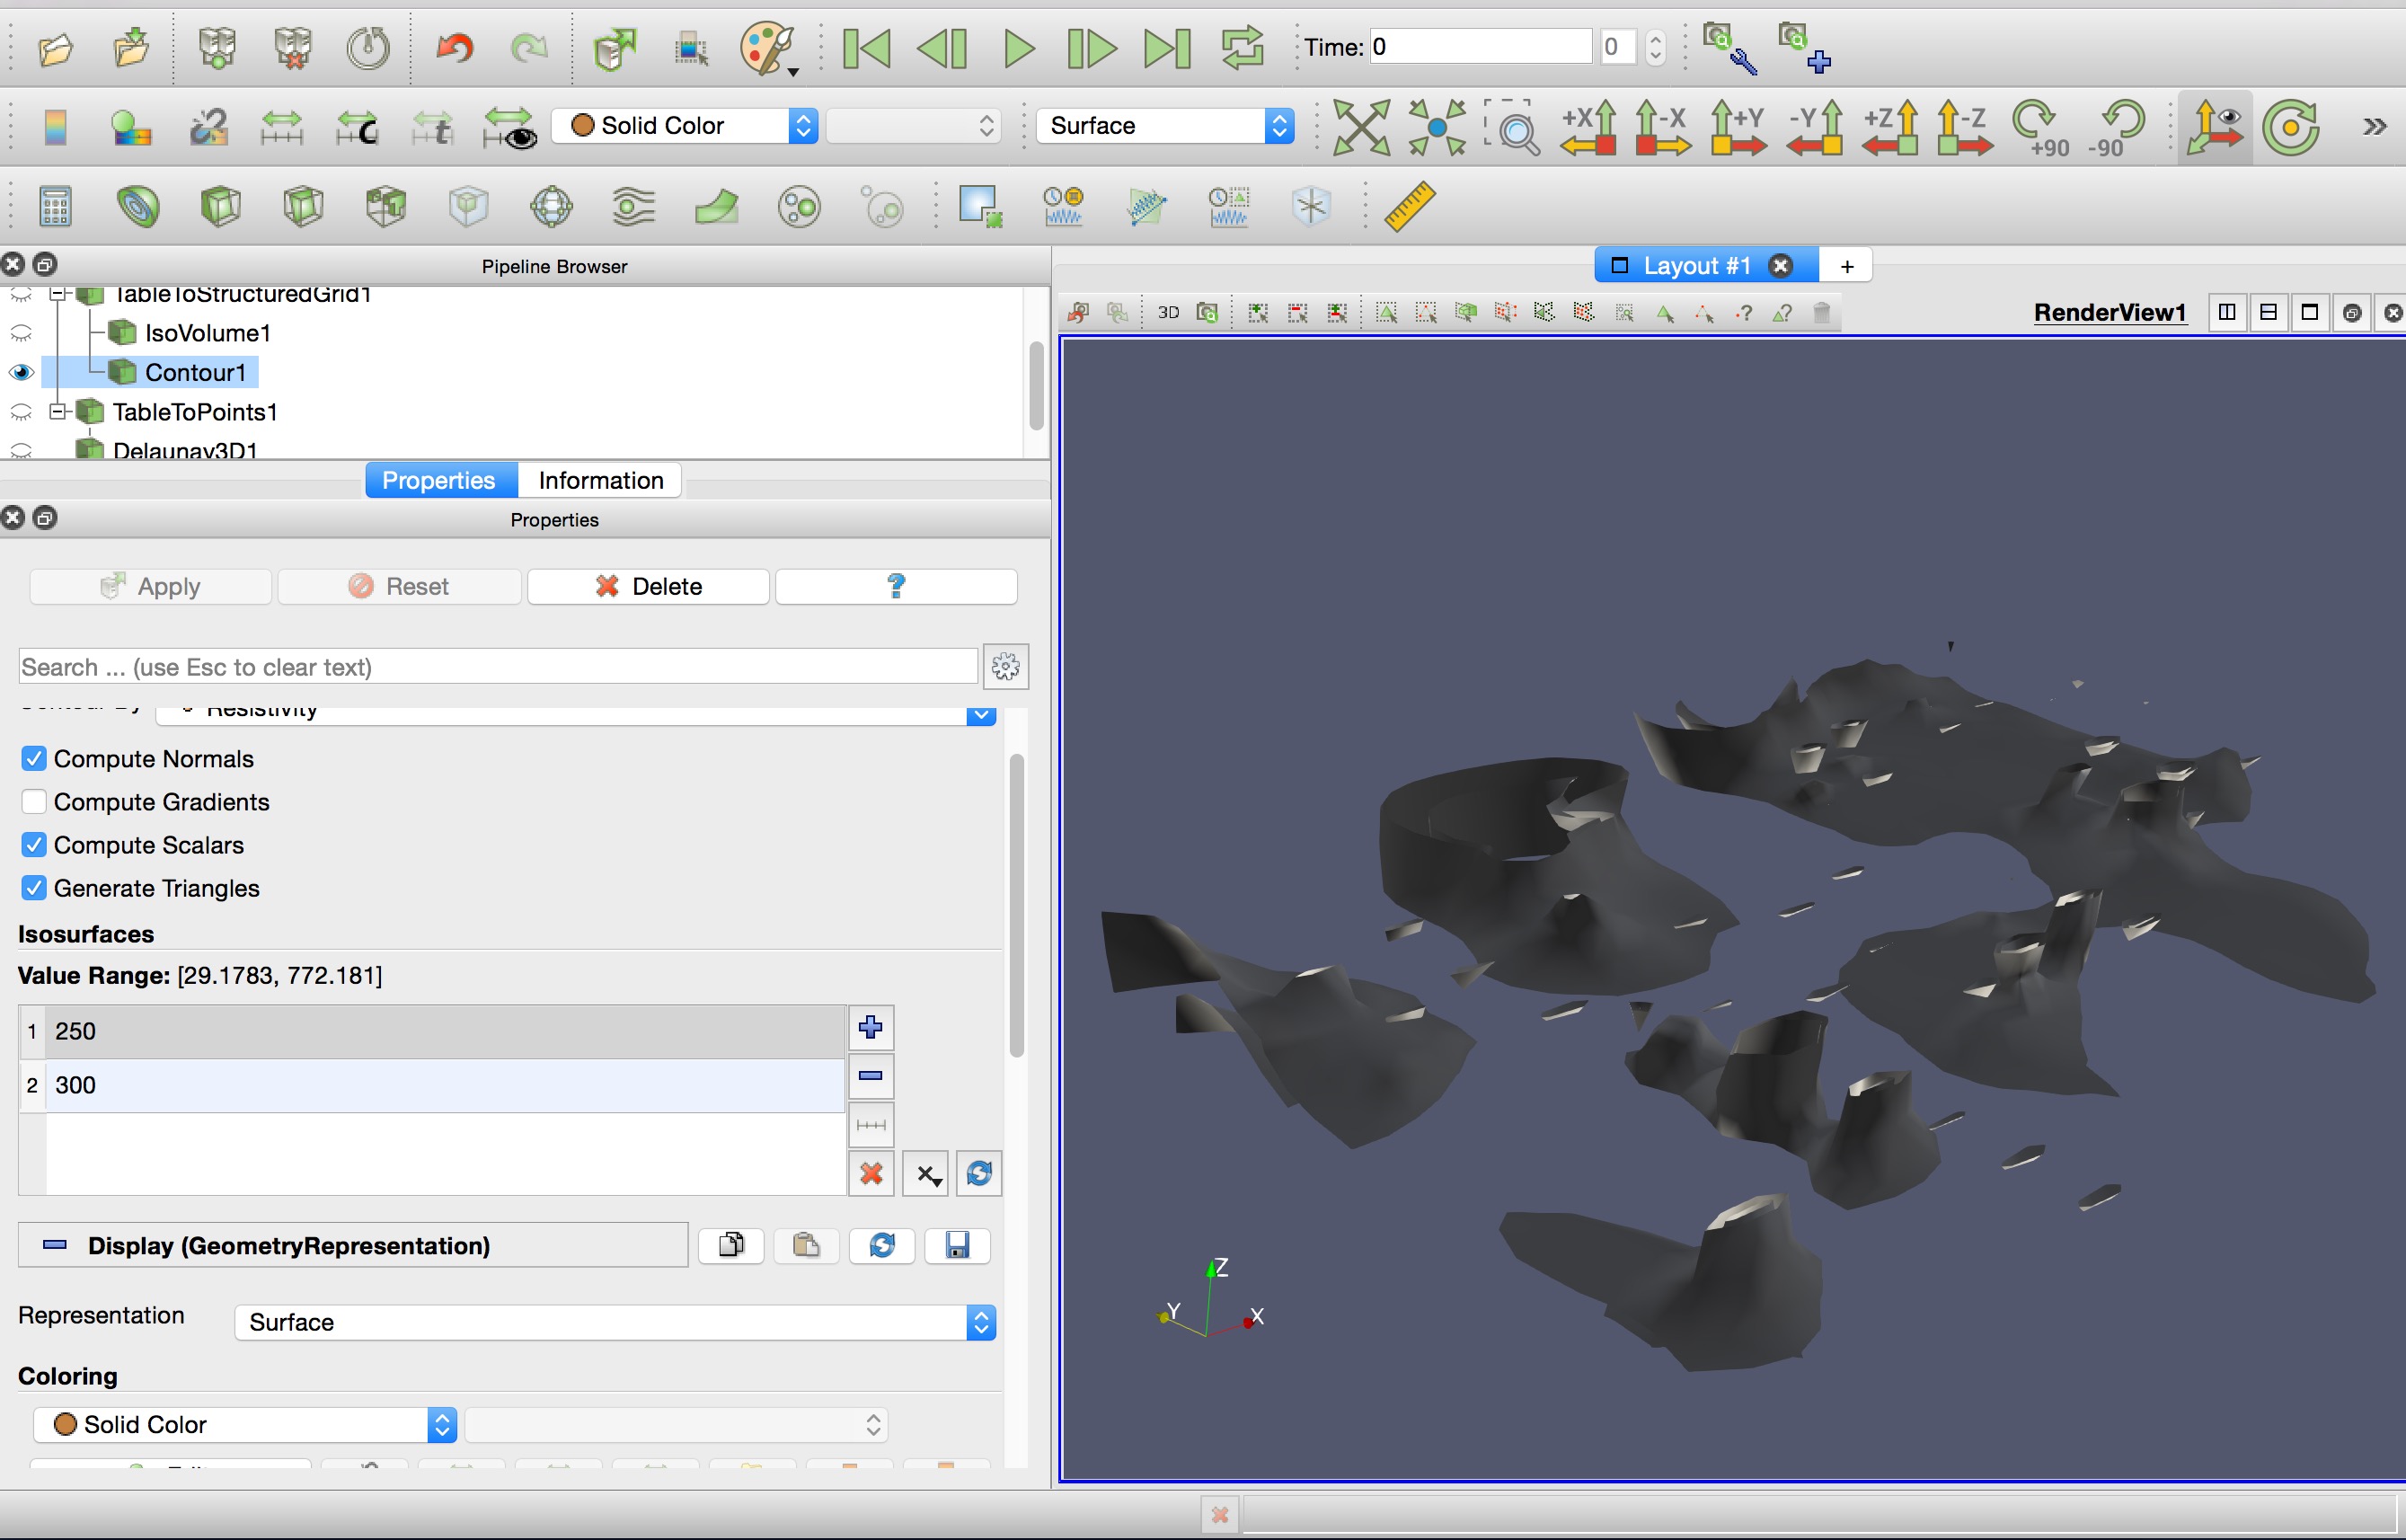
Have you any hints how to improve the resolution ? would it be an idea to scale up the model since I can’t find a way to have a finer detail in the resultion of filter ?
---
### Author:  [@Aashish\_Chaudhary](https://discourse.paraview.org/u/Aashish_Chaudhary)
#### Post date: [March 15, 2019, 1:13pm UTC](https://discourse.paraview.org/t/trasforming-geophisical-data-into-a-3d-mesh/1442/10 "2019-03-15T13:13:12Z")
> [@ubi\_laptop](#):
>
> er less in the ch
@ubi_laptop your resolution will be limited by your input data unless you apply some filter to add more grid points via some interpolation. I am assuming by resolution, you want finer mesh / denser geometry.
---
### Author:  [@ubi\_laptop](https://discourse.paraview.org/u/ubi_laptop)
#### Post date: [March 15, 2019, 1:27pm UTC](https://discourse.paraview.org/t/trasforming-geophisical-data-into-a-3d-mesh/1442/11 "2019-03-15T13:27:03Z")
> [@Aashish\_Chaudhary](#):
>
> o add more grid points via some interpolation
exactly !
Some interpolation in the table or in the filter, but I can’t find a way for either one or the other. I’m asking this because I’ve seen a commercial software manipolating the same grid, and the result is way finer.
---
### Author:  [@ubi\_laptop](https://discourse.paraview.org/u/ubi_laptop)
#### Post date: [March 20, 2019, 5:29pm UTC](https://discourse.paraview.org/t/trasforming-geophisical-data-into-a-3d-mesh/1442/12 "2019-03-20T17:29:01Z")
After many attempts, I answer my own question: the filter “tesselate” can improve a litle (not as much as requested) the resolution
---
### Author:  [@fanfan](https://discourse.paraview.org/u/fanfan)
#### Post date: [March 22, 2019, 1:18am UTC](https://discourse.paraview.org/t/trasforming-geophisical-data-into-a-3d-mesh/1442/13 "2019-03-22T01:18:30Z")
Is R the value in meters or the grid number (for ex: col 100, row 180)?