# Trying to show csv data in Paraview
**URL:** https://discourse.paraview.org/t/trying-to-show-csv-data-in-paraview/10725
**Category:** ParaView Support
**Tags:** python
**Created:** [November 11, 2022, 10:33am UTC](https://discourse.paraview.org/t/trying-to-show-csv-data-in-paraview/10725 "2022-11-11T10:33:53Z")
**Posts on this page:** 5
**Page:** 1
### Author:  [@meljarak](https://discourse.paraview.org/u/meljarak)
#### Post date: [November 11, 2022, 10:33am UTC](https://discourse.paraview.org/t/trying-to-show-csv-data-in-paraview/10725/1 "2022-11-11T10:33:53Z")
Hello everyone, I want to show a CFD result csv data(x coordinate, y coordinate, z coordinate, physical data temperature/velocity/…) in Paraview as cell data
I tried following filters:
1. TableToPoints → point 3D plot, but what I want is cell 3D plot
2. TableToPoints+Delauay3D → It works, but in my fluid case, geometry is really complex, and it seems Delauay3D will “fill” all the holes
3. TableToStructured → Not work, science my grid is not a “cube”
So I want to know if there is any way I could show csv data in Paraview as cell data?
I have the grid in med or cgns format, so I’m wondering if I could map these data to my grid?Or could I do this in Paraview or through other way like Python?
Thanks
---
### Author:  [@nicolas.vuaille](https://discourse.paraview.org/u/nicolas.vuaille)
#### Post date: [November 14, 2022, 1:08pm UTC](https://discourse.paraview.org/t/trying-to-show-csv-data-in-paraview/10725/2 "2022-11-14T13:08:17Z")
Hi,
You should load the csv, then load the mesh (from the `cgns`) and apply the data to it:
- File / open `.csv`
- `TableToPoints` to create points from csv
- File / open `.cgns`
- select cgns then points
- `Append Attributes` → csv data is on the cgns grid
- `Point Data To Cell Data`
Note that all this can be done either from the interface (recommended when learning) and in a paraview python script.
---
### Author:  [@para\_noob](https://discourse.paraview.org/u/para_noob)
#### Post date: [September 12, 2023, 9:59am UTC](https://discourse.paraview.org/t/trying-to-show-csv-data-in-paraview/10725/3 "2023-09-12T09:59:35Z")
Hello Nicolas,
I am a student trying your given method. I have extracted data from paraview in csv file and now worked on in matlab and now i am again importing back the data in paraview to visualize the result . My csv file contains 3 columns of x,y and z coordinates and last column of specified data . i did all the steps as you mentioned first imported csv then Table to Points then opened cgns file for the same the append attributes after selecting cgns the table to pints in pipeline . But I cannot see my data in the cgns and I have also done point data to cell data. Can you help me out here where I am going wrong. Please I am not visualize my data back on it.
---
### Author:  [@nicolas.vuaille](https://discourse.paraview.org/u/nicolas.vuaille)
#### Post date: [September 12, 2023, 10:26am UTC](https://discourse.paraview.org/t/trying-to-show-csv-data-in-paraview/10725/4 "2023-09-12T10:26:09Z")
Hi,
First, did you have some error messages or warning at some steps ?
> [@para\_noob](#):
>
> I cannot see my data in the cgns
Some way to explore:
- which pipeline source are you displaying ?
- did you try to change the array used for coloration ?
- select the `PointDataToCellData` in the pipeline and look at the `Information` panel. Do you have a geometry ? Do you see the expected data in array list ?
---
### Author:  [@para\_noob](https://discourse.paraview.org/u/para_noob)
#### Post date: [September 12, 2023, 10:42am UTC](https://discourse.paraview.org/t/trying-to-show-csv-data-in-paraview/10725/5 "2023-09-12T10:42:31Z")
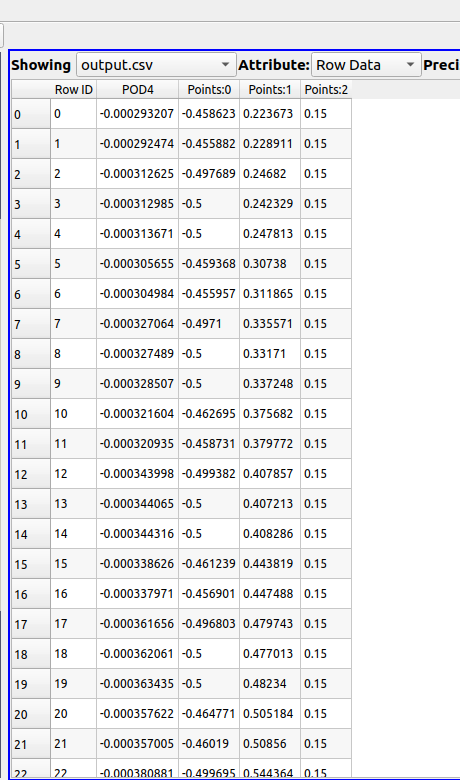
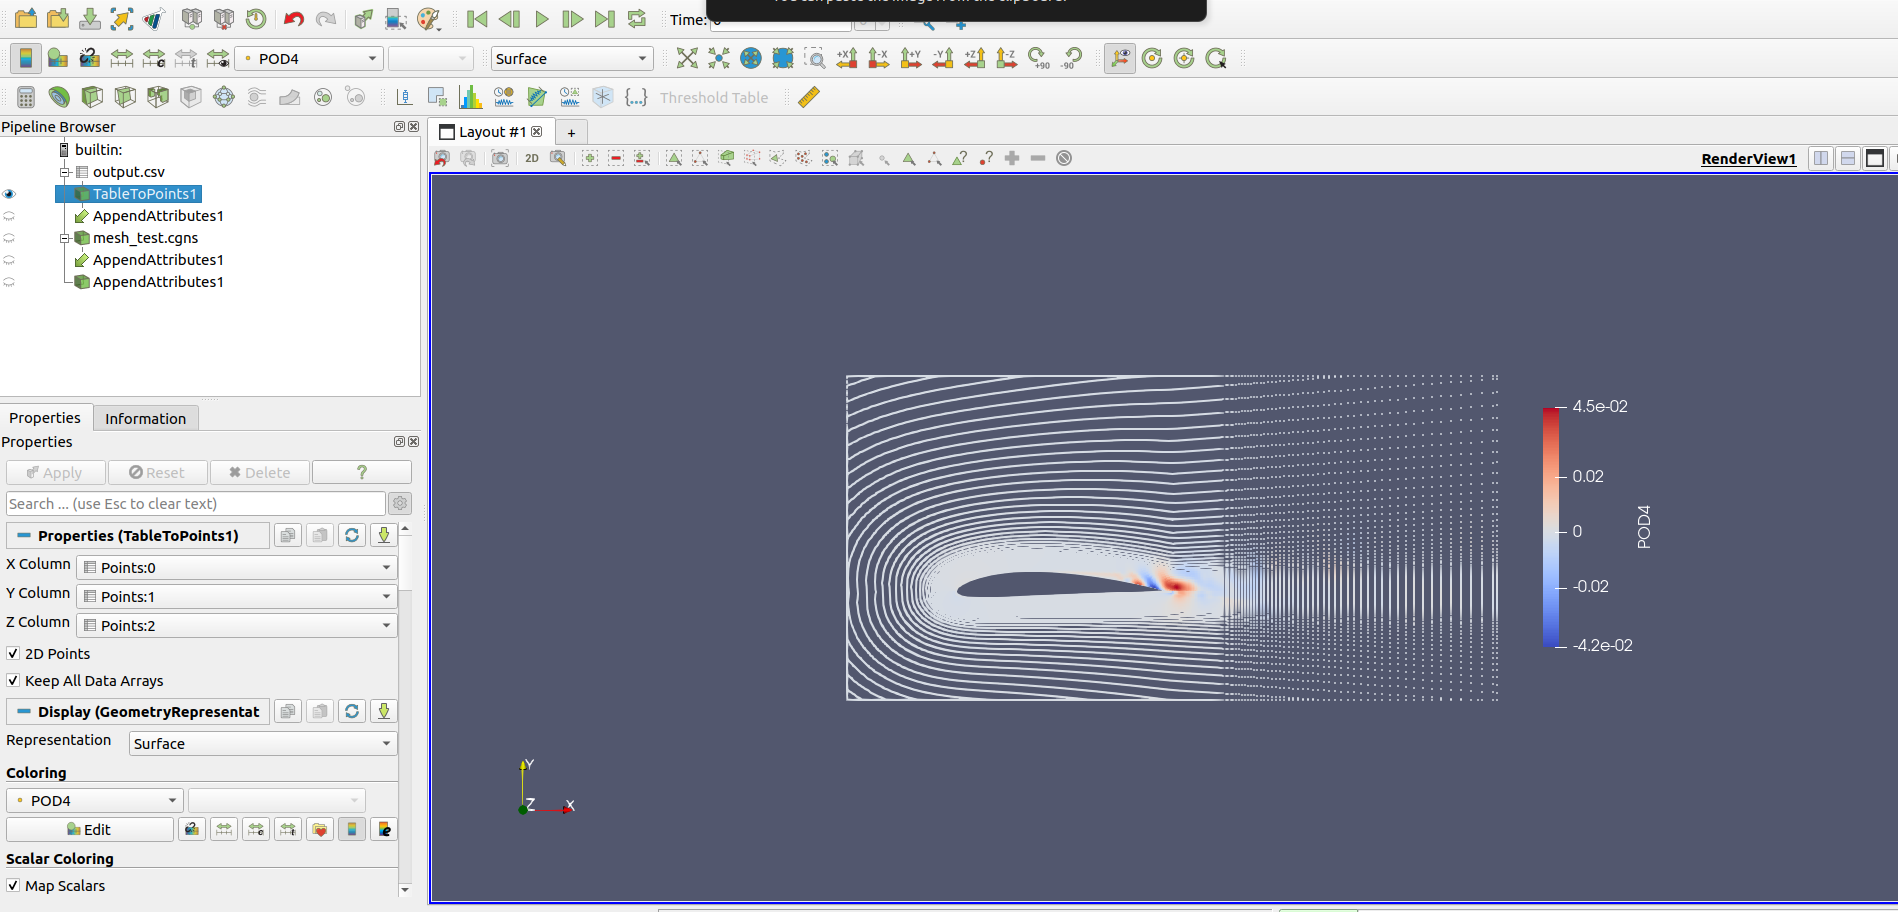
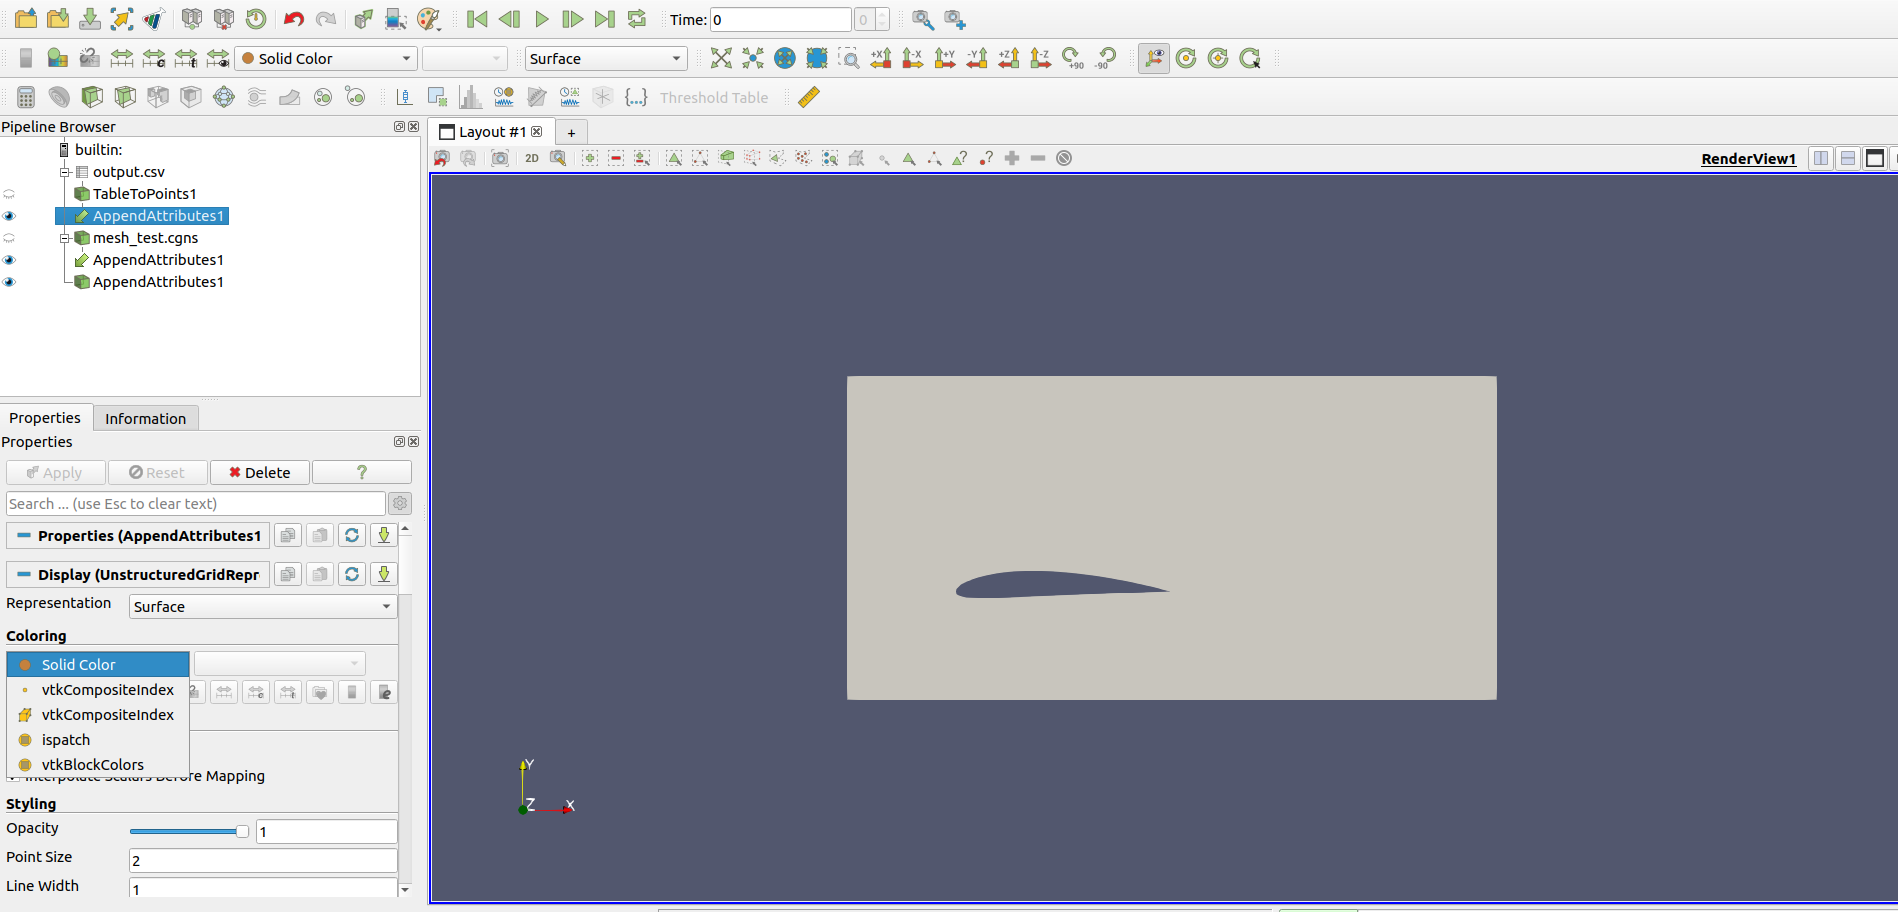
I am not getting data into cgns file as you can see. adn I am not ablr to apply filter `Point Data To Cell Data` in that appendattributes1 . I hope I am able to present my problem correctly . I would like to visualize POD values on this cgns mesh. And thank so much for replying!!