OK. Here are the steps I think will do what you want.
- The swirly lines on the plane look like they are made with the Surface LIC plugin. That plugin is not loaded by default, but it is easy to load.
- Go to
Tools->Manage Plugins....
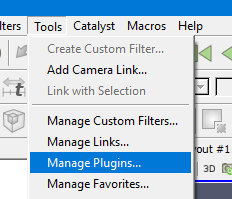
- Click the
SurfaceLICplugin and then clickLoad Selected. - If you see both
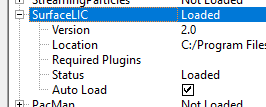
Remote PluginsandLocal Plugins, loadSurfaceLICin both places. - You might also want to click the + next to
SurfaceLICand click on theAuto Load. That will makeSurfaceLICautomatically load the next time you start ParaView.
- Click
Closewhen you are done.
- Go to
- Load the
jvec.vtifile. ClickApply. - Add the
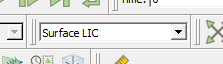
Extract Surfacefilter. ClickApply. (This filter will convert the 2D uniform grid to polygons. This is because theSurfaceLICplugin will not work directly with the 2D unform grid.) - Change the representation from
SurfacetoSurface LIC.
- Add the
Glyphfilter. ChangeOrientation Arraytovectors. ChangeScale Factorto1.Apply. - In your image it looks like the arrows are colored black. Click the edit colors button
 and select the color you want.
This is a state file I created following these instructions. A screen shot from this state file is below.
lic-with-glyphs.pvsm (419.2 KB)
