# Update to: Unable to render a StructuredGrid source using ProgrammableSource filter
**URL:** https://discourse.paraview.org/t/update-to-unable-to-render-a-structuredgrid-source-using-programmablesource-filter/15663
**Category:** ParaView Support
**Created:** [October 30, 2024, 8:58pm UTC](https://discourse.paraview.org/t/update-to-unable-to-render-a-structuredgrid-source-using-programmablesource-filter/15663 "2024-10-30T20:58:40Z")
**Posts on this page:** 7
**Page:** 1
### Author:  [@jmb64](https://discourse.paraview.org/u/jmb64)
#### Post date: [October 30, 2024, 8:58pm UTC](https://discourse.paraview.org/t/update-to-unable-to-render-a-structuredgrid-source-using-programmablesource-filter/15663/1 "2024-10-30T20:58:40Z")
UPDATE: Thanks to Jean M. Favre suggestion in his 2019 post …
Problem displaying Structured Grid when loading from Programmable Source
“[Problem displaying Structured Grid when loading from Programmable Source](https://discourse.paraview.org/t/problem-displaying-structured-grid-when-loading-from-programmable-source/3051)”
ProgrammableSource using StructuredGrid Output Type is working now but …
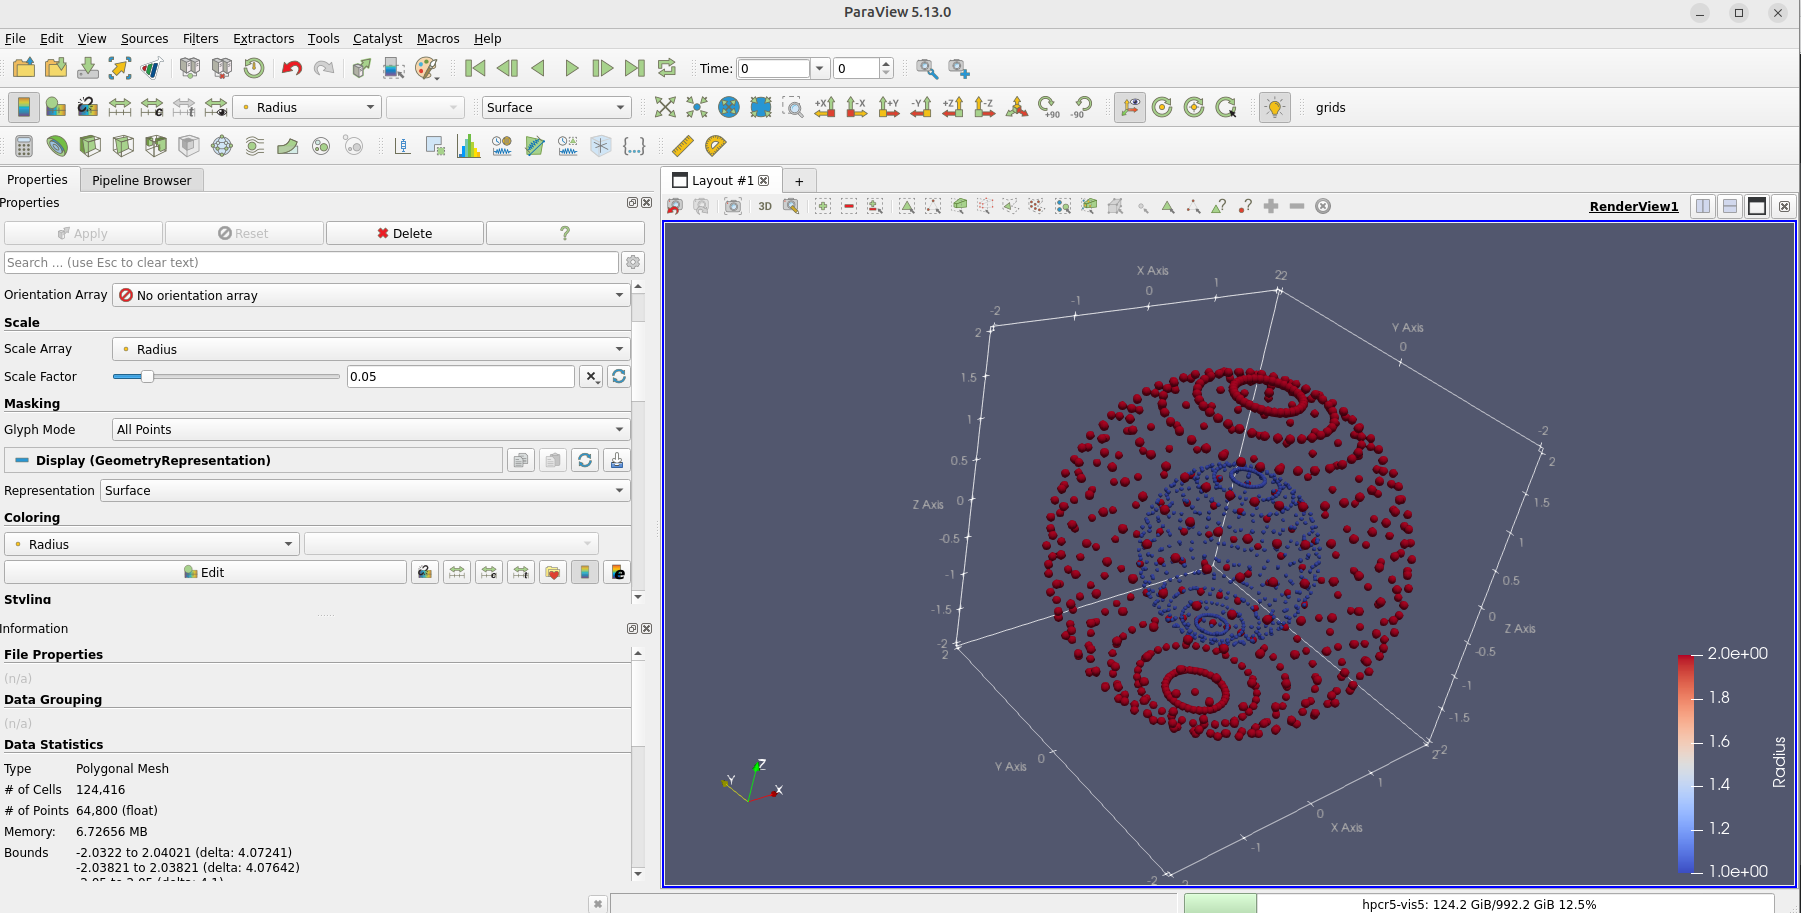
I guess, the question that comes to my mind now is
1. Why in the PolyData Output type case,references to the vtk pipeline mechanics are not necessary ( i.e. commands like executive.GetOutputInformation(0), …,) ?
2. Also, there seems to have synchronization or communication issue (client-server). The default Outline rendering does show only after pushing the Apply button a second time … Some form of update mechanism seems to be triggered, and only then does the Outline appear …
I would welcome any comment or explanation regarding these issues.
Thanks.
Cheers,
JM
---
### Author:  [@mwestphal](https://discourse.paraview.org/u/mwestphal)
#### Post date: [October 31, 2024, 8:26am UTC](https://discourse.paraview.org/t/update-to-unable-to-render-a-structuredgrid-source-using-programmablesource-filter/15663/2 "2024-10-31T08:26:28Z")
> [@jmb64](#):
>
> Why in the PolyData Output type case,references to the vtk pipeline mechanics are not necessary ( i.e. commands like executive.GetOutputInformation(0), …,) ?
Because in the case of unstructured data, extents are not required, as points position are completetely explicit.
> Also, there seems to have synchronization or communication issue (client-server).
Please share actual steps to reproduce
---
### Author:  [@jmb64](https://discourse.paraview.org/u/jmb64)
#### Post date: [October 31, 2024, 1:22pm UTC](https://discourse.paraview.org/t/update-to-unable-to-render-a-structuredgrid-source-using-programmablesource-filter/15663/3 "2024-10-31T13:22:26Z")
Hi Mathieu,
```
Thanks for your reply!
```
1. Point taken for number Q1.
VTK User Guide ch15 would be a useful reading for this ? Any others? I’ve noticed 4-5 short
blog posts by B. Geveci which appear interesting … and a rather more involved document on
Proxy, something I’m not familiar with but seems at the heart of the communication between
Paraview client side (python) and server side VTK C++ libraries ? Not sure sometimes if the
documents, wiki are outdated or not.
1. Concerning synchronization issue (for lack of a better word) here are the steps I went trough:
In PARAVIEW GUI …
1. Add Programmable Source
2. Set Output Dataset type to “vtkStructuredgrid” in the Properties
3. Paste script “StructuredGrid\_source\_spheres.py” in the Script window (script down below)
4. Click Apply
—\> No rendering
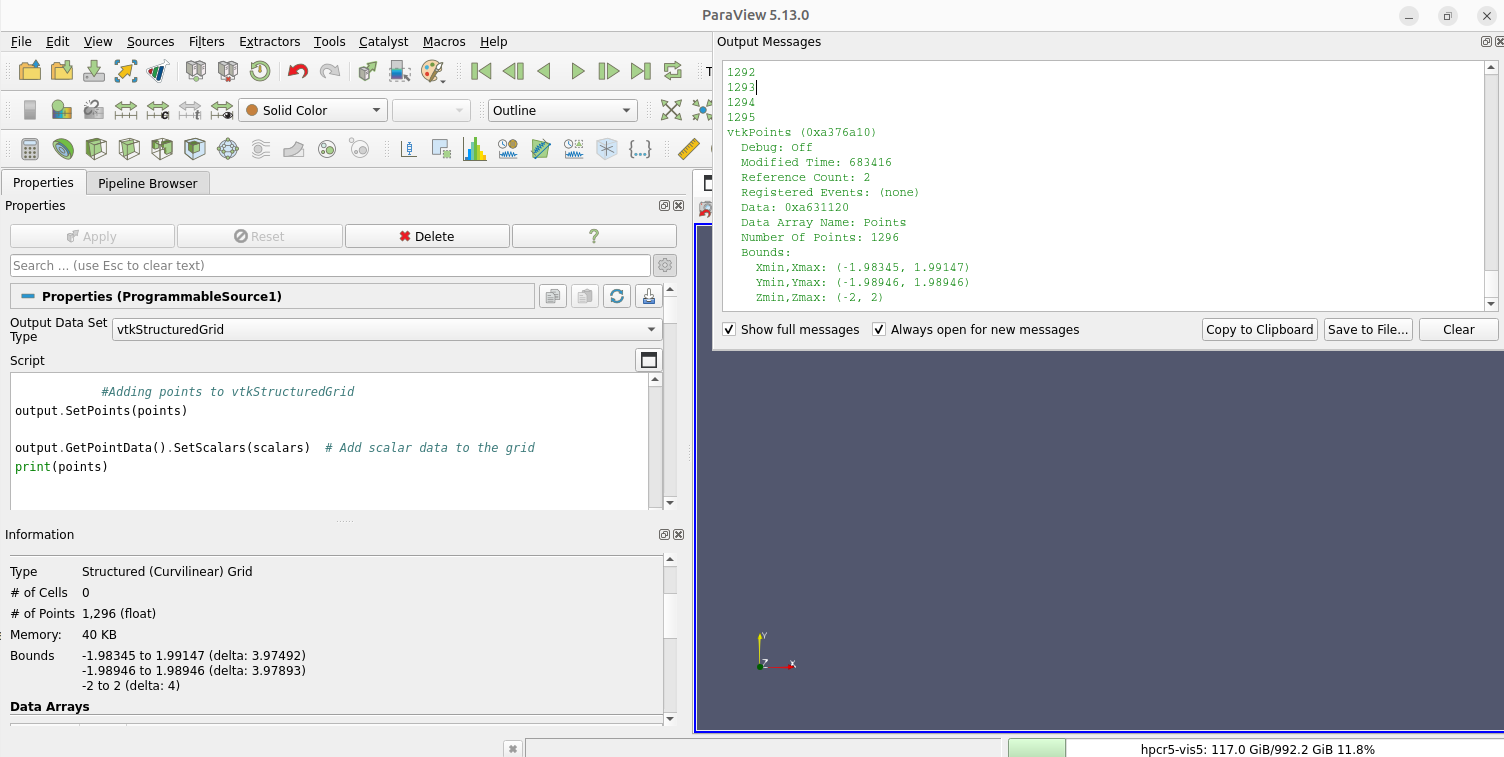
1. Edit Script,i.e.
(simply type a return a the end of the script to make the Apply button active (green) again
2. Click Apply a second time.
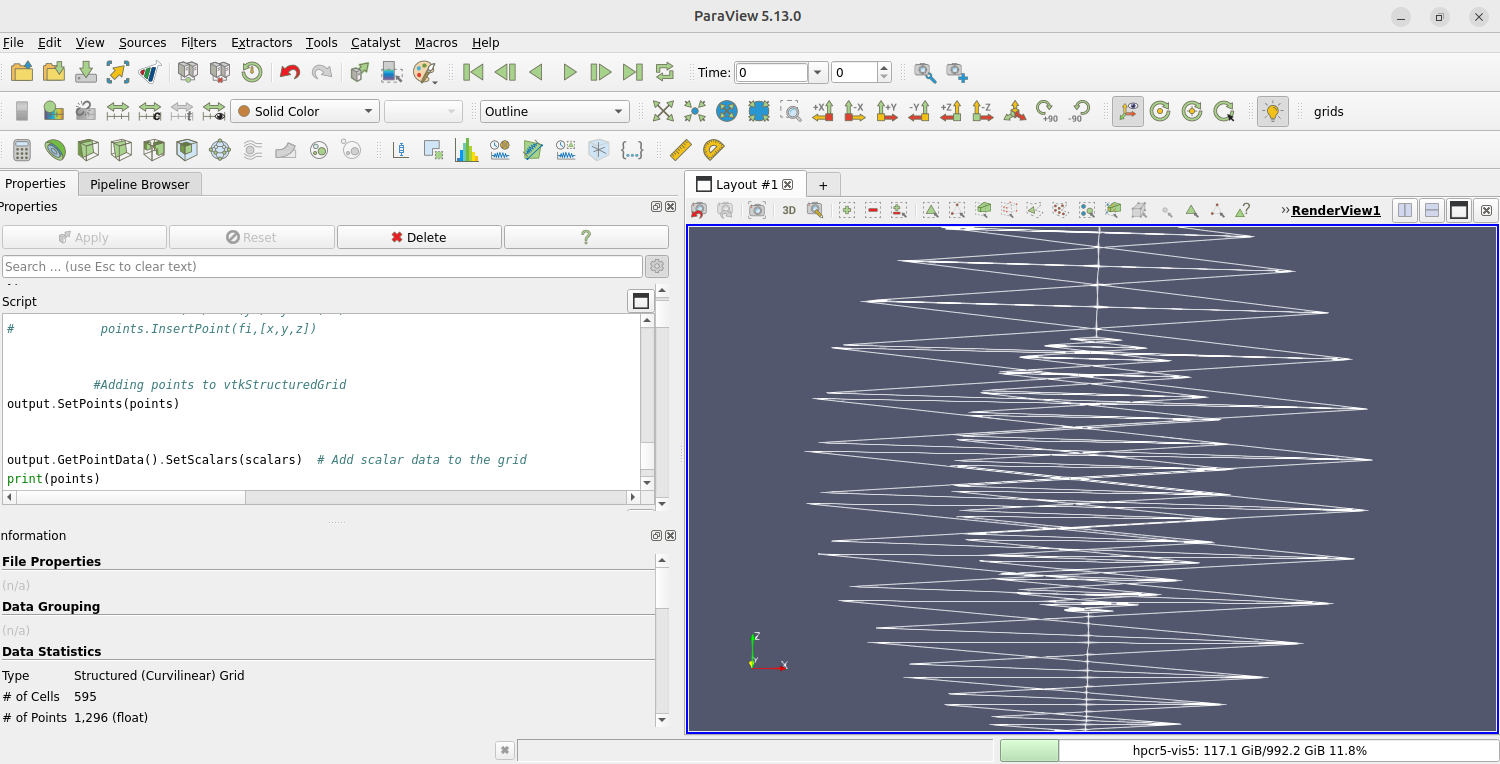
→ Rendering Outline (default Representation which appears after the first Apply)
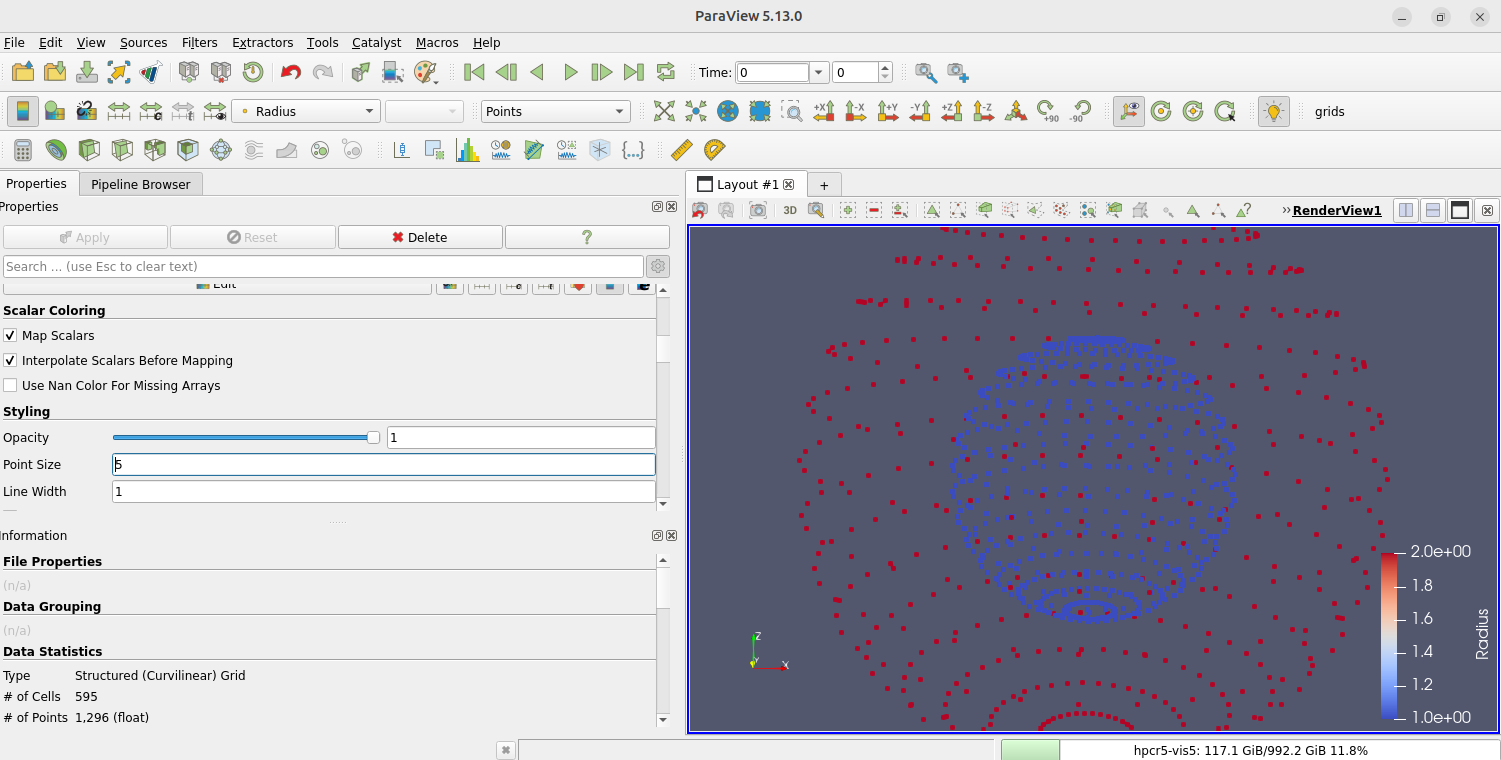
1. Finally, selecting Points Representation, color by scalar “Radius”, pointsize 5
and Apply (3rd time)
I get this
Script StructuredGrid\_source\_spheres.py:
```auto
import numpy as np
from vtkmodules.vtkCommonCore import vtkPoints, vtkDoubleArray
from vtkmodules.vtkCommonDataModel import vtkStructuredGrid
# Parameters
n_theta = 18 # Number of divisions in the theta direction
n_phi = 36 # Number of divisions in the phi direction
radii = [1.0, 2.0] # Radii for two spherical layers
# Calculate grid dimensions
n_r = len(radii)
dims = [n_theta, n_phi, n_r]
executive = self.GetExecutive()
outInfo = executive.GetOutputInformation(0)
outInfo.Set(executive.WHOLE_EXTENT(), 0, dims[0]-1 , 0, dims[1]-1 , 0, dims[2]-1)
executive = self.GetExecutive()
outInfo = executive.GetOutputInformation(0)
exts = [executive.UPDATE_EXTENT().Get(outInfo, i) for i in range(6)]
dims=[exts[1]+1, exts[3]+1, exts[5]+1]
output.SetExtent(exts)
#vtk points
points = vtk.vtkPoints()
points.Allocate(dims[0] * dims[1] * dims[2])
scalars = vtkDoubleArray()
scalars.SetName("Radius") # Name of the scalar field
# Define spherical coordinates and convert them to Cartesian
for ir in range(n_r):
r=radii[ir]
for theta_idx in range(n_theta):
theta = theta_idx * np.pi / (n_theta - 1)
for phi_idx in range(n_phi):
phi = phi_idx * 2 * np.pi / (n_phi - 1)
x = r * np.sin(theta) * np.cos(phi)
y = r * np.sin(theta) * np.sin(phi)
z = r * np.cos(theta)
fi = ir*n_theta*n_phi+theta_idx*n_phi+phi_idx # Flat index
points.InsertPoint(fi,[x,y,z])
print(fi)
# points.InsertNextPoint(x, y, z)
# Add the scalar value (e.g., radius here)
scalars.InsertNextValue(r)
#Adding grid points #for iz, z in enumerate(zs):
# for iy, y in enumerate(ys):
# for ix, x in enumerate(xs):
# fi = iz*len(xs)*len(ys)+iy*len(xs)+ix # Flat index
# points.InsertPoint(fi,[x,y,z])
#Adding points to vtkStructuredGrid
output.SetPoints(points)
output.GetPointData().SetScalars(scalars) # Add scalar data to the grid
print(points)
```
Feels weird having to edit the script window to allow the second Apply or the possibility to chose the representation …
Is there something I should be doing in the GUI or is this normal behaviour ?
Thanks,
JM
---
### Author:  [@mwestphal](https://discourse.paraview.org/u/mwestphal)
#### Post date: [October 31, 2024, 1:25pm UTC](https://discourse.paraview.org/t/update-to-unable-to-render-a-structuredgrid-source-using-programmablesource-filter/15663/4 "2024-10-31T13:25:37Z")
Your request data definitely should not be modifying the extent, this should be done in the RequestUpdateExtent. Make sure to enable “Advanced” properties to see it.
---
### Author:  [@jmb64](https://discourse.paraview.org/u/jmb64)
#### Post date: [October 31, 2024, 2:37pm UTC](https://discourse.paraview.org/t/update-to-unable-to-render-a-structuredgrid-source-using-programmablesource-filter/15663/5 "2024-10-31T14:37:29Z")
Mathieu,
```
Oh boy. I just found out there was a second script window (RequestInformation) that
```
was completely hidden below the Information View !
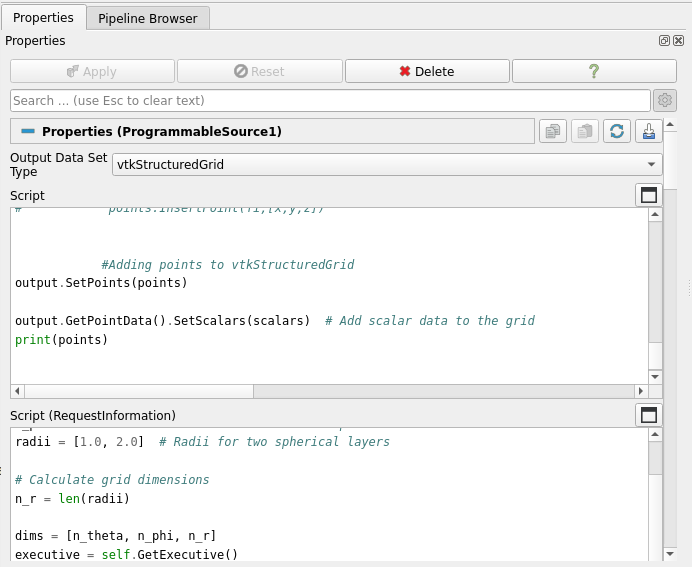
Now that I split the code in two parts:
Script:
```auto
import numpy as np
from vtkmodules.vtkCommonCore import vtkPoints, vtkDoubleArray
from vtkmodules.vtkCommonDataModel import vtkStructuredGrid
# Parameters
n_theta = 18 # Number of divisions in the theta direction
n_phi = 36 # Number of divisions in the phi direction
radii = [1.0, 2.0] # Radii for two spherical layers
# Calculate grid dimensions
n_r = len(radii)
executive = self.GetExecutive()
outInfo = executive.GetOutputInformation(0)
exts = [executive.UPDATE_EXTENT().Get(outInfo, i) for i in range(6)]
dims=[exts[1]+1, exts[3]+1, exts[5]+1]
output.SetExtent(exts)
#vtk points
points = vtk.vtkPoints()
points.Allocate(dims[0] * dims[1] * dims[2])
scalars = vtkDoubleArray()
scalars.SetName("Radius") # Name of the scalar field
# Define spherical coordinates and convert them to Cartesian
for ir in range(n_r):
r=radii[ir]
for theta_idx in range(n_theta):
theta = theta_idx * np.pi / (n_theta - 1)
for phi_idx in range(n_phi):
phi = phi_idx * 2 * np.pi / (n_phi - 1)
x = r * np.sin(theta) * np.cos(phi)
y = r * np.sin(theta) * np.sin(phi)
z = r * np.cos(theta)
fi = ir*n_theta*n_phi+theta_idx*n_phi+phi_idx # Flat index
points.InsertPoint(fi,[x,y,z])
print(fi)
# points.InsertNextPoint(x, y, z)
# Add the scalar value (e.g., radius here)
scalars.InsertNextValue(r)
#Adding grid points #for iz, z in enumerate(zs):
# for iy, y in enumerate(ys):
# for ix, x in enumerate(xs):
# fi = iz*len(xs)*len(ys)+iy*len(xs)+ix # Flat index
# points.InsertPoint(fi,[x,y,z])
#Adding points to vtkStructuredGrid
output.SetPoints(points)
output.GetPointData().SetScalars(scalars) # Add scalar data to the grid
print(points)
```
Script(RequestInformation):
```auto
# Parameters
n_theta = 18 # Number of divisions in the theta direction
n_phi = 36 # Number of divisions in the phi direction
radii = [1.0, 2.0] # Radii for two spherical layers
# Calculate grid dimensions
n_r = len(radii)
dims = [n_theta, n_phi, n_r]
executive = self.GetExecutive()
outInfo = executive.GetOutputInformation(0)
outInfo.Set(executive.WHOLE_EXTENT(), 0, dims[0]-1 , 0, dims[1]-1 , 0, dims[2]-1)
```
I get the Outline representation immediately !
This will take some time to get used to.
Is there a way to programmatically set the Representation (to Points instead of Outline) , Coloring by scalar (“Radius”) and set the Point Size to say, 5 ?
To reuse the Source I suppose the next step would be to create a python plugin following Section 5.5 in
[https://docs.paraview.org/en/latest/ReferenceManual/pythonProgrammableFilter.html#python-algorithm](https://docs.paraview.org/en/latest/ReferenceManual/pythonProgrammableFilter.html#python-algorithm)
?
Thanks,
JM
---
### Author:  [@mwestphal](https://discourse.paraview.org/u/mwestphal)
#### Post date: [October 31, 2024, 2:42pm UTC](https://discourse.paraview.org/t/update-to-unable-to-render-a-structuredgrid-source-using-programmablesource-filter/15663/6 "2024-10-31T14:42:00Z")
> [@jmb64](#):
>
> Is there a way to programmatically set the Representation (to Points instead of Outline) , Coloring by scalar (“Radius”) and set the Point Size to say, 5 ?
Yes, using pvpython scripting, not possible from inside your script.
---
### Author:  [@jmb64](https://discourse.paraview.org/u/jmb64)
#### Post date: [October 31, 2024, 2:45pm UTC](https://discourse.paraview.org/t/update-to-unable-to-render-a-structuredgrid-source-using-programmablesource-filter/15663/7 "2024-10-31T14:45:32Z")
Right.
Thanks Mathieu.