# Use "fake" axis labels
**URL:** https://discourse.paraview.org/t/use-fake-axis-labels/13684
**Category:** ParaView Support
**Created:** [January 12, 2024, 11:01am UTC](https://discourse.paraview.org/t/use-fake-axis-labels/13684 "2024-01-12T11:01:53Z")
**Posts on this page:** 4
**Page:** 1
### Author:  [@Methil](https://discourse.paraview.org/u/Methil)
#### Post date: [January 12, 2024, 11:01am UTC](https://discourse.paraview.org/t/use-fake-axis-labels/13684/1 "2024-01-12T11:01:53Z")
Good morning everyone,
I would like to change my axis labels to something custom (say 0 to 1 instead of 0 to 5000) but I don’t know how to do that. I only found how to display the ticks coorresponding to 0 and 1 on my ax but that is not what I want to do. What I want to do is displaying the ticks corresponding to 0 and 5000 with the labels “0” and “1”.
---
### Author:  [@Methil](https://discourse.paraview.org/u/Methil)
#### Post date: [January 12, 2024, 11:03am UTC](https://discourse.paraview.org/t/use-fake-axis-labels/13684/2 "2024-01-12T11:03:48Z")
To explain a bit more: My issue is that I use a transform filter to increase the size of my z axis compared to my x and y axis but it also changes the values so my z values are multiplied by the factor I use to stretch the z axis.
---
### Author:  [@Kenneth\_Moreland](https://discourse.paraview.org/u/Kenneth_Moreland)
#### Post date: [January 12, 2024, 12:15pm UTC](https://discourse.paraview.org/t/use-fake-axis-labels/13684/3 "2024-01-12T12:15:48Z")
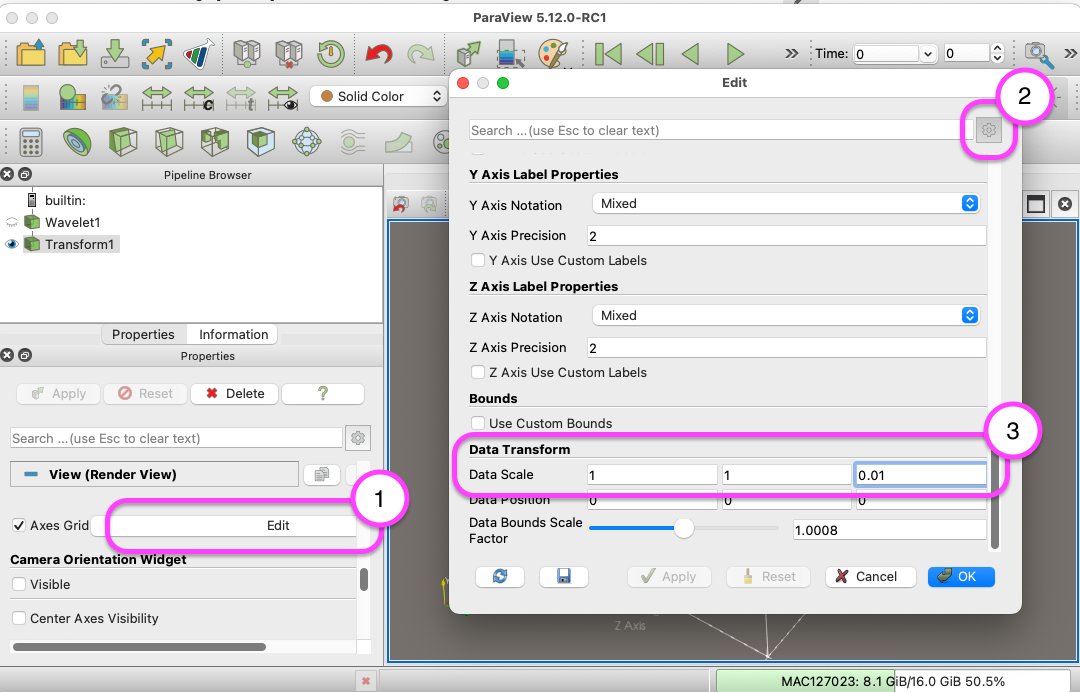
After you apply the `Transform` filter, you can edit the axes to scale the axes in the inverse proportion of the transform.
1. In the `Properties` panel, click the `Edit` button for the `Axes Grid`.
2. In the resulting dialog, turn on the advanced properties.
3. Adjust the `Data Scale` (near the bottom) to be the reciprocal of what you used in the `Transform` filter.
---
### Author:  [@Methil](https://discourse.paraview.org/u/Methil)
#### Post date: [January 12, 2024, 12:53pm UTC](https://discourse.paraview.org/t/use-fake-axis-labels/13684/4 "2024-01-12T12:53:02Z")
Thanks, it worked out fine.