# Using Point Data as Cell Centers in the Surface With Edges Visualisation
**URL:** https://discourse.paraview.org/t/using-point-data-as-cell-centers-in-the-surface-with-edges-visualisation/12350
**Category:** ParaView Support
**Tags:** vtk
**Created:** [June 20, 2023, 2:47pm UTC](https://discourse.paraview.org/t/using-point-data-as-cell-centers-in-the-surface-with-edges-visualisation/12350 "2023-06-20T14:47:41Z")
**Posts on this page:** 4
**Page:** 1
### Author:  [@grld](https://discourse.paraview.org/u/grld)
#### Post date: [June 20, 2023, 2:47pm UTC](https://discourse.paraview.org/t/using-point-data-as-cell-centers-in-the-surface-with-edges-visualisation/12350/1 "2023-06-20T14:47:41Z")
Dear community,
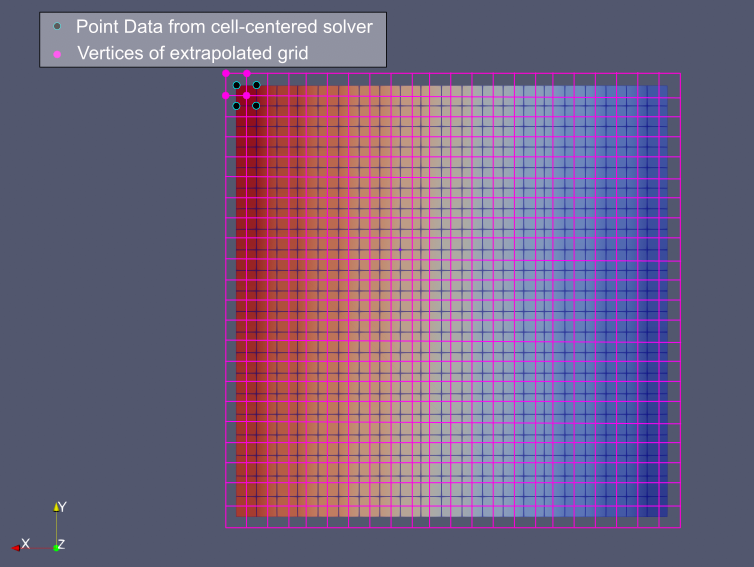
I would like to use ParaView to inspect the results I obtain from a cell-centered solver. The results obtained from the solver correspond to the midpoints of cubic volumes. However, ParaView interprets them as the vertex values of a structured grid. When choosing “Surface With Edges” as visualization this becomes obvious. In that case, I obtain a volume with 21 cubic cells in each direction instead of 22. I have visualized my problem in the enclosed figure. The dark points are the raw data that are interpreted as vertice values of a structured grid. The pink values would be the vertices of the larger grid, in which the raw data corresponds to the cell centers.
I am looking for a way to tell ParaView that the source data are the cell midpoints instead of the cell vertices. Is there any straightforward way to do this? I guess it requires extrapolation from the cell centers to the vertices and an averaging step at those.
Thank you very much!
---
### Author:  [@Kenichiro-Yoshimi](https://discourse.paraview.org/u/Kenichiro-Yoshimi)
#### Post date: [June 20, 2023, 11:35pm UTC](https://discourse.paraview.org/t/using-point-data-as-cell-centers-in-the-surface-with-edges-visualisation/12350/2 "2023-06-20T23:35:21Z")
For image data (Uniform Rectilinear Grid), it may be a good idea to save the data once to Xdmf Data File (File \> Save Files… \> Xdmf Data File (\*.xmf)) and modify the origin position, Dimensions of Topology, and Center of Attribute in the xmf file as follows.
[sample.zip](https://discourse.paraview.org/uploads/short-url/4MPOqjYfcGQTVqK8GteTDSHUXtZ.zip) (6.7 KB)
- org.xmf
```xml
-10 -10 -10
1 1 1
org.h5:Data0
```
- cell\_centerd.xmf
```xml
-10.5 -10.5 -10.5
1 1 1
org.h5:Data0
```
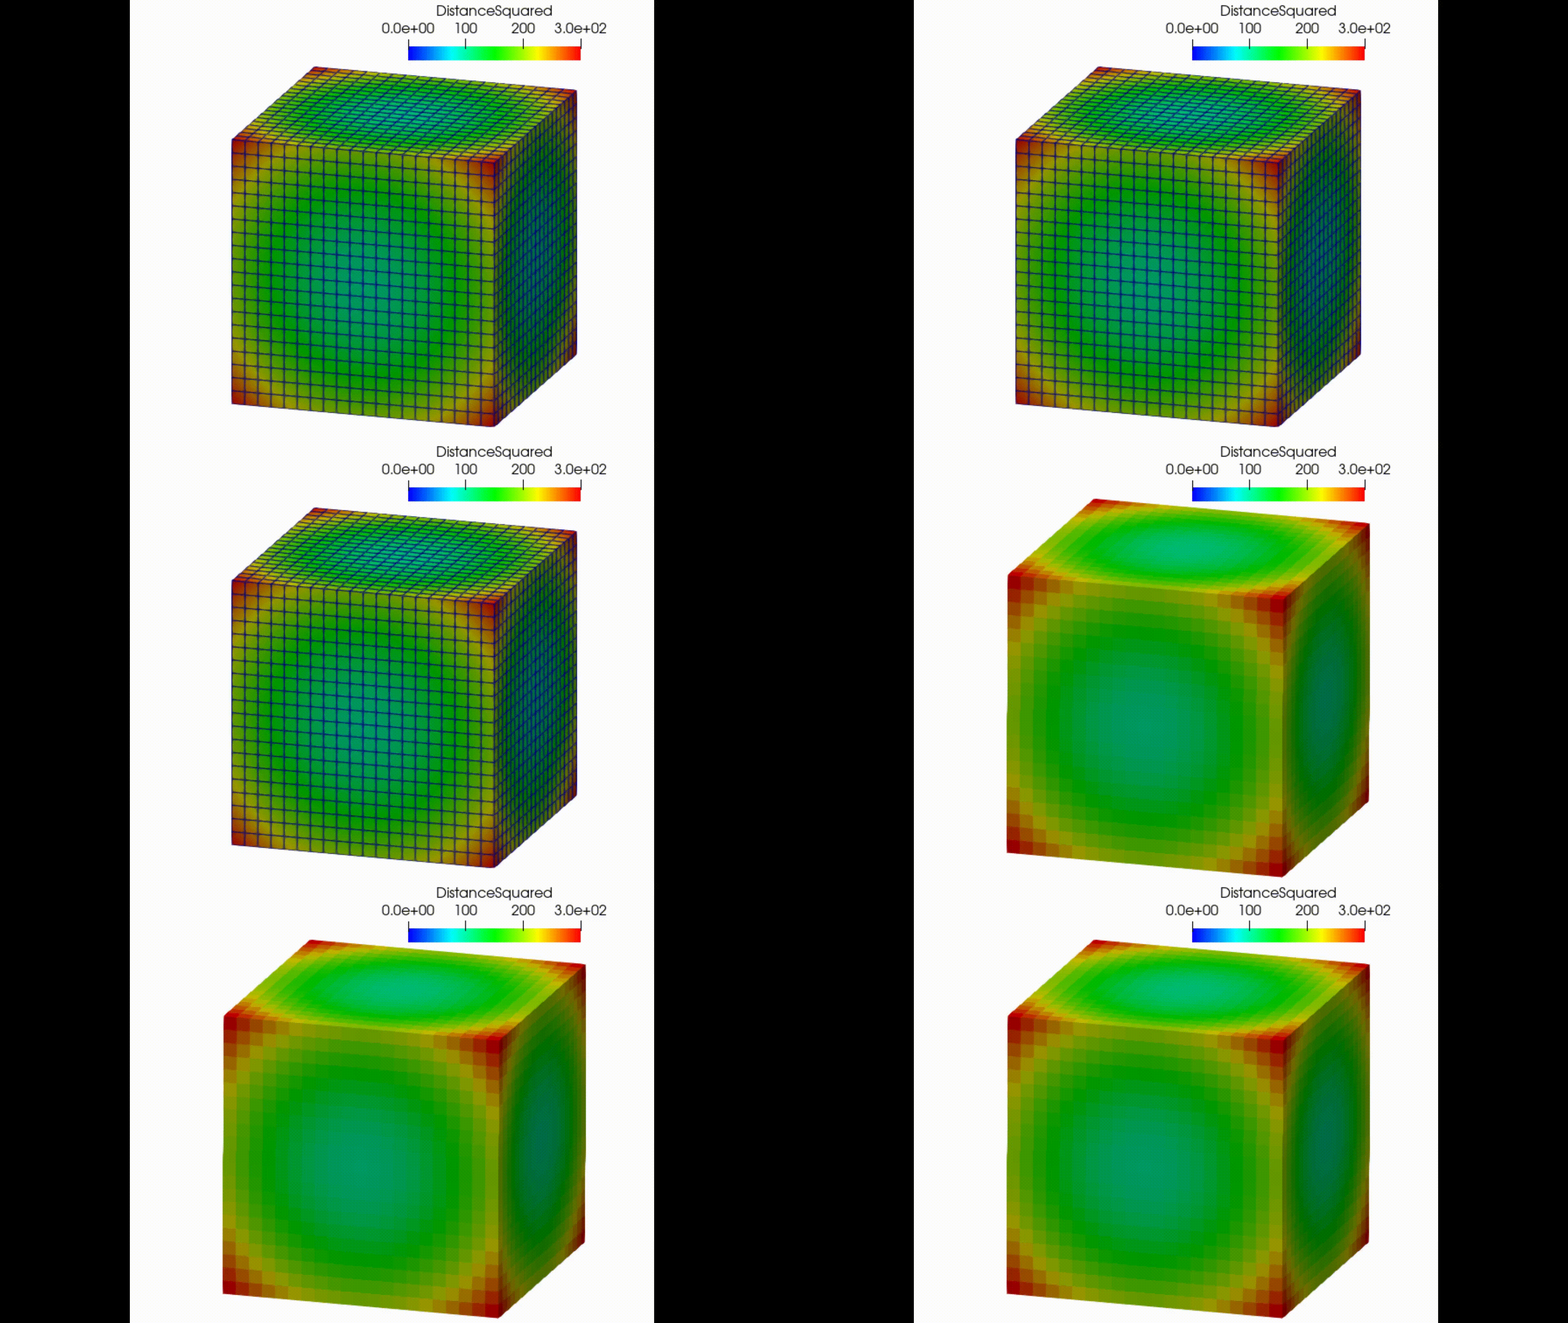
This modification would change the data as follows:
---
### Author:  [@grld](https://discourse.paraview.org/u/grld)
#### Post date: [June 21, 2023, 1:42pm UTC](https://discourse.paraview.org/t/using-point-data-as-cell-centers-in-the-surface-with-edges-visualisation/12350/3 "2023-06-21T13:42:01Z")
Thank you @Kenichiro-Yoshimi for the fast and helpful reply!
I tried to follow your instructions but in my case, the .xmf file looks a little different in terms of Geometry, Topology. It already had the “Dimensions=22 22 22” in the Topology.
```auto
PhaseField_0.h5:Data2
PhaseField_0.h5:Data3
```
Should I replace the Geometry type and the Topology type of my data to match your version?
---
### Author:  [@Kenichiro-Yoshimi](https://discourse.paraview.org/u/Kenichiro-Yoshimi)
#### Post date: [June 22, 2023, 12:19am UTC](https://discourse.paraview.org/t/using-point-data-as-cell-centers-in-the-surface-with-edges-visualisation/12350/4 "2023-06-22T00:19:37Z")
Since your data type is not Image but `Structured (Curvilinear) Grid`, you cannot directly apply the method I suggested. If the spacing of the grid is constant, you could just change it to `Image (Uniform Rectilinear Grid)` data type by using the `Resample To Image` filter and then modify the xmf file, but that seems tedious. I am not sure what format the solver currently uses, but I think it would be better to output the data directly as cell center data.