# Using Python to load multiple CSVs
**URL:** https://discourse.paraview.org/t/using-python-to-load-multiple-csvs/12105
**Category:** ParaView Support
**Tags:** python
**Created:** [May 16, 2023, 4:45am UTC](https://discourse.paraview.org/t/using-python-to-load-multiple-csvs/12105 "2023-05-16T04:45:38Z")
**Posts on this page:** 2
**Page:** 1
### Author:  [@arkottke](https://discourse.paraview.org/u/arkottke)
#### Post date: [May 16, 2023, 4:45am UTC](https://discourse.paraview.org/t/using-python-to-load-multiple-csvs/12105/1 "2023-05-16T04:45:38Z")
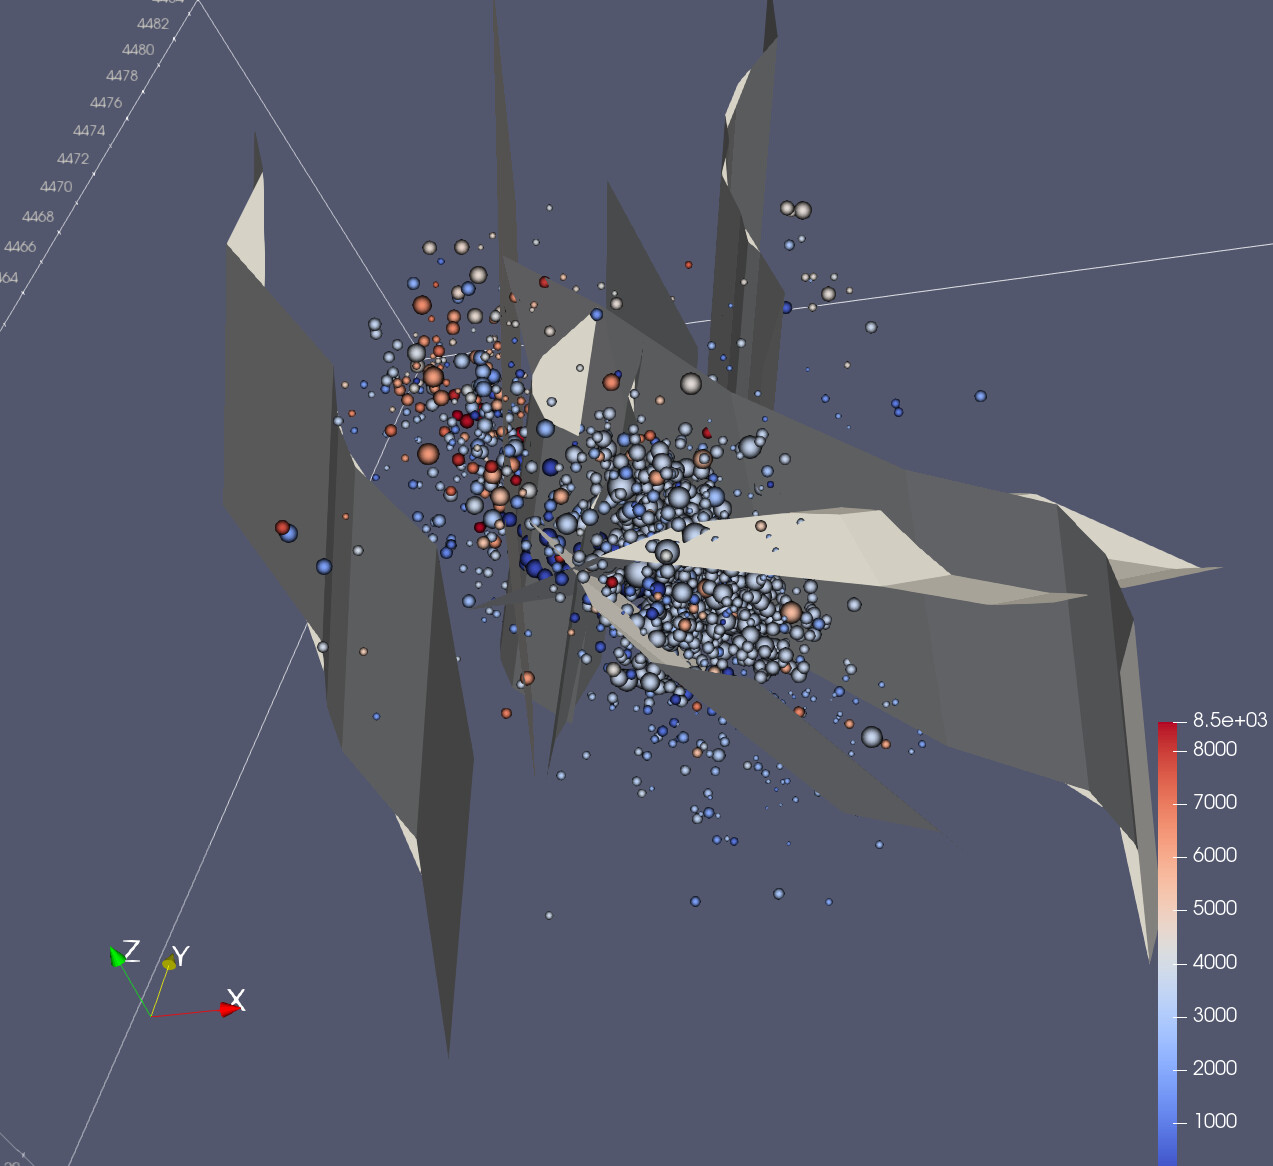
I am trying to plot fault planes and epicenters. I was thinking that this would be a nice exercise to learn paraview. My basic process is to create CSV files of the fault coordinates. I then wrote paraview script to take all of these and create Delaunay2D surfaces of the faults. Here is the script:
```python
from pathlib import Path
from paraview.simple import *
root = Path( __file__ ).parent
table = CSVReader(FileName=str(root / 'data/events.csv'), guiName='Events')
pts = TableToPoints(table, XColumn='easting', YColumn='northing', ZColumn='depth')
Show()
dp = GetDisplayProperties(pts)
dp.Representation = 'Point Gaussian'
for fpath in (root / 'exported').glob('source-*.csv'):
table = CSVReader(FileName=str(fpath), guiName=fpath.stem)
pts = TableToPoints(table, XColumn='easting', YColumn='northing', ZColumn='depth')
surf = Delaunay2D(pts)
surf.ProjectionPlaneMode = 'Best-Fitting Plane'
Show()
renderView = GetActiveView()
ag = renderView.AxesGrid
ag.Visibility = 1
ag.XTitle = 'Easting (km)'
ag.YTitle = 'Northing (km)'
ag.ZTitle = 'Depth (km)'
ResetCamera()
Render()
```
And the resulting output:
I have a few questions/comments:
1. Is there a better way to create the faults? At the surface, the triangulation fills in areas when the faults curve. I was thinking I might be able to put all of the faults into one file.
2. The current approach creates a pretty complicated Pipeline. Is there a good way to create a tree view or group sources and filters? I see this is done when I do things manually, but not programmatically.
3. I can adjust the size epicenters (spheres) by “Use Scale Array” and selecting “magnitude”, but I couldn’t figure out how to do this via the Python interface. How do people usually figure how the relationship between the buttons and the Python?
---
### Author:  [@jourdain](https://discourse.paraview.org/u/jourdain)
#### Post date: [May 16, 2023, 2:29pm UTC](https://discourse.paraview.org/t/using-python-to-load-multiple-csvs/12105/2 "2023-05-16T14:29:00Z")
You should use [the trace to convert UI interaction into code](https://discourse.paraview.org/t/how-to-figure-out-a-python-code-using-the-python-trace-mechanism/4186).