# vector field visualisation
**URL:** https://discourse.paraview.org/t/vector-field-visualisation/11904
**Category:** ParaView Support
**Created:** [April 17, 2023, 9:04am UTC](https://discourse.paraview.org/t/vector-field-visualisation/11904 "2023-04-17T09:04:05Z")
**Posts on this page:** 5
**Page:** 1
### Author:  [@Rigel](https://discourse.paraview.org/u/Rigel)
#### Post date: [April 17, 2023, 9:04am UTC](https://discourse.paraview.org/t/vector-field-visualisation/11904/1 "2023-04-17T09:04:05Z")
Hi,
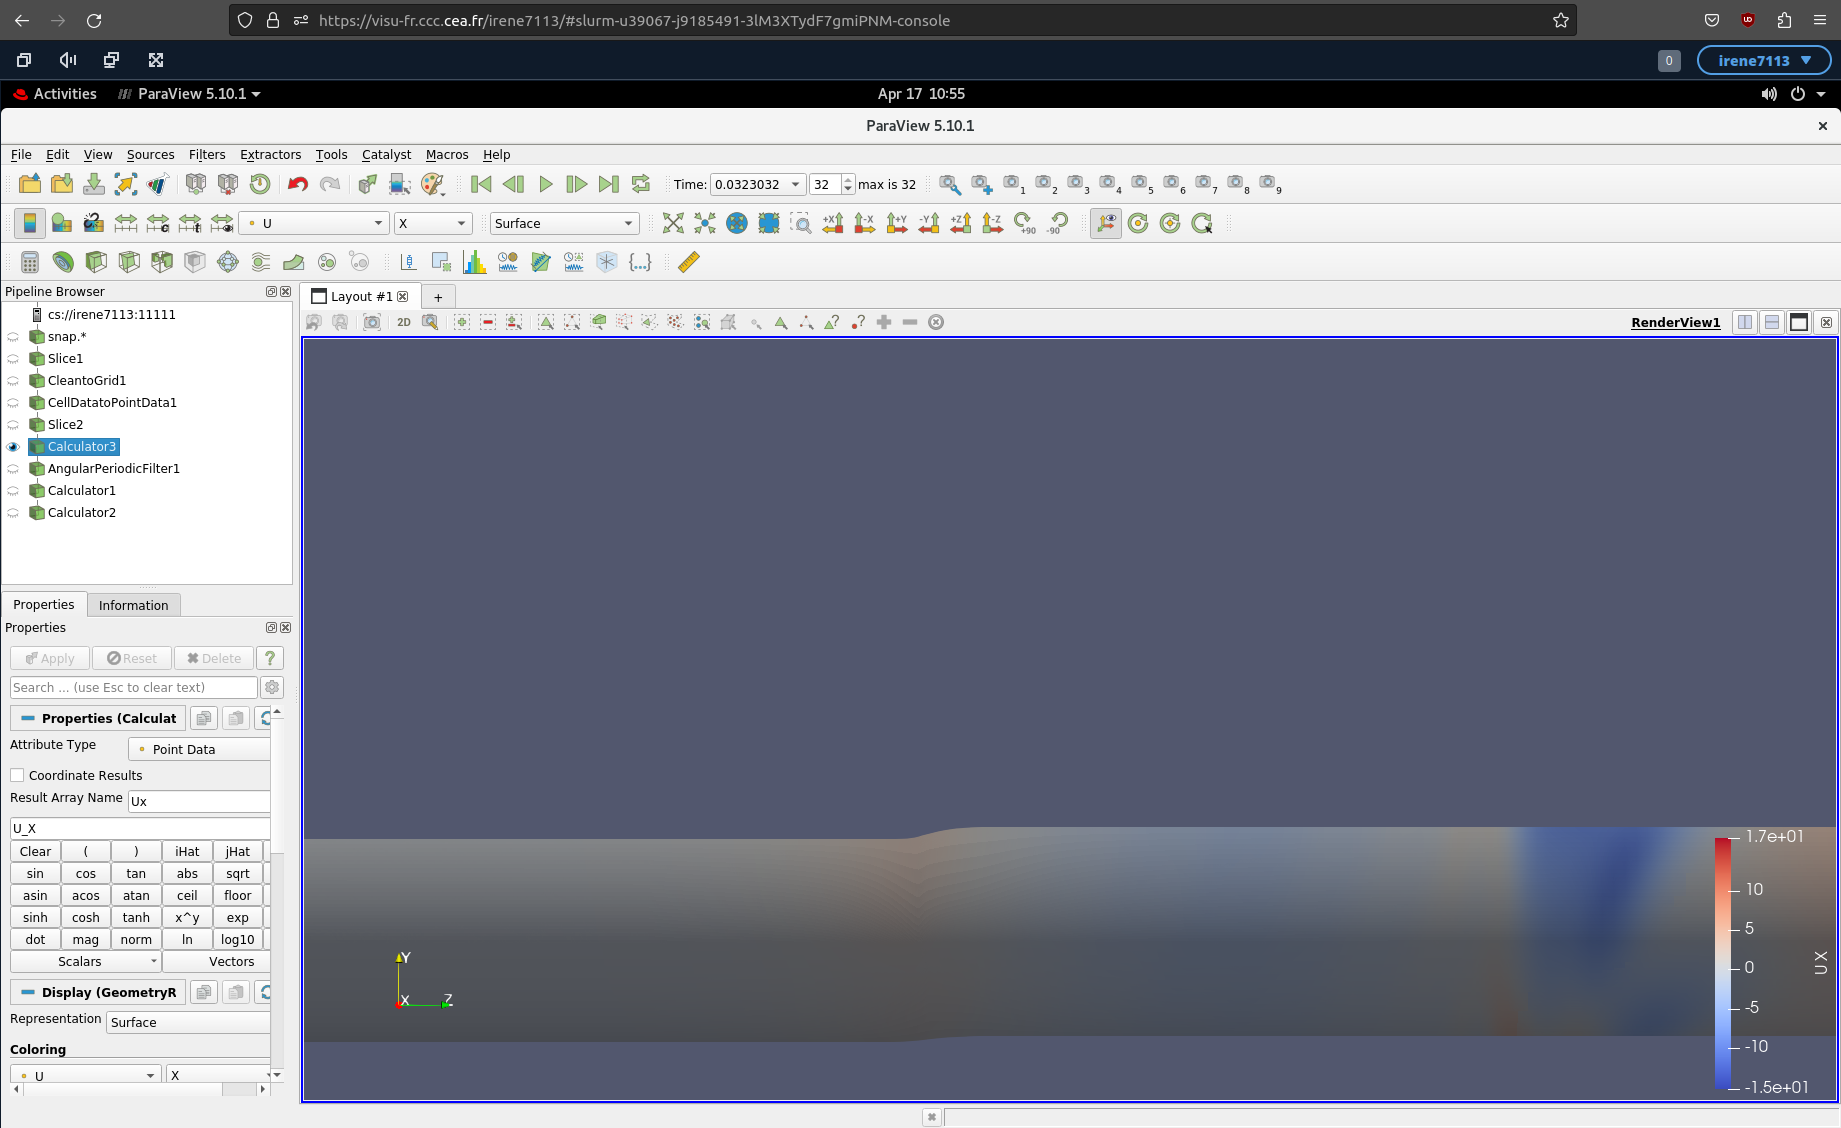
I am having problems to properly visualise a 3D vector (namely, the velocity) field in ParaView. If I select one of the components from the vector, I get the following view:
However, if I create a new array using the Calculator Filter, which is just the same component of the same vector, I get the following view (for the very same time step):
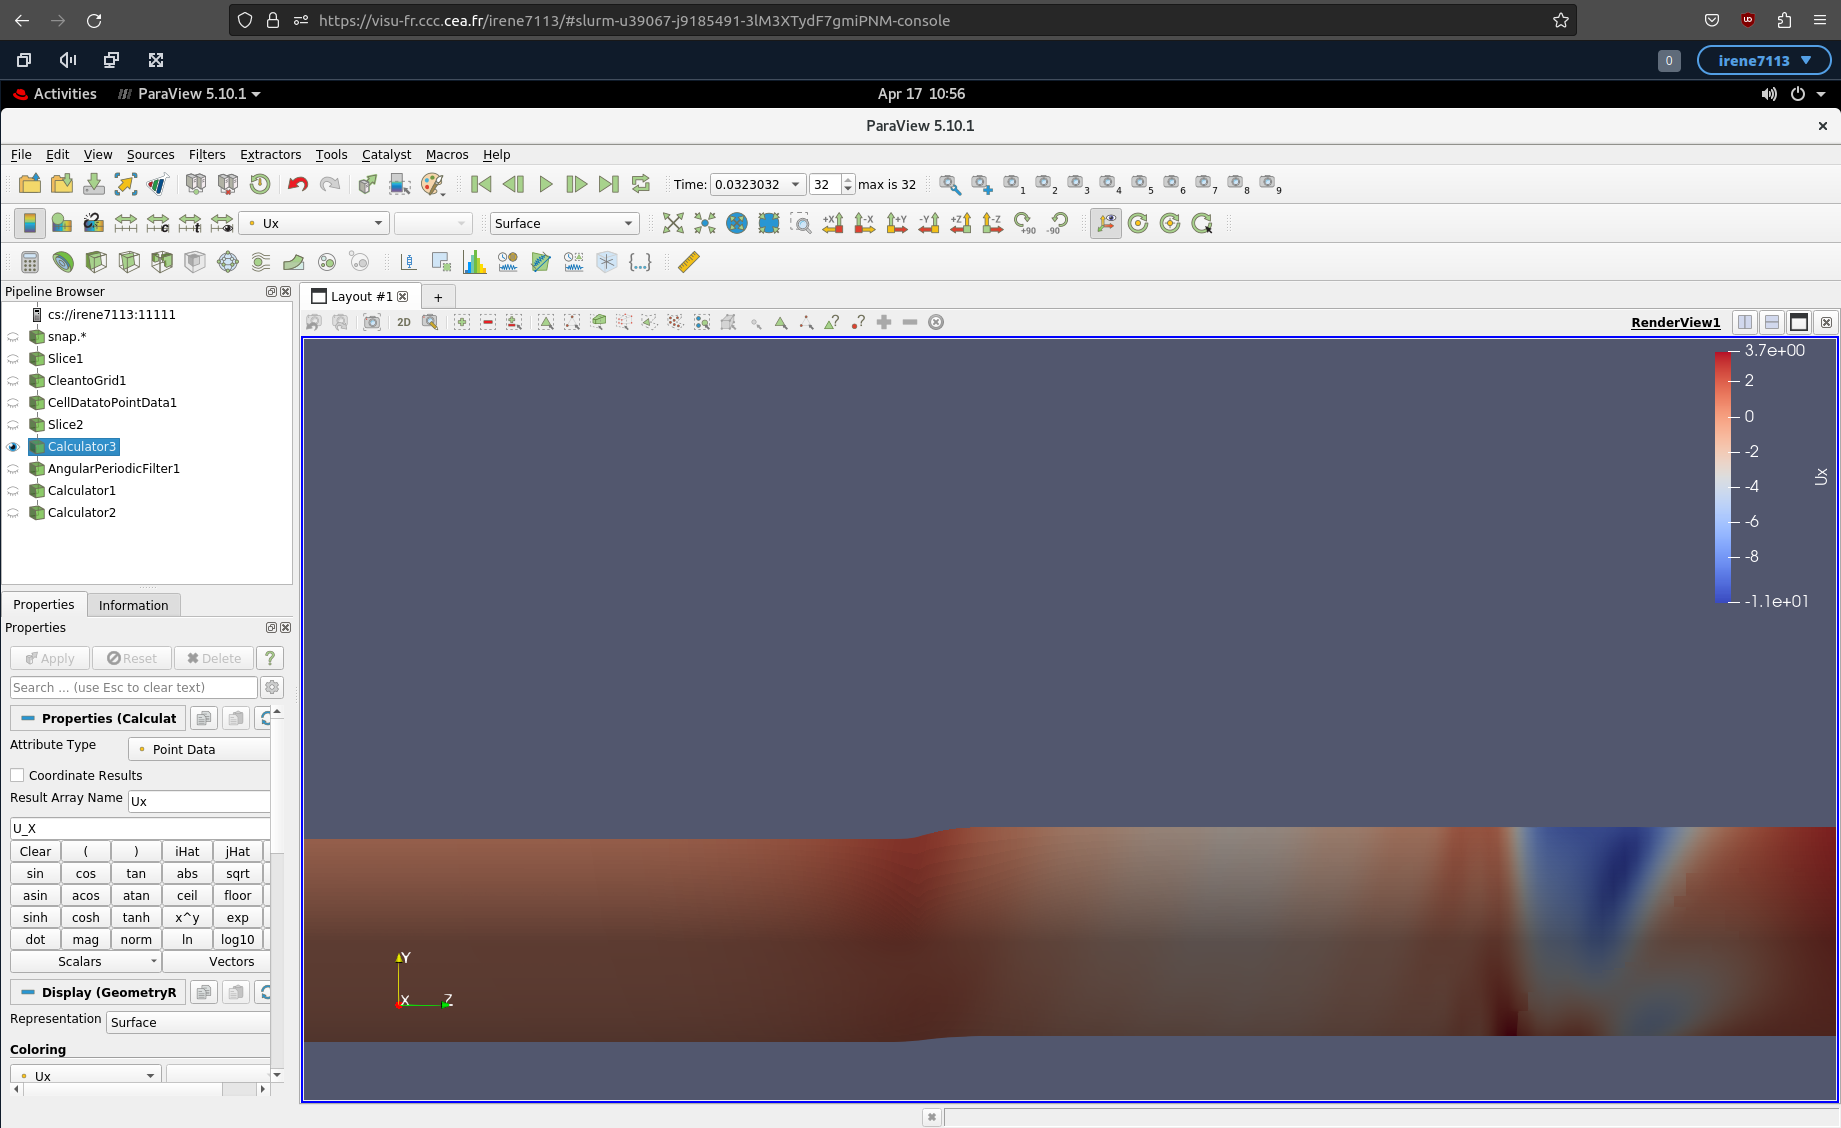
Am I doing something wrong? Is it a bug in the ParaView filters’ pipelining?
Thanks a lot,
---
### Author:  [@Kenneth\_Moreland](https://discourse.paraview.org/u/Kenneth_Moreland)
#### Post date: [April 17, 2023, 12:48pm UTC](https://discourse.paraview.org/t/vector-field-visualisation/11904/2 "2023-04-17T12:48:29Z")
It looks like the data is the same, but the color map scaling is different. If you look at the color scale for your first image (the one showing the `X` component of the `U` vectors), you will see that it goes from -15 to 17.
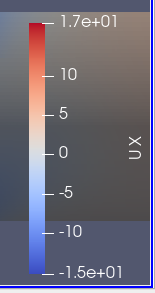
In comparison, the color scale for the output of the field from the `Calculator` filter goes from -11 to 3.7.
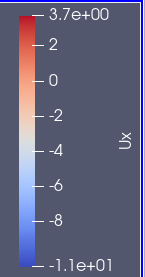
Because the output of the calculator filter is narrower, you are seeing more detail. Try using the `Rescale to Data Range`  or `Rescale to Custom Range`  to get the ranges to match up.
I can’t say for sure why ParaView scaled the two fields differently, but it might have been that you ran an animation showing one but not the other.
---
### Author:  [@Rigel](https://discourse.paraview.org/u/Rigel)
#### Post date: [April 17, 2023, 3:20pm UTC](https://discourse.paraview.org/t/vector-field-visualisation/11904/3 "2023-04-17T15:20:24Z")
Thank you very much Kenneth for your reply. Indeed, the color scales are different; but I clicked on `Rescale to Data Range` before producing the pictures above. In fact, this is the “natural” scaling applied by ParaView when selecting the desired data array (none of the pictures come from an animation).
---
### Author:  [@Kenneth\_Moreland](https://discourse.paraview.org/u/Kenneth_Moreland)
#### Post date: [April 17, 2023, 3:37pm UTC](https://discourse.paraview.org/t/vector-field-visualisation/11904/4 "2023-04-17T15:37:04Z")
What happens when you click on the `Rescale to Visible Data Range`  on each?
---
### Author:  [@Rigel](https://discourse.paraview.org/u/Rigel)
#### Post date: [April 18, 2023, 8:08am UTC](https://discourse.paraview.org/t/vector-field-visualisation/11904/5 "2023-04-18T08:08:44Z")
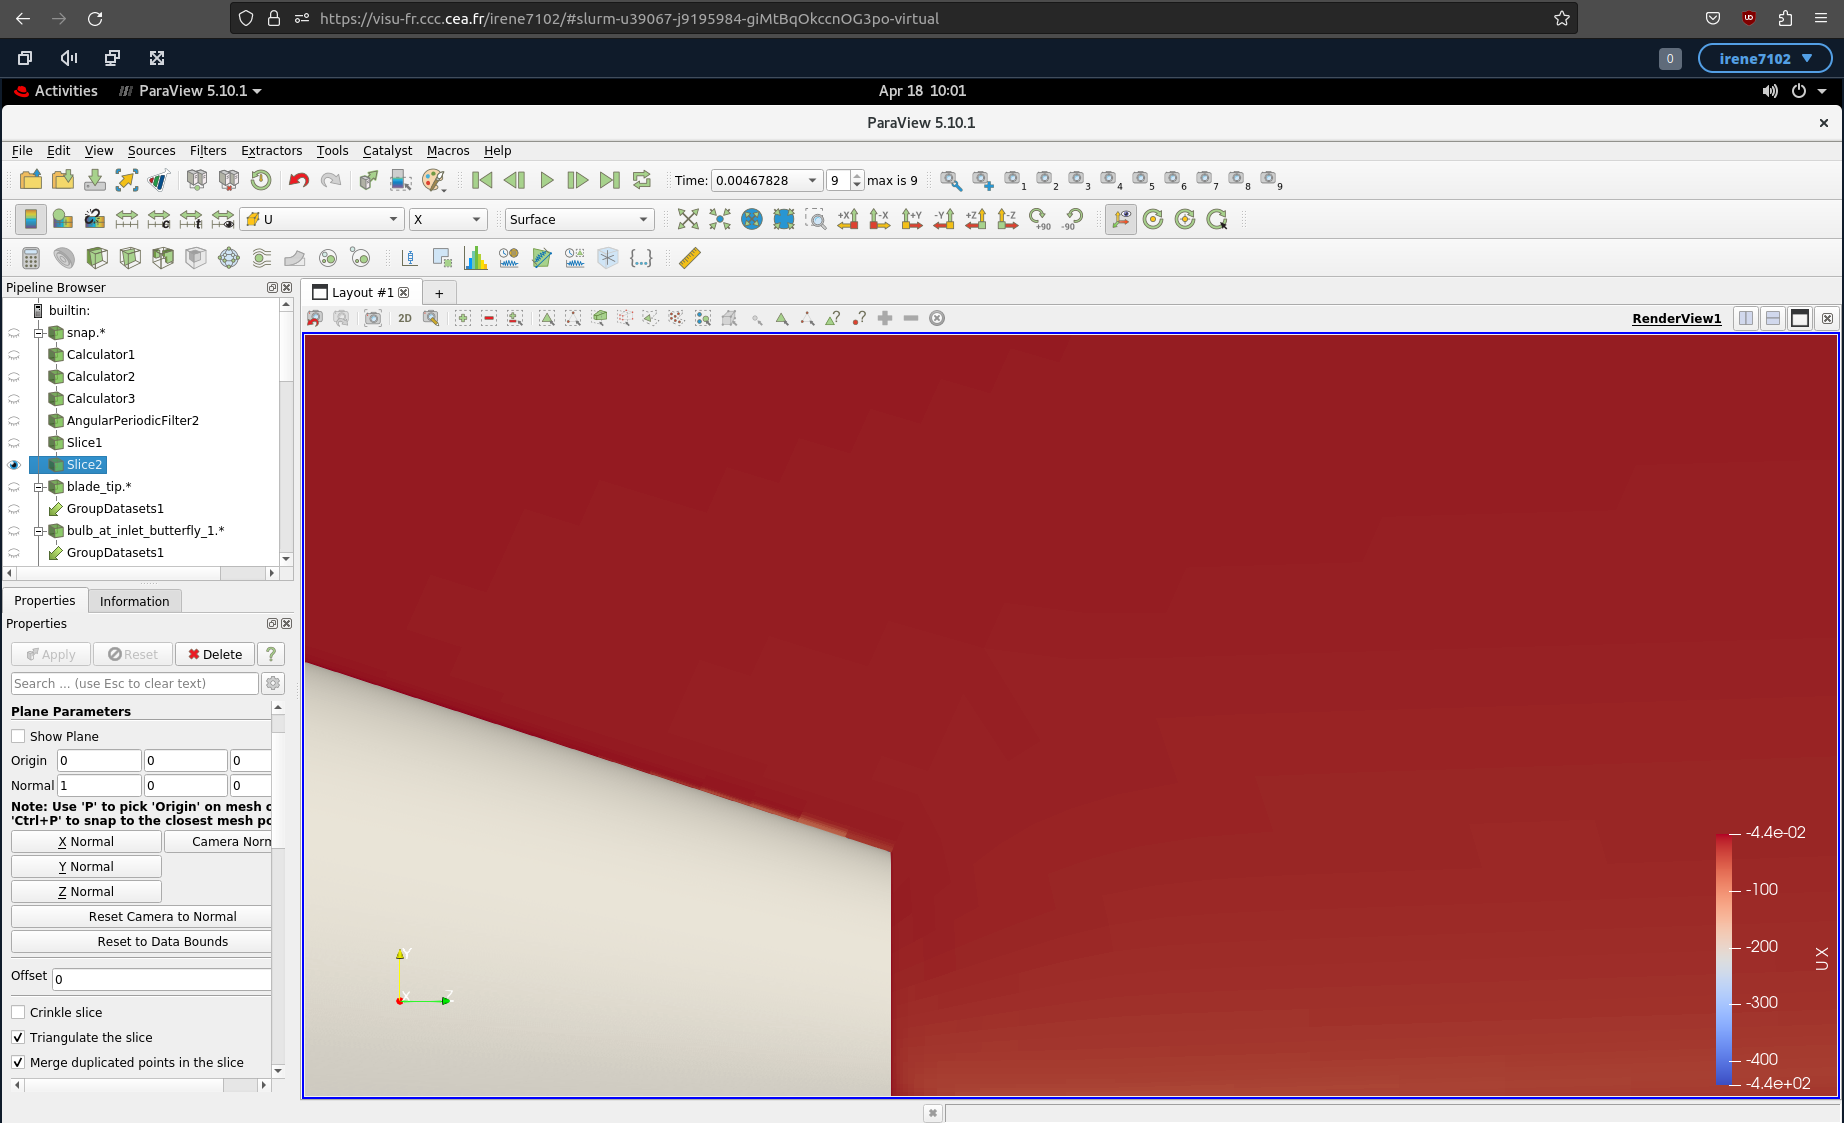
Same problem. For example, here in another data set (from another simulation in another geometry): component _x_ of vector:
Same component, but extracted with a Calculator Filter:
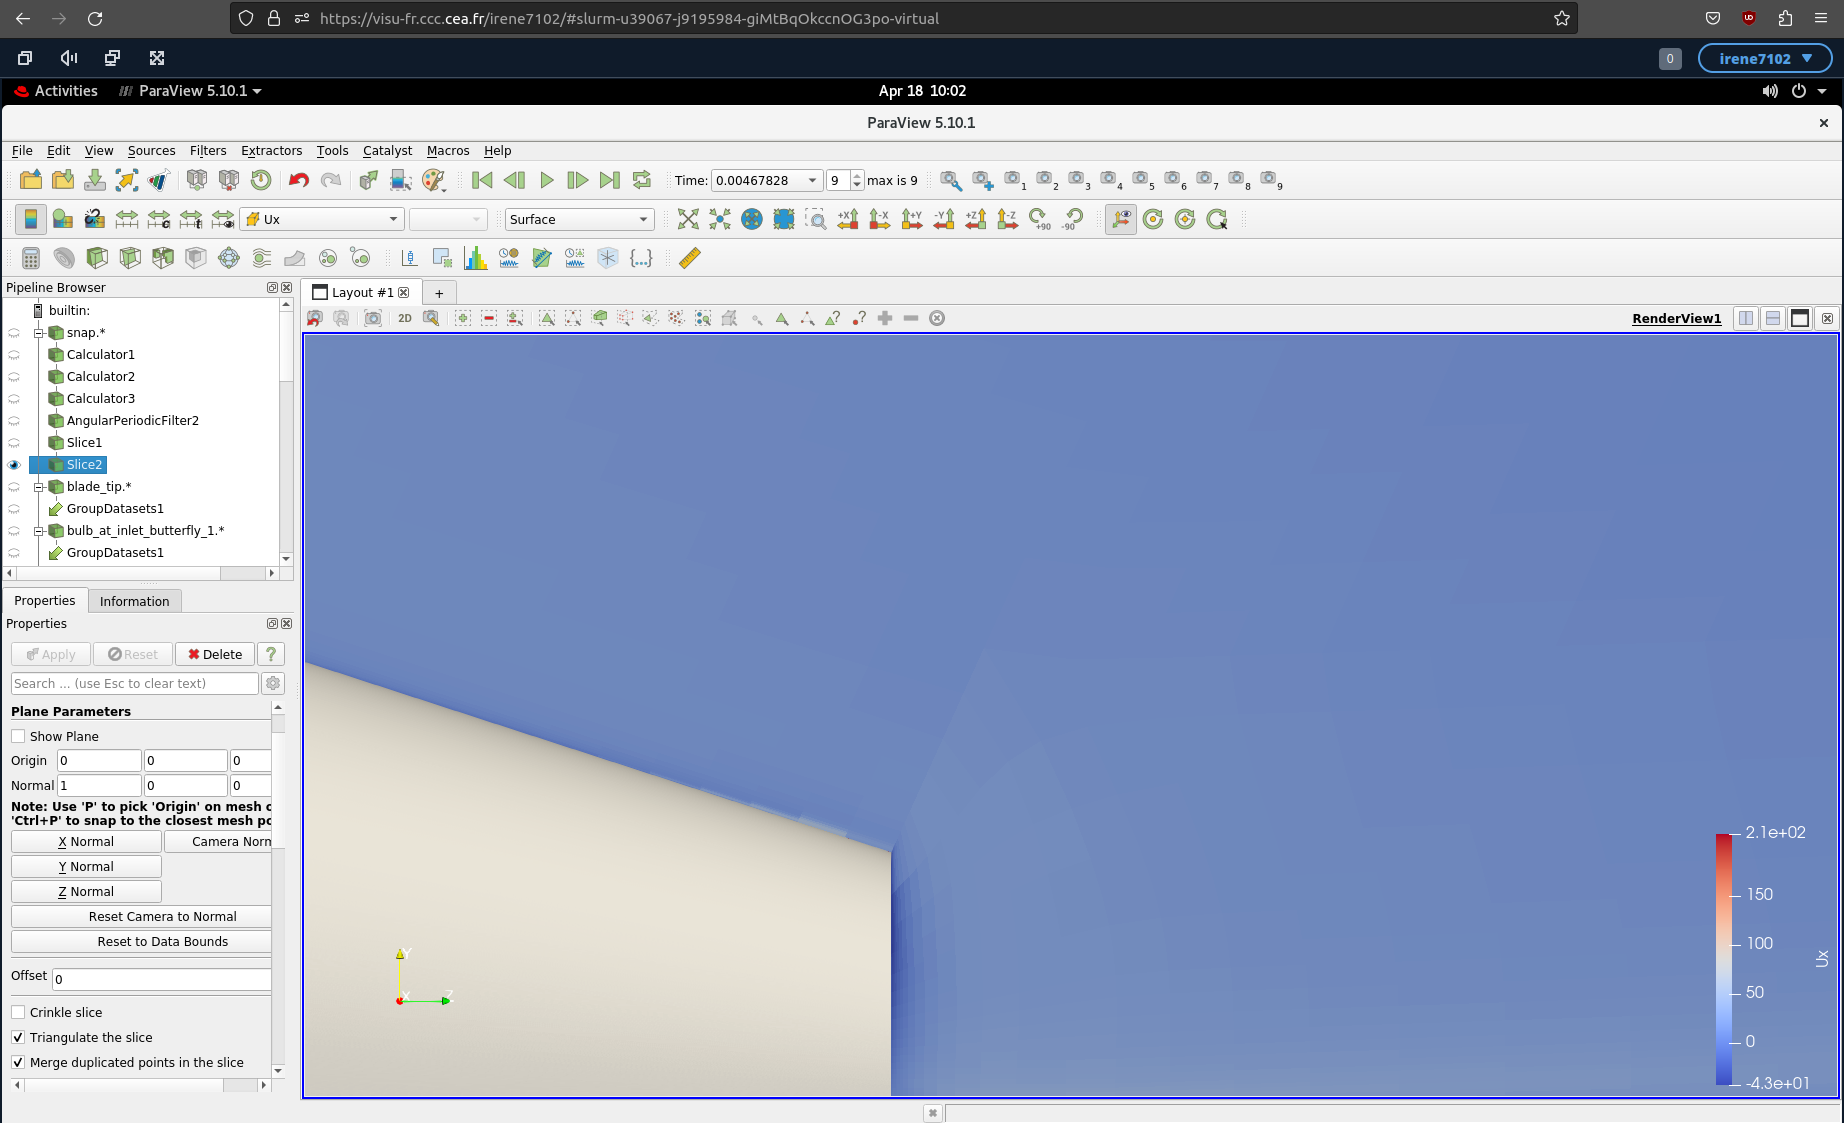
I clicked on `Rescale to Visible Data Range` before producing the snapshots.
We can see that in both cases I presented there is the application of Slices. Not sure if it is related to the issue…