# Vector plot
**URL:** https://discourse.paraview.org/t/vector-plot/4603
**Category:** ParaView Support
**Created:** [June 17, 2020, 6:50am UTC](https://discourse.paraview.org/t/vector-plot/4603 "2020-06-17T06:50:35Z")
**Posts on this page:** 8
**Page:** 1
### Author:  [@Beer](https://discourse.paraview.org/u/Beer)
#### Post date: [June 17, 2020, 6:50am UTC](https://discourse.paraview.org/t/vector-plot/4603/1 "2020-06-17T06:50:35Z")
I have the coordinates of points and the vector data (x,y,z components) at these points in tecplot data format. How can I produce a nice looking vector plot.
---
### Author:  [@cory.quammen](https://discourse.paraview.org/u/cory.quammen)
#### Post date: [June 17, 2020, 2:31pm UTC](https://discourse.paraview.org/t/vector-plot/4603/2 "2020-06-17T14:31:29Z")
The **Glyph** filter will place a glyph at each point, oriented by a vector array that you choose.
---
### Author:  [@Beer](https://discourse.paraview.org/u/Beer)
#### Post date: [June 20, 2020, 12:44pm UTC](https://discourse.paraview.org/t/vector-plot/4603/3 "2020-06-20T12:44:18Z")
Sorry I am new to Paraview. What is meant by “oriented by a vector array” and how do I choose it. My data is like this:
TITLE= “Para”
VARIABLES= “X”, “Y”, “Z”, “Vx”, “Vy”, “Vz”
ZONE T= "Zone 1 ", I= 1 , J= 2 , F=POINT
1.000000 0.000000 0.000000 0.198835 1.429657 -0.000233
1.000000 0.000000 0.000000 -0.198835 -1.429657 0.000233
Thank you for your patience.
---
### Author:  [@cory.quammen](https://discourse.paraview.org/u/cory.quammen)
#### Post date: [June 22, 2020, 12:46am UTC](https://discourse.paraview.org/t/vector-plot/4603/4 "2020-06-22T00:46:47Z")
Hi Beer,
I highly recommend that new ParaView users go through the [ParaView Tutorial](https://www.paraview.org/paraview-downloads/download.php?submit=Download&version=v5.8&type=data&os=Sources&downloadFile=ParaViewTutorial-5.8.1.pdf). It covers a number of filters useful to you and will answer many questions you may have.
It appears that your dataset has three data arrays that define the separate components of a vector data array. You’ll need to perform an intermediate step to turn those components into a 3-component data array before it can be used as the orientation array in the **Glyph** filter. Please see this [ParaView FAQ entry](https://discourse.paraview.org/t/how-do-i-use-three-different-arrays-as-components-of-one-vector-field/4637) for how to do that.
---
### Author:  [@Beer](https://discourse.paraview.org/u/Beer)
#### Post date: [June 22, 2020, 7:28am UTC](https://discourse.paraview.org/t/vector-plot/4603/5 "2020-06-22T07:28:46Z")
Thank you for your help.
---
### Author:  [@MatsievskiySV](https://discourse.paraview.org/u/MatsievskiySV)
#### Post date: [May 5, 2021, 9:46am UTC](https://discourse.paraview.org/t/vector-plot/4603/6 "2021-05-05T09:46:20Z")
How do I merge scalar arrays into vector array if each component is loaded into separate block? `VX*iHat + VY*jHat + VZ*kHat` [expression from FAQ](https://discourse.paraview.org/t/how-do-i-use-three-different-arrays-as-components-of-one-vector-field/4637) does not produce any output and does not throw any errors in this case (expressions like `VX*iHat + 0*jHat + 0*kHat` or `VX*iHat + VX*jHat + 0*kHat` work just fine).
---
### Author:  [@wascott](https://discourse.paraview.org/u/wascott)
#### Post date: [May 5, 2021, 3:42pm UTC](https://discourse.paraview.org/t/vector-plot/4603/7 "2021-05-05T15:42:04Z")
Try the Merge Blocks filter. However, I suspect that the reason you get nothing back is that VX is on one block of cells, VY or VZ are on a different block with different cells. You must have VX, VY and VZ on the same cells to create a vector.
---
### Author:  [@MatsievskiySV](https://discourse.paraview.org/u/MatsievskiySV)
#### Post date: [May 5, 2021, 7:24pm UTC](https://discourse.paraview.org/t/vector-plot/4603/8 "2021-05-05T19:24:44Z")
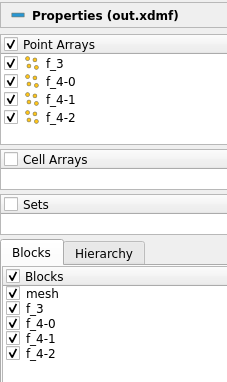
My data layout is presented in picture below, field components are named `f_`.
MergeBlocks filter only has two options:
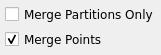
I tried all combinations of those and didn’t get the desired result.
PS. I used Dolfin-X function [`XDMFFile.write_function`](https://docs.fenicsproject.org/dolfinx/main/python/generated/dolfinx.io.html#dolfinx.io.XDMFFile.write_function) function to create the XDMF file.