# Velocity Gradient Visual
**URL:** https://discourse.paraview.org/t/velocity-gradient-visual/14578
**Category:** ParaView Support
**Created:** [May 7, 2024, 4:26pm UTC](https://discourse.paraview.org/t/velocity-gradient-visual/14578 "2024-05-07T16:26:28Z")
**Posts on this page:** 4
**Page:** 1
### Author:  [@suzanmn](https://discourse.paraview.org/u/suzanmn)
#### Post date: [May 7, 2024, 4:26pm UTC](https://discourse.paraview.org/t/velocity-gradient-visual/14578/1 "2024-05-07T16:26:28Z")
I have a CSV file with comma separated coordinates and a velocity vector of the form: X, Y, Z, Vx, Vy, Vz similar to this post [Creating vector field from csv data](https://discourse.paraview.org/t/creating-vector-field-from-csv-data/4109). I can use the `table to points` filter with XYZ coordinates, use `merge vector components` filter to merge Vx, Vy, Vz into velocity vector, and then use `glyph` filter to visualize the velocity vectors at each point. However, I want to create a 3D contour using the velocity vector and points or a 2D contour using the YZ vectors and points. Is this possible with this data format?
---
### Author:  [@Christos\_Tsolakis](https://discourse.paraview.org/u/Christos_Tsolakis)
#### Post date: [May 7, 2024, 6:16pm UTC](https://discourse.paraview.org/t/velocity-gradient-visual/14578/2 "2024-05-07T18:16:24Z")
you should be able to use the `Table to Structured Grid` filter as suggested in the previous thread and apply the contour filter on in.
If not could you share some example data ?
---
### Author:  [@suzanmn](https://discourse.paraview.org/u/suzanmn)
#### Post date: [May 7, 2024, 7:06pm UTC](https://discourse.paraview.org/t/velocity-gradient-visual/14578/3 "2024-05-07T19:06:22Z")
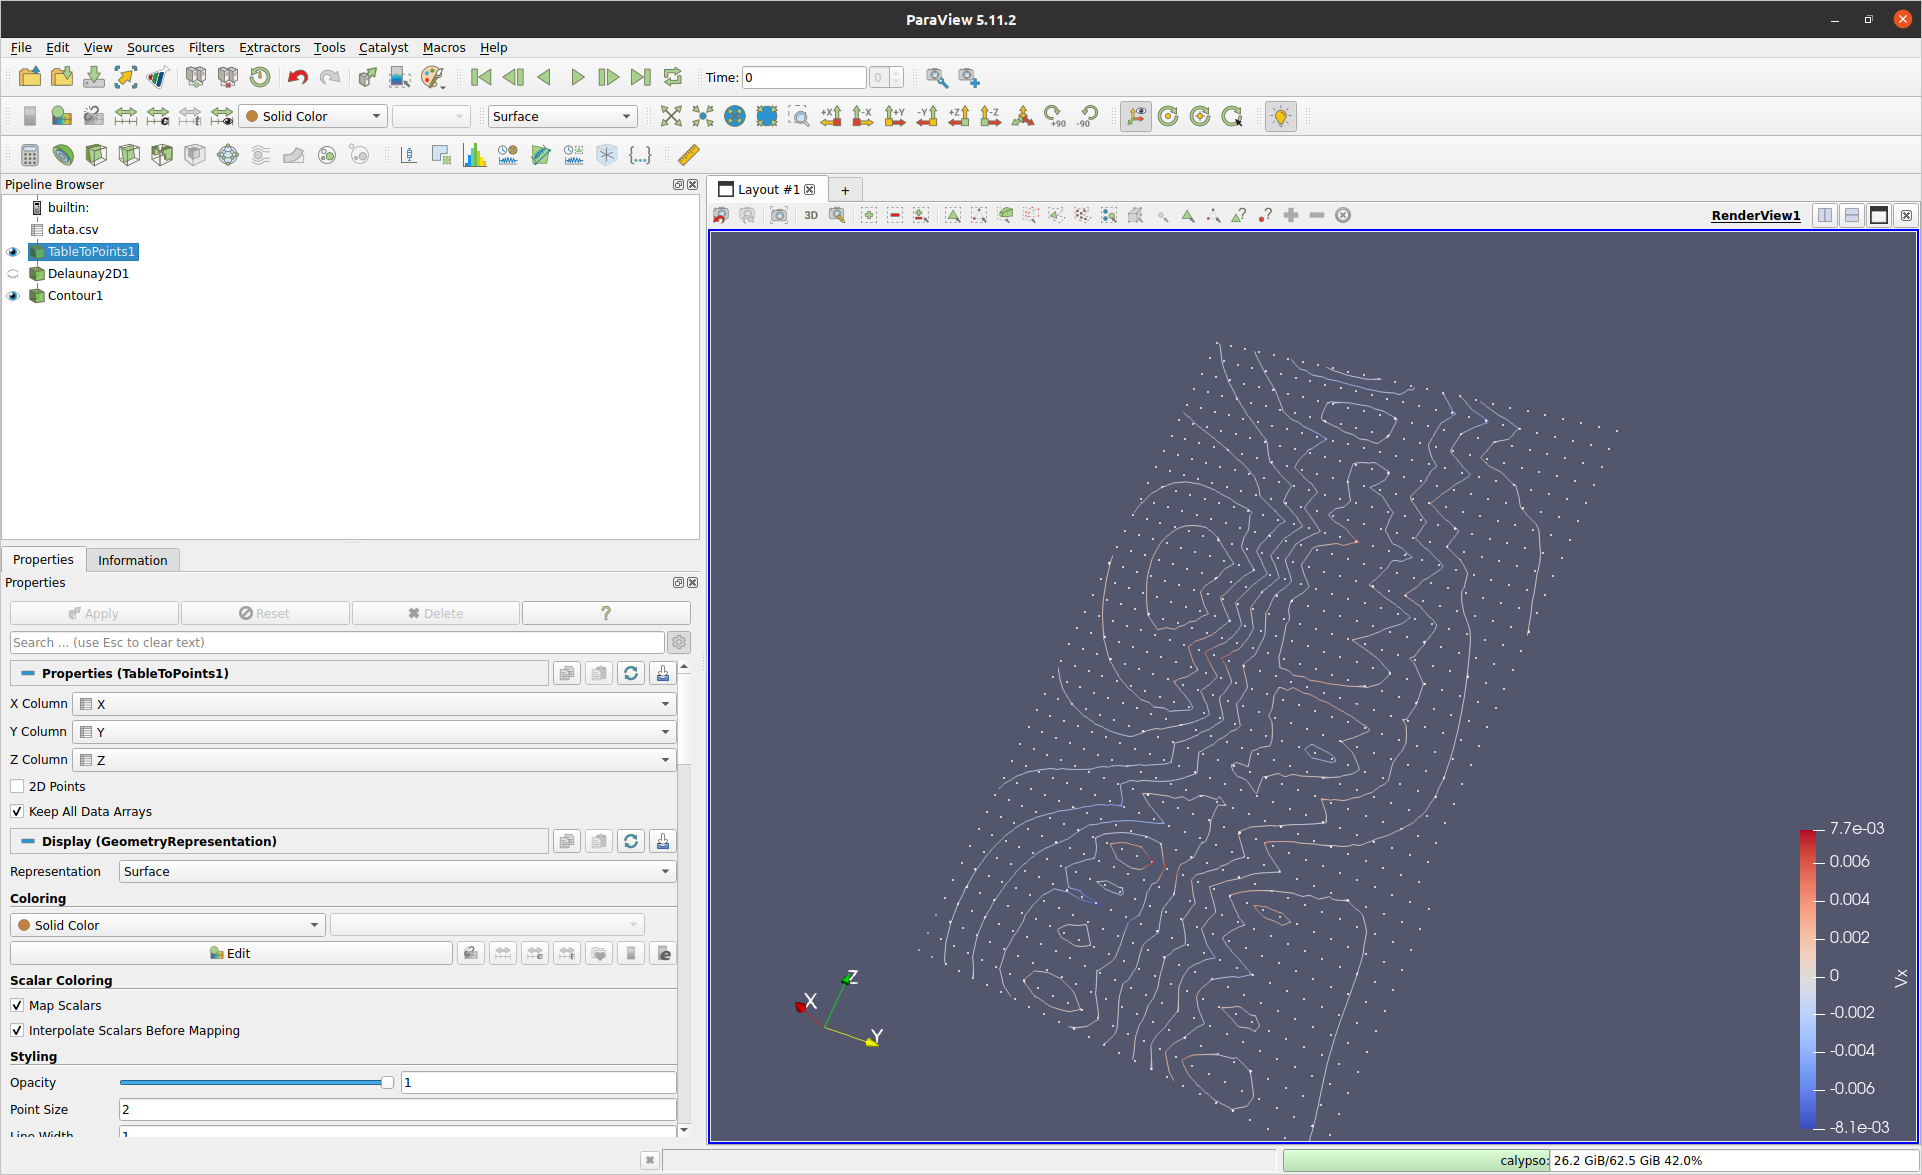
When I apply `Table to Points` and then the `Contour` filter with `compute gradients` checked and contour by `Vz`, I don’t see any visual appear. I’ll try to see if `Table to Structured Grid` works with contours, but I haven’t been able to so far. Here is an example of what a section of the data looks like.
[data.csv](https://discourse.paraview.org/uploads/short-url/ggwaTu9CSAv9JjUES6H1iKry4UF.csv) (163.3 KB)
---
### Author:  [@Christos\_Tsolakis](https://discourse.paraview.org/u/Christos_Tsolakis)
#### Post date: [May 7, 2024, 8:05pm UTC](https://discourse.paraview.org/t/velocity-gradient-visual/14578/4 "2024-05-07T20:05:45Z")
Thank you for sharing the data!
Indeed the `Table to Points ` is the right filter for the first step based on your data.
Before you can apply contour you would need to have a mesh connecting the points.
Since the points fit on a plane you can use the `Delaunay2D` filter using `Best-Fitting Plane` as projection Plane mode and then apply the contour on the output of it.