# Visualisation of xdmf file
**URL:** https://discourse.paraview.org/t/visualisation-of-xdmf-file/15684
**Category:** ParaView Support
**Tags:** python
**Created:** [November 5, 2024, 10:04am UTC](https://discourse.paraview.org/t/visualisation-of-xdmf-file/15684 "2024-11-05T10:04:01Z")
**Posts on this page:** 3
**Page:** 1
### Author:  [@jz97x](https://discourse.paraview.org/u/jz97x)
#### Post date: [November 5, 2024, 10:04am UTC](https://discourse.paraview.org/t/visualisation-of-xdmf-file/15684/1 "2024-11-05T10:04:01Z")
Hello everyone,
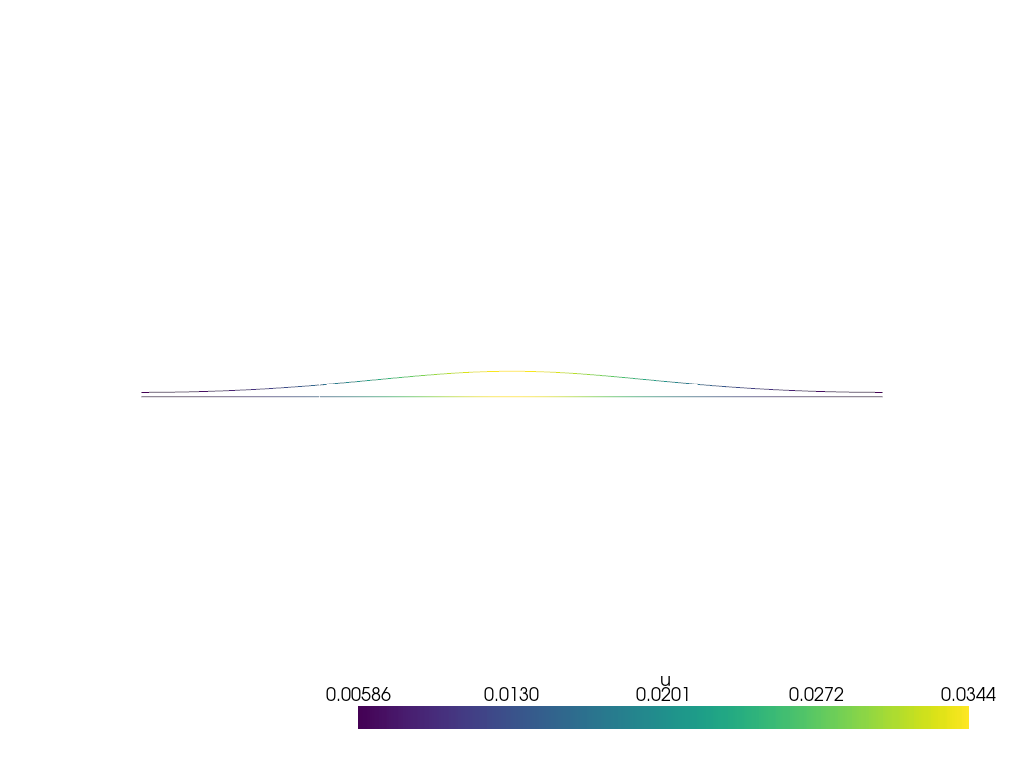
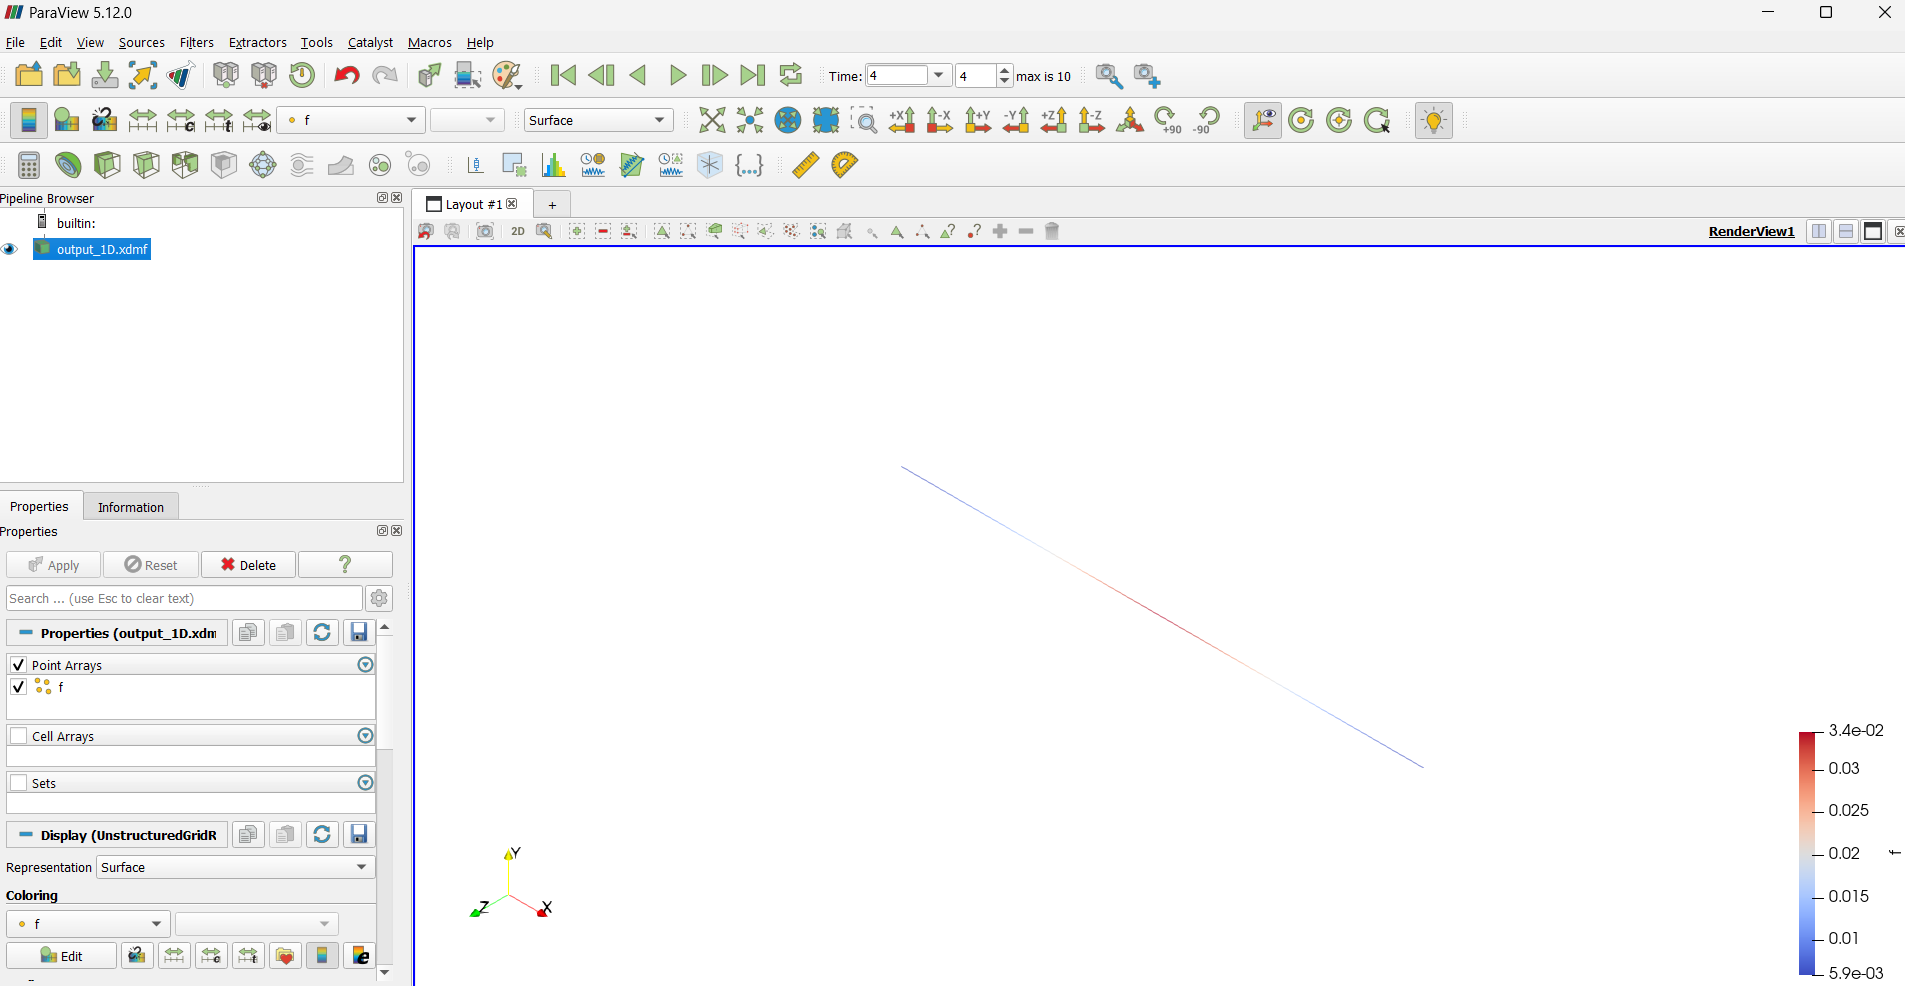
I am currently working on a simulation of a reaction-diffusion equation in one dimension implemented in python using FEniCSx. For sake of simplicity, I am simulating 10 time steps and save the result as an .xmdf file. Alternatively, I am saving each time step of the solution as an .png using pyvista. Analysing these plots, the diffusive beahvior of the model can be seen very good along the given axis. When loading the .xdmf file in ParaView, I only see a straight line (as this is my generated mesh) and a change of the color on this line as the time continues, which also describes the diffusion process. Is it possible to see the wave-like behavior also in ParaView as I do in pyvista? Attached an image of the pyvista output and an image of the applyed xdmf in ParaView.
Thanks, Julian
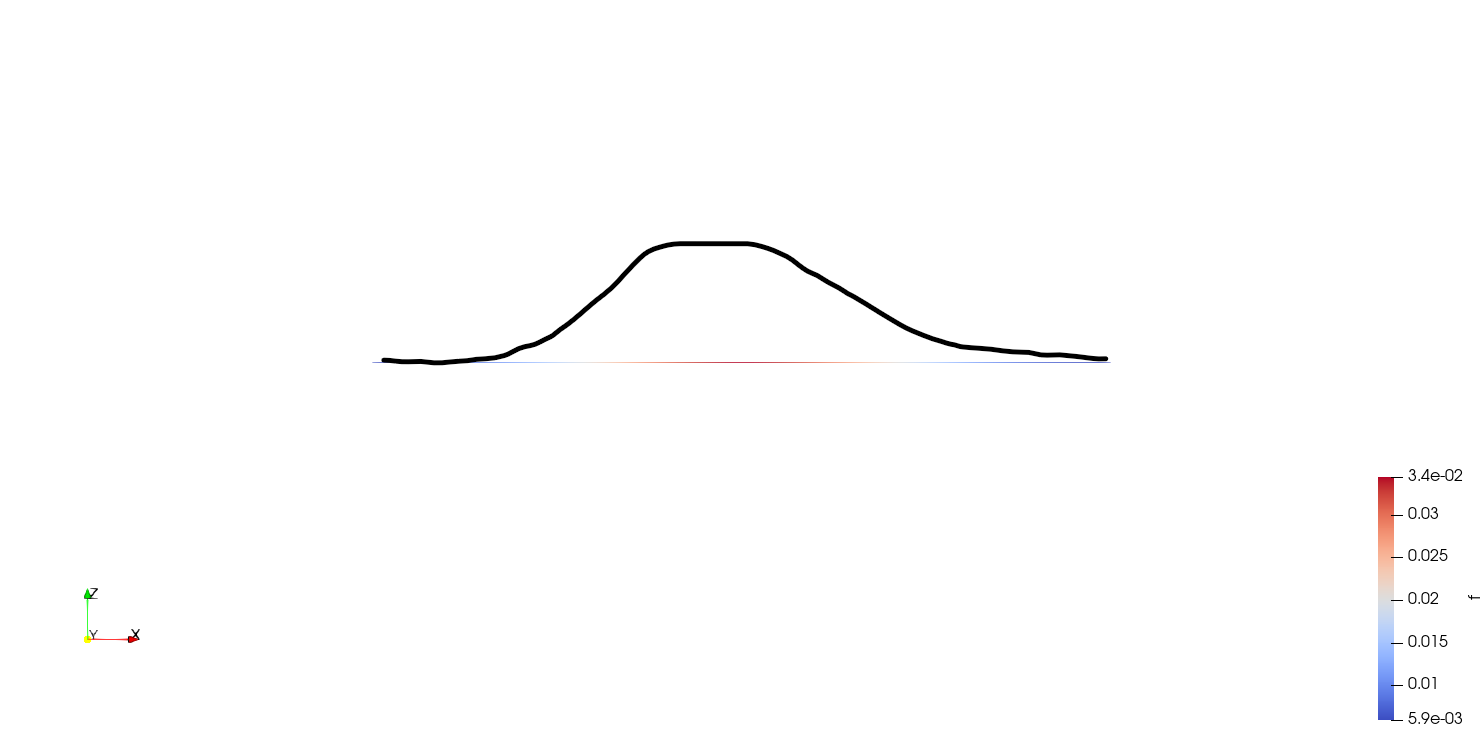
In a nutshell:
I want to see the behavior of the diffusion in ParaView as something like this for example:
---
### Author:  [@nicolas.vuaille](https://discourse.paraview.org/u/nicolas.vuaille)
#### Post date: [November 5, 2024, 10:46am UTC](https://discourse.paraview.org/t/visualisation-of-xdmf-file/15684/2 "2024-11-05T10:46:39Z")
You can try the `WarpByScalar` filter: this moves points according to a data array.
---
### Author:  [@jz97x](https://discourse.paraview.org/u/jz97x)
#### Post date: [November 5, 2024, 10:49am UTC](https://discourse.paraview.org/t/visualisation-of-xdmf-file/15684/3 "2024-11-05T10:49:15Z")
That was exactly the thing i needed. Many thanks!