# Visualization of data using Paraview
**URL:** https://discourse.paraview.org/t/visualization-of-data-using-paraview/4703
**Category:** ParaView Support
**Created:** [June 28, 2020, 1:30pm UTC](https://discourse.paraview.org/t/visualization-of-data-using-paraview/4703 "2020-06-28T13:30:11Z")
**Posts on this page:** 19
**Page:** 1
### Author:  [@Deepa](https://discourse.paraview.org/u/Deepa)
#### Post date: [June 28, 2020, 1:30pm UTC](https://discourse.paraview.org/t/visualization-of-data-using-paraview/4703/1 "2020-06-28T13:30:11Z")
Hello Everyone,
I have a parameter data `paramData`, obtained from a simulation, for certain xyz coordinates of a geometry like the following
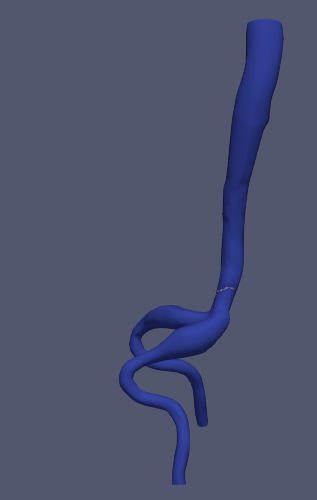
The 3D volume is available in an STL file. The parameter data and the coordinates are generated from python and saved in spreadsheets. For instance, the parameter could be pressure or temperature, both static and dynamic data are available. The size of `paramData` is equal to the size of coordinates array.
I could load the stl geomety in Paraview. I am not sure how to proceed next. For instance, when I import a vtp file, the geometry can be colored by selecting the cell data array using which the geometry will be colored. Now, I don’t have the `paramData` in a vtp file. I would like to know if the data should first be stored in a vtk array or is there an option to directly import the coordinate file and the scalar field data.
Any suggestions on how to proceed will be of great help
Deepa
---
### Author:  [@mwestphal](https://discourse.paraview.org/u/mwestphal)
#### Post date: [June 29, 2020, 3:25am UTC](https://discourse.paraview.org/t/visualization-of-data-using-paraview/4703/2 "2020-06-29T03:25:35Z")
- Open your stl
- Open your parameter file
- Table to points
- Ressample with data
Let us know if you have any questions on how to use any of these filters/readers
---
### Author:  [@Kenneth\_Moreland](https://discourse.paraview.org/u/Kenneth_Moreland)
#### Post date: [June 29, 2020, 1:50pm UTC](https://discourse.paraview.org/t/visualization-of-data-using-paraview/4703/3 "2020-06-29T13:50:14Z")
Good instructions, but you might consider using `Append Attributes` instead of `Resample with Data`. That will probably work better for your data with the same number of values (assuming they are _in the same order_).
---
### Author:  [@mwestphal](https://discourse.paraview.org/u/mwestphal)
#### Post date: [June 29, 2020, 2:03pm UTC](https://discourse.paraview.org/t/visualization-of-data-using-paraview/4703/4 "2020-06-29T14:03:57Z")
Yes indeed !
---
### Author:  [@Deepa](https://discourse.paraview.org/u/Deepa)
#### Post date: [June 29, 2020, 2:14pm UTC](https://discourse.paraview.org/t/visualization-of-data-using-paraview/4703/5 "2020-06-29T14:14:26Z")
@mwestphal @Kenneth_Moreland
Thanks a lot for the instructions.
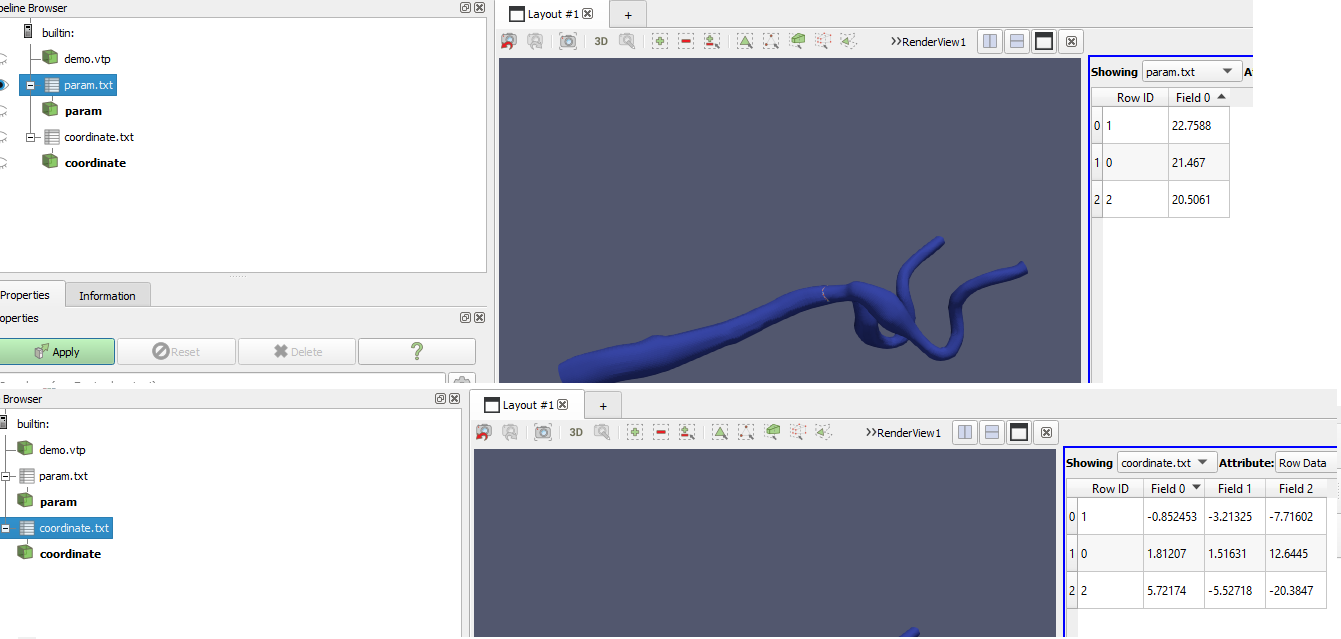
I have imported the field values in `param` and coordinates in two separate files, the values in `param` are in the same order as that of the coordinates. May I know if `Table to points` filter must be used on both?
Would it help if I include both in a single file?
I’d also like to know if the number of points in the `coordinate` table must be equal to the number of points in the geometry (the geometry has ~44k points, but I don’t have the field data at all points).
---
### Author:  [@Deepa](https://discourse.paraview.org/u/Deepa)
#### Post date: [July 1, 2020, 5:42am UTC](https://discourse.paraview.org/t/visualization-of-data-using-paraview/4703/6 "2020-07-01T05:42:54Z")
This is a polite reminder
---
### Author:  [@Kenneth\_Moreland](https://discourse.paraview.org/u/Kenneth_Moreland)
#### Post date: [July 1, 2020, 3:18pm UTC](https://discourse.paraview.org/t/visualization-of-data-using-paraview/4703/7 "2020-07-01T15:18:13Z")
You should only need one csv file. In fact, it is probably not necessary to have the point coordinates anywhere but the stl file if you are using `Append Attributes`. `Table to Points` will want to assign point coordinates, but they will just get ignored by `Append Attributes`.
For the second question, if you are using `Append Attributes`, then yes the number of points in your csv file must be the same as the number of points in your geometry (and in the same order). If you are using `Resample With Dataset`, then you do not need to have the same number of points (but you will need point coordinates). That said, `Resample With Dataset` can get flaky with finding the points (for reasons I won’t get into).
---
### Author:  [@Deepa](https://discourse.paraview.org/u/Deepa)
#### Post date: [July 8, 2020, 7:12am UTC](https://discourse.paraview.org/t/visualization-of-data-using-paraview/4703/8 "2020-07-08T07:12:25Z")
Thanks a lot for the clarification.
I still have a few more questions. I’d like to use Point Volume Interpolator described in the documentation available [here](https://blog.kitware.com/point-and-smoothed-particle-hydrodynamics-sph-interpolation-in-paraview/).
> [@Kenneth\_Moreland](#):
>
> If you are using `Resample With Dataset` , then you do not need to have the same number of points (but you will need point coordinates).
Yes, I don’t have the field values at all points. The values are generated from simulations only at discrete points (x,y,z coordinates defined in the snapshot below)
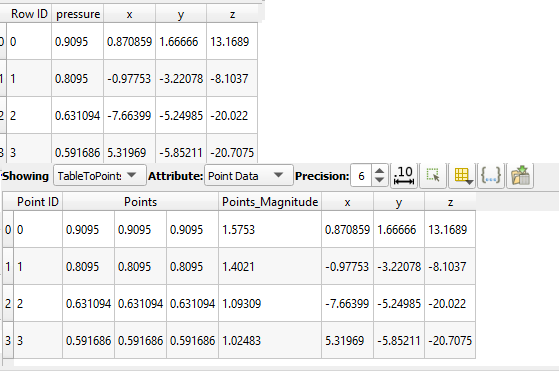
The table on the top is the input data and the table below it has been generated using `Table to points`. But I oculdn’t clearly understand how `Table to points` works and how to use `Resample with Dataset` filter. When I try to seelct `Resample with Dataset` from Add filters tab, `Resample with Dataset` isn’t available for access.
[input](https://github.com/DeepaMahm/misc/blob/master/demo.vtp)
[data](https://github.com/DeepaMahm/misc/blob/master/data.txt)
Could you please offer instructions on how to proceed from here?
cross-posted [here](https://stackoverflow.com/questions/62797530/perform-point-volume-interpolation-in-paraview)
---
### Author:  [@Kenneth\_Moreland](https://discourse.paraview.org/u/Kenneth_Moreland)
#### Post date: [July 8, 2020, 3:16pm UTC](https://discourse.paraview.org/t/visualization-of-data-using-paraview/4703/9 "2020-07-08T15:16:56Z")
I took a look the data you posted. It looks like the points in your text file are nowhere near the surface. Here is a screenshot of what I got. (The spheres are the points from the text data file.)
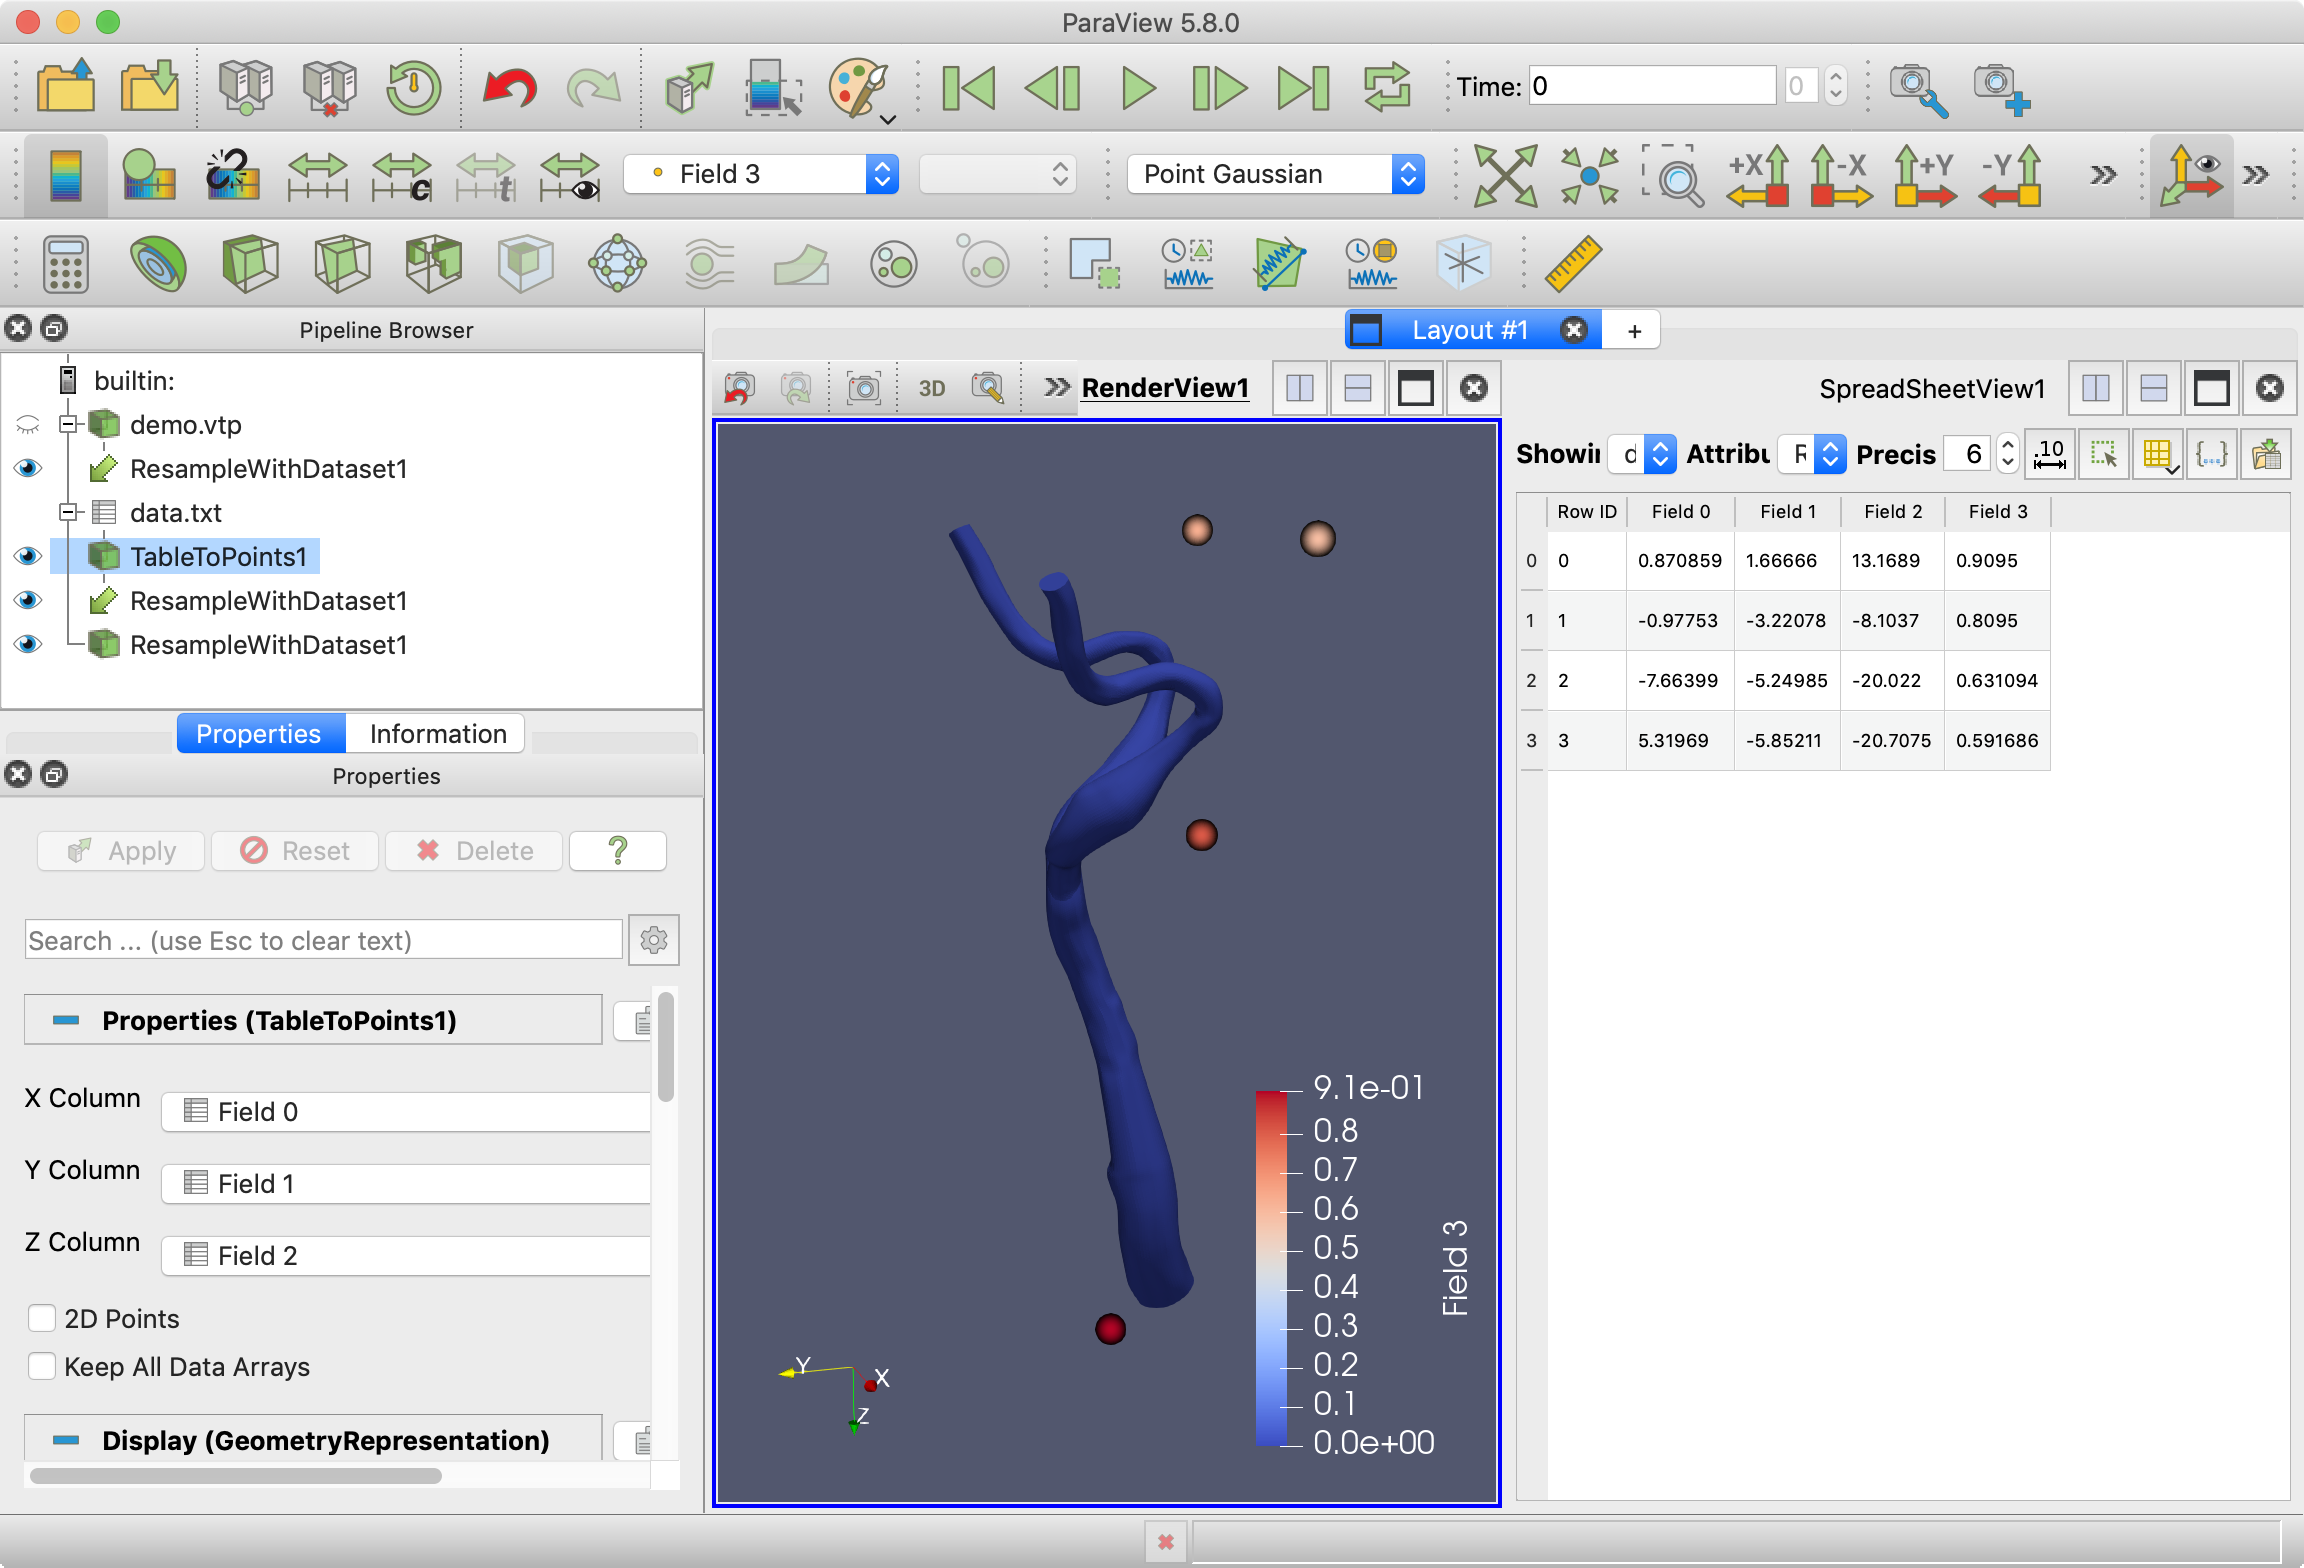
`Resample With Dataset` is seeing that all the points in your surface are nowhere near any of the points from your data file. Thus, the resampling shows that everything is in “empty space” and thus nothing is actually sampled.
Are you sure the points in your text data file are actually on the surface of your stl file?
---
### Author:  [@Deepa](https://discourse.paraview.org/u/Deepa)
#### Post date: [July 8, 2020, 4:15pm UTC](https://discourse.paraview.org/t/visualization-of-data-using-paraview/4703/10 "2020-07-08T16:15:39Z")
Thanks a lot for looking into this.
Could you please have a look at the snapshot shared below?
I find the points on the surface. Three endpoints are displayed in red and their coordinates can be checked in the inset.
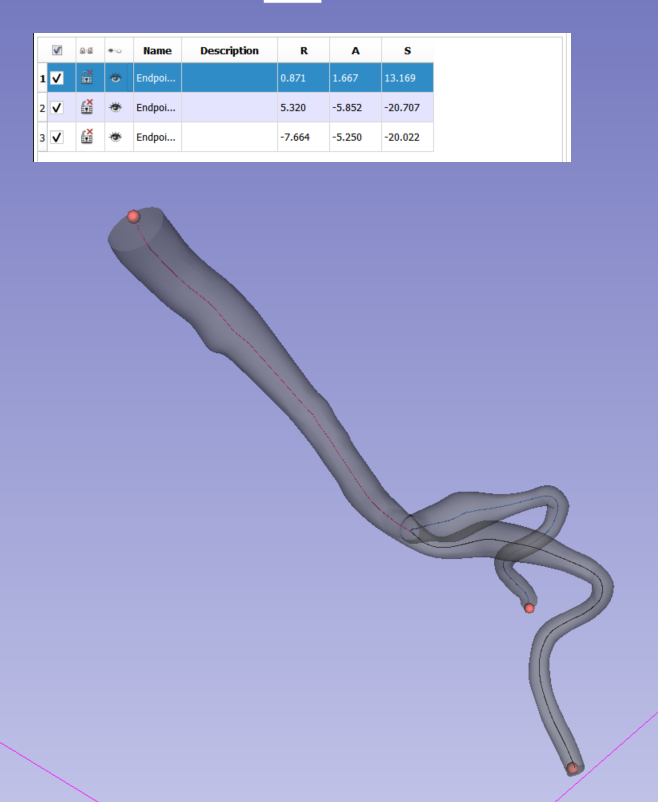
I am not sure why, in Paraview, the points lie away from the surface.
---
### Author:  [@cory.quammen](https://discourse.paraview.org/u/cory.quammen)
#### Post date: [July 8, 2020, 4:23pm UTC](https://discourse.paraview.org/t/visualization-of-data-using-paraview/4703/11 "2020-07-08T16:23:31Z")
Ah, this is medical data. Often medical data is defined in different coordinate systems. Medically oriented applications typically know how to put the data into the same coordinate system, but ParaView does not perform any such transformations.
It looks to me like you will need to reflect at least the y axis. You can do this by applying a Transform filter to the points, and setting the scale factor for y to -1. You may need to also scale x by -1 as well.
---
### Author:  [@Deepa](https://discourse.paraview.org/u/Deepa)
#### Post date: [July 8, 2020, 4:52pm UTC](https://discourse.paraview.org/t/visualization-of-data-using-paraview/4703/12 "2020-07-08T16:52:32Z")
> [@cory.quammen](#):
>
> You can do this by applying a Transform filter to the points, and setting the scale factor for y to -1. You may need to also scale x by -1 as well.
This worked! Thanks a lot.
@Kenneth_Moreland
I tried to proceed with `ResampleWithDataset` selecting Transform node as Source Data Array. However, resampling didn’t complete successfully
`ERROR: In C:\bbd\6c27b535\build\superbuild\paraview\src\VTK\Common\ExecutionModel\vtkExecutive.cxx, line 753 vtkPVCompositeDataPipeline (00000273821859F0): Algorithm vtkPResampleWithDataSet(000002739B7D87C0) returned failure for request: vtkInformation (0000027381CD4DB0)`
I’d like to ask for suggestions on how to resolve this error and map the resulting interpolated values obtained after resampling to 3D volume.
---
### Author:  [@Deepa](https://discourse.paraview.org/u/Deepa)
#### Post date: [July 10, 2020, 10:29am UTC](https://discourse.paraview.org/t/visualization-of-data-using-paraview/4703/13 "2020-07-10T10:29:36Z")
@cory.quammen @Kenneth_Moreland
Any suggestions?
---
### Author:  [@cory.quammen](https://discourse.paraview.org/u/cory.quammen)
#### Post date: [July 10, 2020, 1:08pm UTC](https://discourse.paraview.org/t/visualization-of-data-using-paraview/4703/14 "2020-07-10T13:08:33Z")
Try the **SPH Dataset Interpolator**. This will interpolate the point data onto the surface according to an interpolation kernel you can set. To use it, select your point source, then add the **SPH Dataset Interpolator**. In the dialog that pops up, leave the Input to the selected point source, then click on the **Source** input port on the left. On the right, choose the STL. Click OK and apply. Play with the **Spatial Step** to adjust how the point data is “splatted” onto the STL (bigger values make a bigger splat). HTH.
---
### Author:  [@Deepa](https://discourse.paraview.org/u/Deepa)
#### Post date: [July 10, 2020, 4:24pm UTC](https://discourse.paraview.org/t/visualization-of-data-using-paraview/4703/15 "2020-07-10T16:24:08Z")
Thanks a lot… I could follow the instructions given above and try the SPH Dataset Interpolator. Unfortunately, the interpolated values of pressure are zero at all points. Could you please have a look at the snapshots shared below?
Transform:
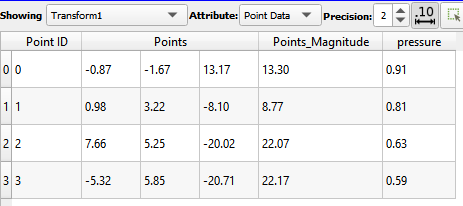
SPH DatasetInterpolator
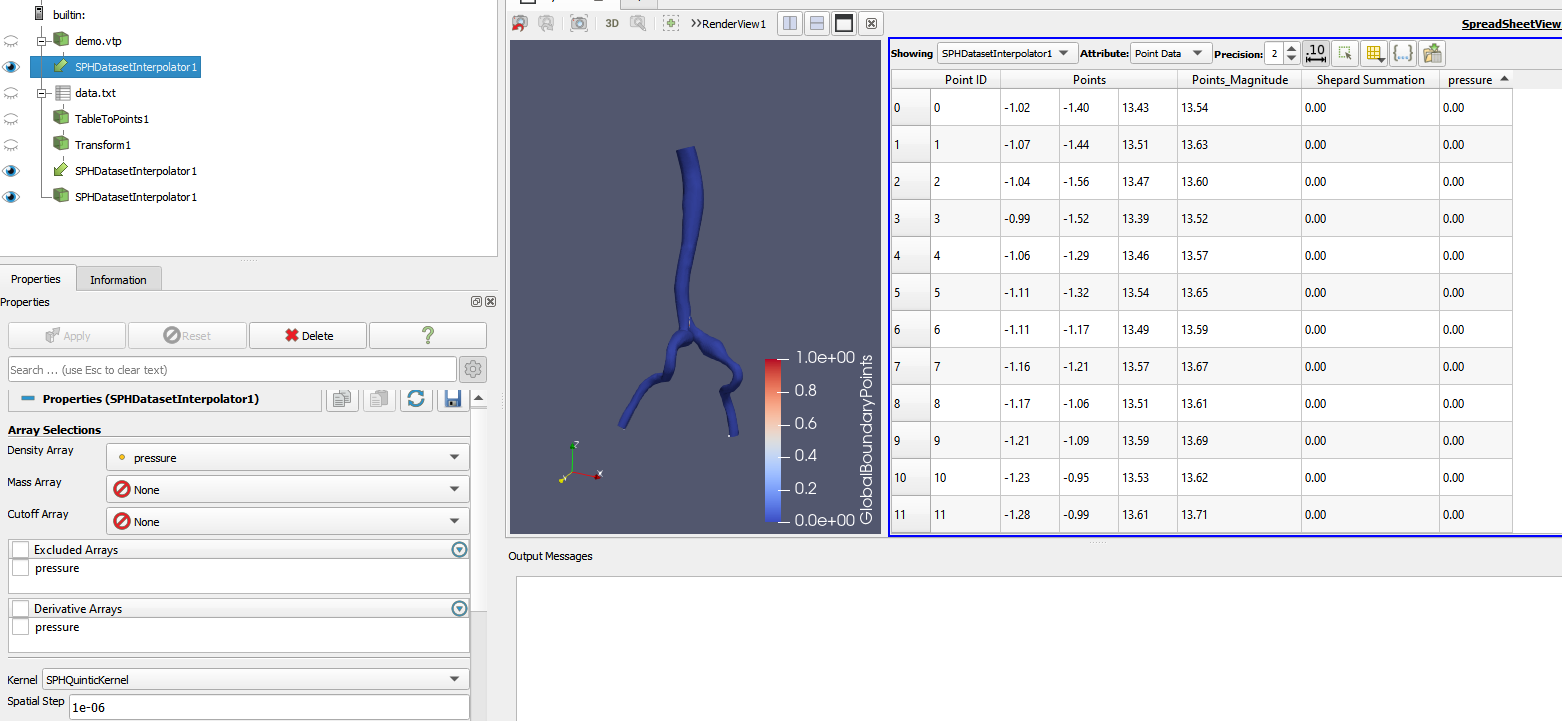
I’ve chosen `Density Array` pressure in `Array Selections`. I am not sure what’s going wrong
---
### Author:  [@cory.quammen](https://discourse.paraview.org/u/cory.quammen)
#### Post date: [July 10, 2020, 5:39pm UTC](https://discourse.paraview.org/t/visualization-of-data-using-paraview/4703/16 "2020-07-10T17:39:56Z")
> [@cory.quammen](#):
>
> Play with the **Spatial Step** to adjust how the point data is “splatted” onto the STL (smaller values make a bigger splat)
I got this exactly backwards. Bigger values make a bigger splat. 1e-6 is probably far too small, hence the zero values.
---
### Author:  [@Deepa](https://discourse.paraview.org/u/Deepa)
#### Post date: [July 11, 2020, 6:48am UTC](https://discourse.paraview.org/t/visualization-of-data-using-paraview/4703/17 "2020-07-11T06:48:17Z")
Thank you. I could obtain non-zero values of pressure in the spreadsheet table now.
But these values keep changing when I keep increasing the step size. For instance , I am checking the values for spatial step size: 10, 100, 1000, 1000000. For any value greater than 1000 , the interpolated values of pressure are same all points.
I would also like to know how to color the 3D geometry using these interpolated values
---
### Author:  [@cory.quammen](https://discourse.paraview.org/u/cory.quammen)
#### Post date: [July 11, 2020, 4:07pm UTC](https://discourse.paraview.org/t/visualization-of-data-using-paraview/4703/18 "2020-07-11T16:07:39Z")
> [@Deepa](#):
>
> For any value greater than 1000 , the interpolated values of pressure are same all points.
Large enough step sizes will spread each point’s data value across all the points in the geometry. You’ll need to pick a size that is smaller than the physical size of each polygon in the mesh for reasonable results - I don’t know the exactly math well on the SPH interpolators. The source code is available for you to examine should you want to find details.
> [@Deepa](#):
>
> I would also like to know how to color the 3D geometry using these interpolated values
Properties Panel → Coloring → change the popup menu to “pressure”.
---
### Author:  [@Deepa](https://discourse.paraview.org/u/Deepa)
#### Post date: [July 11, 2020, 4:43pm UTC](https://discourse.paraview.org/t/visualization-of-data-using-paraview/4703/19 "2020-07-11T16:43:38Z")
Thank you very much. I would like to know if the same can be extended for time series data. For example, the current data is at t=0 and there are ten more data sets at an interval of .1s.