Thanks a lot… I could follow the instructions given above and try the SPH Dataset Interpolator. Unfortunately, the interpolated values of pressure are zero at all points. Could you please have a look at the snapshots shared below?
Transform:
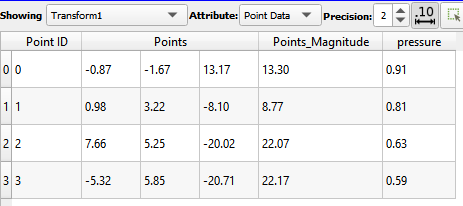
SPH DatasetInterpolator
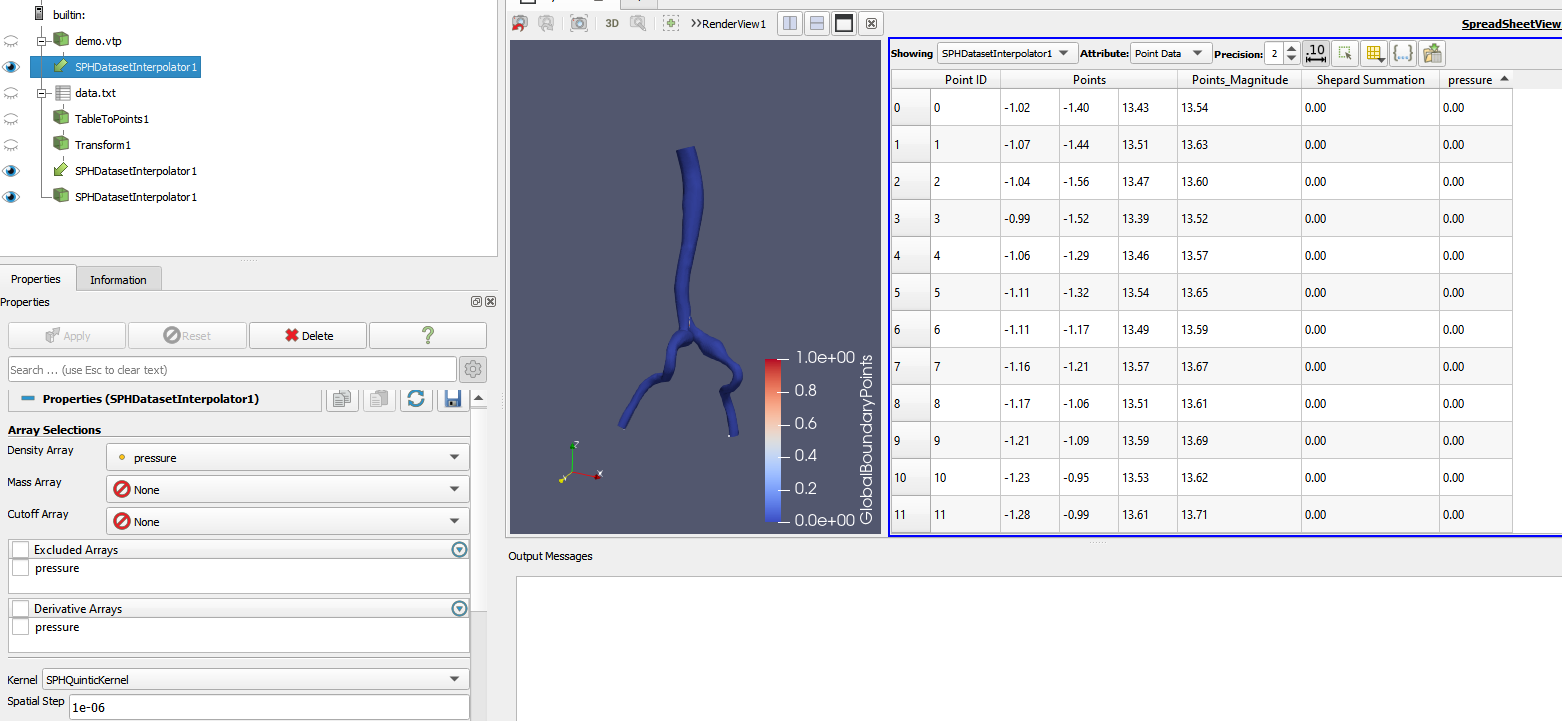
I’ve chosen Density Array pressure in Array Selections. I am not sure what’s going wrong