# Visualization of Digital elevation model (.tiff file)with x,y and z axis in 3D view.
**URL:** https://discourse.paraview.org/t/visualization-of-digital-elevation-model-tiff-file-with-x-y-and-z-axis-in-3d-view/15986
**Category:** ParaView Support
**Created:** [January 15, 2025, 11:51am UTC](https://discourse.paraview.org/t/visualization-of-digital-elevation-model-tiff-file-with-x-y-and-z-axis-in-3d-view/15986 "2025-01-15T11:51:55Z")
**Posts on this page:** 12
**Page:** 1
### Author:  [@kannan](https://discourse.paraview.org/u/kannan)
#### Post date: [January 15, 2025, 11:51am UTC](https://discourse.paraview.org/t/visualization-of-digital-elevation-model-tiff-file-with-x-y-and-z-axis-in-3d-view/15986/1 "2025-01-15T11:51:55Z")
Hi all,
I have a Digital Elevation Model (DEM) in .tiff format. While I am able to load the file into ParaView , it only appears as a flat surface in 3D view, without any relief features. How can I apply vertical exaggeration in the 3D view to better visualize and appreciate the DEM’s relief features?
---
### Author:  [@mwestphal](https://discourse.paraview.org/u/mwestphal)
#### Post date: [January 15, 2025, 11:56am UTC](https://discourse.paraview.org/t/visualization-of-digital-elevation-model-tiff-file-with-x-y-and-z-axis-in-3d-view/15986/2 "2025-01-15T11:56:04Z")
Hi @kannan
You can use the “WarpByScalar” filter to transform the data.
Best,
---
### Author:  [@kannan](https://discourse.paraview.org/u/kannan)
#### Post date: [January 15, 2025, 12:09pm UTC](https://discourse.paraview.org/t/visualization-of-digital-elevation-model-tiff-file-with-x-y-and-z-axis-in-3d-view/15986/3 "2025-01-15T12:09:46Z")
That filter is greyed out when i tries to apply to my .tiff file.
---
### Author:  [@mwestphal](https://discourse.paraview.org/u/mwestphal)
#### Post date: [January 15, 2025, 12:14pm UTC](https://discourse.paraview.org/t/visualization-of-digital-elevation-model-tiff-file-with-x-y-and-z-axis-in-3d-view/15986/4 "2025-01-15T12:14:00Z")
Please share your data.
---
### Author:  [@kannan](https://discourse.paraview.org/u/kannan)
#### Post date: [January 15, 2025, 12:22pm UTC](https://discourse.paraview.org/t/visualization-of-digital-elevation-model-tiff-file-with-x-y-and-z-axis-in-3d-view/15986/5 "2025-01-15T12:22:51Z")
[dem.tif](https://discourse.paraview.org/uploads/short-url/tjwq8Ed6BfxYqGNlYibKaEMpgdY.tif) (130.2 KB)
attached .tif file along with its associated file
[dem.tfw](https://discourse.paraview.org/uploads/short-url/4Ez1vJ92LmY2Khs9D1faiBQbLZc.tfw) (80 Bytes)
---
### Author:  [@mwestphal](https://discourse.paraview.org/u/mwestphal)
#### Post date: [January 15, 2025, 12:46pm UTC](https://discourse.paraview.org/t/visualization-of-digital-elevation-model-tiff-file-with-x-y-and-z-axis-in-3d-view/15986/6 "2025-01-15T12:46:21Z")
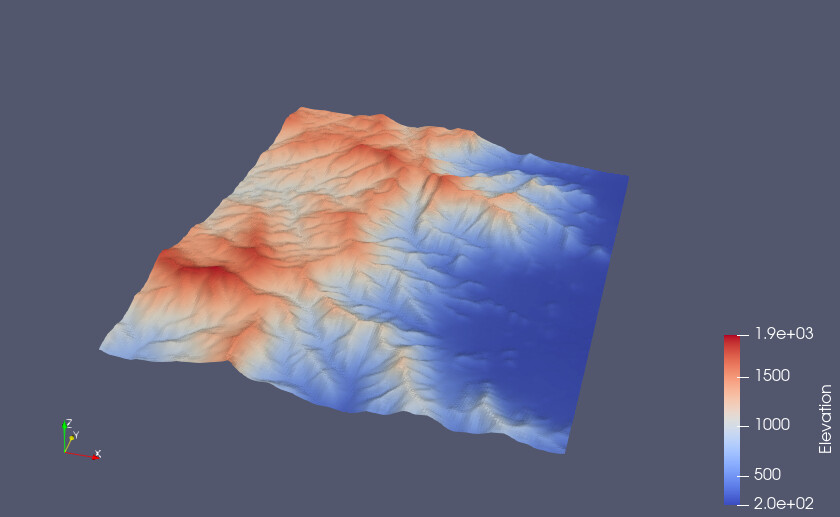
Add a `CellDataToPointData` first:
---
### Author:  [@kannan](https://discourse.paraview.org/u/kannan)
#### Post date: [January 16, 2025, 4:16am UTC](https://discourse.paraview.org/t/visualization-of-digital-elevation-model-tiff-file-with-x-y-and-z-axis-in-3d-view/15986/7 "2025-01-16T04:16:41Z")
Hi Mathieu,
Thanks for your support and this looks great. actualy i am bit new to this software. Could you please brief me the steps to achieve this . this is exactly what i want it.
---
### Author:  [@mwestphal](https://discourse.paraview.org/u/mwestphal)
#### Post date: [January 16, 2025, 8:30am UTC](https://discourse.paraview.org/t/visualization-of-digital-elevation-model-tiff-file-with-x-y-and-z-axis-in-3d-view/15986/8 "2025-01-16T08:30:16Z")
- run ParaView
- File → Open → dem.tiff
- Select “GDal Raster Reader”, Ok
- Filters → CellDataToPointData → Apply
- Filters → WarpByScalars → ScaleFactor: 1e-5 → Apply
Here is a statefile that contains it all:
[state\_dem.pvsm](https://discourse.paraview.org/uploads/short-url/iECGz2mVbwU7znLKdw0IsMFdOi.pvsm) (487.0 KB)
---
### Author:  [@kannan](https://discourse.paraview.org/u/kannan)
#### Post date: [January 16, 2025, 11:41am UTC](https://discourse.paraview.org/t/visualization-of-digital-elevation-model-tiff-file-with-x-y-and-z-axis-in-3d-view/15986/9 "2025-01-16T11:41:06Z")
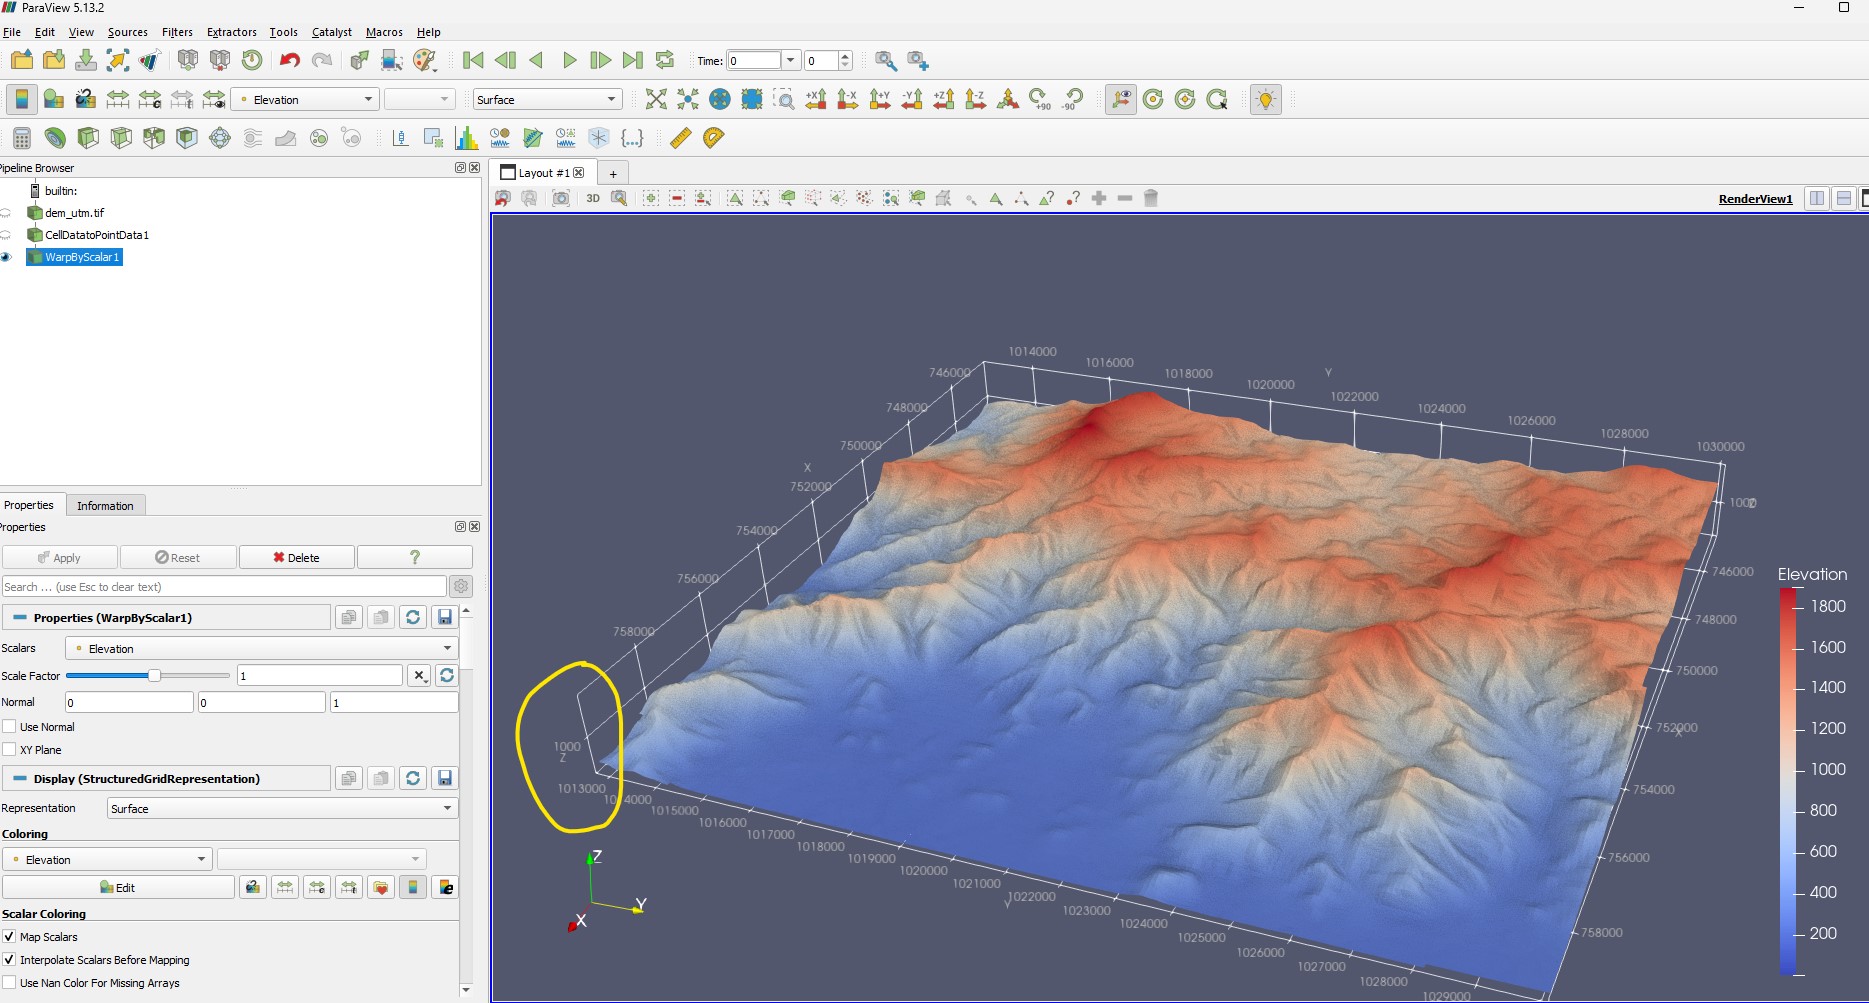
@mwestphal thanks for detailed reply. i could now able to plot dem in 3D as shown below. but the issue is that if i change the scale factor for increasing Z exagerration, the original data values along Z axis also get altered.
is there any way to the scale Z axis for viewing only without changing data values and tick mark values along that Z axis ?. kind of exagerrating Z values for veiwing purpose.
---
### Author:  [@mwestphal](https://discourse.paraview.org/u/mwestphal)
#### Post date: [January 16, 2025, 12:12pm UTC](https://discourse.paraview.org/t/visualization-of-digital-elevation-model-tiff-file-with-x-y-and-z-axis-in-3d-view/15986/10 "2025-01-16T12:12:39Z")
In the Display properties, look for the “Transform”.
---
### Author:  [@kannan](https://discourse.paraview.org/u/kannan)
#### Post date: [January 17, 2025, 6:45am UTC](https://discourse.paraview.org/t/visualization-of-digital-elevation-model-tiff-file-with-x-y-and-z-axis-in-3d-view/15986/11 "2025-01-17T06:45:26Z")
I changed Disply -Transform-scale factor to 4 to exaggerate the view,still the Z value got changed. Pixel value of my DEM (Z/Height) ranges from 1916 to 201 only whereas after scaling value got changed till 8000. Attched screenshot after changing disply values as given below. also aatching stat file.

[stat.pvsm](https://discourse.paraview.org/uploads/short-url/zYSaAF1bZKr7ciJeF2KpXzHUYX4.pvsm) (472.9 KB)
Properties(WarpByScalar1)- scale factor 1 and normal 0 0 1
Display(StructuredGridRepresentaion)- Transform-Scale-0 0 4
---
### Author:  [@mwestphal](https://discourse.paraview.org/u/mwestphal)
#### Post date: [January 17, 2025, 8:17am UTC](https://discourse.paraview.org/t/visualization-of-digital-elevation-model-tiff-file-with-x-y-and-z-axis-in-3d-view/15986/12 "2025-01-17T08:17:18Z")
Indeed, you are right, this is unexpected to me, and can arguably be considered a bug imo.
Data Axes grid should also respect the transform.
I’m afraid I dont have a solution at this point, there is no way to show an 3d axes grid with unequal axes in ParaView afaics.