# Visualization of time series data using Paraview
**URL:** https://discourse.paraview.org/t/visualization-of-time-series-data-using-paraview/4831
**Category:** ParaView Support
**Created:** [July 14, 2020, 6:42am UTC](https://discourse.paraview.org/t/visualization-of-time-series-data-using-paraview/4831 "2020-07-14T06:42:43Z")
**Posts on this page:** 6
**Page:** 1
### Author:  [@Deepa](https://discourse.paraview.org/u/Deepa)
#### Post date: [July 14, 2020, 6:42am UTC](https://discourse.paraview.org/t/visualization-of-time-series-data-using-paraview/4831/1 "2020-07-14T06:42:43Z")
Hello Everyone,
I am following the documentation available [here](https://www.paraview.org/Wiki/ParaView/Data_formats#Reading_a_time_varying_Raw_file_into_Paraview) to understand how time-varying scalar data has to be
read in Paraview.
For instance, I’ve imported the static data of a scalar value with the point coordinates in the following format
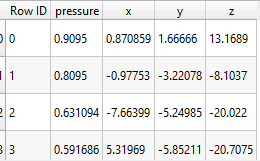
For a time-varying data of the same scalar value, is it required to save the data corresponding to each time instant in a separate file as described in the above-mentioned documentation?
I would like to know if there are alternate ways of importing the time series data. For example, if I have to do the above for 100 time points, 100 files have to be loaded. If there are examples for
doing this using the Paraview library in Python, I would be happy to have a look.
In the end, I want to use SPH interpolator to interpolate the values of the scalar quantity at all the coordinates of a geometry (e.g. presented [here](https://discourse.paraview.org/t/visualization-of-data-using-paraview/4703/8)) and animate over time.
---
### Author:  [@Kenneth\_Moreland](https://discourse.paraview.org/u/Kenneth_Moreland)
#### Post date: [July 14, 2020, 6:25pm UTC](https://discourse.paraview.org/t/visualization-of-time-series-data-using-paraview/4831/2 "2020-07-14T18:25:44Z")
> [@Deepa](#):
>
> I would like to know if there are alternate ways of importing the time series data.
Yes and no. There are some file formats that support putting data for many timesteps in a single file. The [Exodus II](http://gsjaardema.github.io/seacas/html/index.html) and [XDMF](http://www.xdmf.org/index.php/XDMF_Model_and_Format) file formats both support this feature and are probably a good fit for the type of data you have. But both are far more complex than simple csv/text files and each requires its own support libraries.
There is no way to directly specify multiple time points in a single csv file, and I cannot think of any simple ASCII-based formats that would support this. So you will either have to write out 100 files or use a much more complex format.
For what it’s worth, 100 files does not sound like much. I’ve seen simulations write out 10’s of thousands of files or more. Not that I recommend writing out that many files, but in comparison, 100 files is pretty minor.
---
### Author:  [@Deepa](https://discourse.paraview.org/u/Deepa)
#### Post date: [July 15, 2020, 3:53am UTC](https://discourse.paraview.org/t/visualization-of-time-series-data-using-paraview/4831/3 "2020-07-15T03:53:53Z")
Thanks a lot for the details. I actually have all the data in single mat file generated form MATLAB.
different time instances are stored as columns.
I’m looking for Python/ MATLAB libraries to convert mat file to exodus II /xdmf .Would it be a good idea
to do this conversion?
MATLAB supports writing out workspace variables in [these formats](https://in.mathworks.com/help/matlab/import_export/supported-file-formats.html). Will netCDF be helpful?
---
### Author:  [@Kenneth\_Moreland](https://discourse.paraview.org/u/Kenneth_Moreland)
#### Post date: [July 15, 2020, 1:23pm UTC](https://discourse.paraview.org/t/visualization-of-time-series-data-using-paraview/4831/4 "2020-07-15T13:23:00Z")
netCDF could work. ParaView understands the [netCDF CF](https://cfconventions.org/) convention, and you can use that to specify a time dimension.
If I remember correctly, to specify a dimension as a time dimension, you create a 1D variable with the same name as the dimension (e.g. if your time dimension is named `time` you create a 1D variable with dimension `time` that is also named `time`). The variable needs an attribute named `units` that is some sort of time unit. Some examples of time units that ParaView recognizes are `seconds`, `minutes`, `hours`, and anything in the form `X since Y`. (Alternately, you can specify an `axis` attribute with the value `T`.) The values in this time description variable should be the time value for each time step. They should be monotonically increasing.
ParaView requires the time dimension to be the first dimension on a variable.
---
### Author:  [@Deepa](https://discourse.paraview.org/u/Deepa)
#### Post date: [July 17, 2020, 7:24am UTC](https://discourse.paraview.org/t/visualization-of-time-series-data-using-paraview/4831/5 "2020-07-17T07:24:09Z")
Hi @Kenneth_Moreland
I tried the following to write the workspace variable in NetCDF file,
> header = [‘x’, ‘y’, ‘z’, ‘0.2s’, ‘0.4s’, ‘0.6s’, ‘0.8s’, ‘1.0s’]
> time = [0.2 0.4 0.6 0.8 1.0];
> mydata = rand(10,8) %first 3 columns (x,y,z) coordinates next 5 time series data at 0.2,0.4,0.6,0.8,1 seconds
>
> % define mode
> ncid = netcdf.create(‘myfile.nc’,‘CLOBBER’);
> dimid = netcdf.defDim(ncid,‘my\_dim’,length(time))
> varid = netcdf.defVar(ncid,‘time’,‘NC\_BYTE’,dimid)
> netcdf.endDef(ncid)
>
> % data mode
> netcdf.putVar(ncid,varid,time)
> netcdf.close(ncid)
>
> % verify
> ncid2 = netcdf.open(‘myfile.nc’,‘NC\_NOWRITE’);
> x = netcdf.getVar(ncid2,0);
> whos x
> netcdf.close(ncid2)
> [@Kenneth\_Moreland](#):
>
> The values in this time description variable should be the time value for each time step. They should be monotonically increasing
I have created a 1D variable `time` of dimension 1 x nt (nt=5) that’s monotonically increasing. I’m still trying to figure out
how to add the attribute `units` to `time`.
Could you please suggest how the coordinates (x,y,z) must be specified ? Should the dimesion be a 3 x np (np= no. of points in the grid) variable? And how the filed data should be specified? Should the dimension be np x nt variable?
---
### Author:  [@Kenneth\_Moreland](https://discourse.paraview.org/u/Kenneth_Moreland)
#### Post date: [July 20, 2020, 8:18pm UTC](https://discourse.paraview.org/t/visualization-of-time-series-data-using-paraview/4831/6 "2020-07-20T20:18:49Z")
> [@Deepa](#):
>
> I have created a 1D variable `time` of dimension 1 x nt (nt=5) that’s monotonically increasing. I’m still trying to figure out
> how to add the attribute `units` to `time` .
It’s been a long time since I’ve done any real programming with netCDF, and never from Matlab, but I think you need to use the `putAtt` method.
```matlab
netcdf.putAtt(ncid, varid, 'units', 'seconds')
```
Also, the name of the dimension has to match the name of the variable. So both the dimension and the variable need to be named `time`. (Currently you have the dimension named `my_dim`.)
Also, I think you need to use either `NC_FLOAT` or `NC_DOUBLE` instead of `NC_BYTE` for your call to `defVar`. The `NC_BYTE` type of variable can only hold integers, not fractions like `0.2`.
> [@Deepa](#):
>
> Could you please suggest how the coordinates (x,y,z) must be specified ? Should the dimesion be a 3 x np (np= no. of points in the grid) variable? And how the filed data should be specified? Should the dimension be np x nt variable?
Create three additional dimensions named (such as) `x`, `y`, and `z`. Make the variable that stores the actual data be 4 dimensional and, if I remember correctly, the order of the dimensions should be `time`, `z`, `y`, `x`. ParaView will recognize this as a 3 dimensional, axis-aligned grid that changes over time. You can specify the coordinates along each axis by creating corresponding `x`, `y`, and `z` variables for each dimension and putting the locations there.