# Visualizations of water
**URL:** https://discourse.paraview.org/t/visualizations-of-water/4183
**Category:** ParaView Support
**Tags:** python, vtk
**Created:** [April 25, 2020, 5:52am UTC](https://discourse.paraview.org/t/visualizations-of-water/4183 "2020-04-25T05:52:01Z")
**Posts on this page:** 20
**Page:** 1
### Author:  [@EscapedGoat](https://discourse.paraview.org/u/EscapedGoat)
#### Post date: [April 25, 2020, 5:52am UTC](https://discourse.paraview.org/t/visualizations-of-water/4183/1 "2020-04-25T05:52:02Z")
Hi All,
I’m sort of beginner/less user of paraview. But currently now that my usage is increased, I would like to know about the customizing visualization of water flowing/falling on generic surfaces.
For CFD modeler/scientist it’s easy and quick to understand, the visualizing of water flowing over a ‘non watery’ generic surface, where ‘blue color’ shows void fraction of 0, defining that region/elements of geometry has no liquid present, thus considered as gas. And the ‘red color’ shows void fraction of 1, defining elements/region of the geometry has no gas present, thus considered as liquid.
But, for common man/woman, this looks weird, they defining it as ‘blood’ flowing over blue surfaces. And it’s difficult for them to contemplate the fact that its water, and not blood.
Hence, I would like to know the procedure/python script to change the colors to ‘water color’ (something like light blue/ teal color), and for surfaces to grey or beige color.
Thank you.
Regards.
Ash Kot.
---
### Author:  [@mwestphal](https://discourse.paraview.org/u/mwestphal)
#### Post date: [April 27, 2020, 2:50am UTC](https://discourse.paraview.org/t/visualizations-of-water/4183/2 "2020-04-27T02:50:15Z")
Depends on how you color your dataset.
What did you try ?
---
### Author:  [@EscapedGoat](https://discourse.paraview.org/u/EscapedGoat)
#### Post date: [April 27, 2020, 6:04am UTC](https://discourse.paraview.org/t/visualizations-of-water/4183/3 "2020-04-27T06:04:23Z")
I wasn’t sure where to look on paraview to change the colors of phases.
After extensive search and ‘clicking all buttons’ I figured it out.
Process is essentially, if a person want to change the color, first he/she need to know the RGB codes of grey (and its shades), and blue (and its shades).
So, first load the geometry (in my case case.OpenFOAM, and then read it with inbuilt paraview OpenFOAM reader.) from file \> open
Then open color map editor for the geometry, on that you’ll see a right angle triangle under ‘mapping data’ option filled with two different colors and their shades, now next to that some tiny icons are situated, first click on ‘set range’ icon (the one with double arrows towards opposite sides shown with c written at bottom) and set the appropriate range (in my case its 0 and 1). Next, click on ‘load presets’ icon (The one with heart is shown), choose appropriate preset you want. Then click on settings icon (the one with gear wheel is shown).
Now one table is visible, in which in front of 0 value type (0.82, 0.82, 0.82) under (R, G, B) column respectively, this is RGB value for grey surface, then add (0, 0.5, 0.75) under (R, G, B) columns respectively in front of value 1.
And Done! it looks like water is flowing over concrete surface!
---
### Author:  [@Kenneth\_Moreland](https://discourse.paraview.org/u/Kenneth_Moreland)
#### Post date: [April 27, 2020, 2:17pm UTC](https://discourse.paraview.org/t/visualizations-of-water/4183/4 "2020-04-27T14:17:06Z")
@EscapedGoat, I’m glad you figured it out.
In case you don’t know, ParaView comes with both an extensive user’s guide and tutorial. Both can be downloaded by going to ParaView’s `Help` menu. Both discuss the modification of colors as well as many, many other topics. That might save you some time over extensively clicking all the buttons.
---
### Author:  [@timofeymukha](https://discourse.paraview.org/u/timofeymukha)
#### Post date: [May 2, 2020, 6:16pm UTC](https://discourse.paraview.org/t/visualizations-of-water/4183/5 "2020-05-02T18:16:47Z")
Dear all,
If the OP does not mind, I would like to expand the discussion beyond colour scheme choices and touch upon more realistic visualization of a dynamically evolving fluid surface. I think with the ray tracing and appropriate material textures it should be possible to produce excellent images and animations, but I am a bit too noob with 3D graphics to get things done right I think.
I attach a link to .vtp file with an interesting-looking air-water interface surface from a hydraulic jump simulation. After playing around with the settings, I was able to produce the attached image with the OSP raytracer. I think it looks pretty cool, but it doesn’t really look like water, more like goo :).

Maybe people would be interested in trying to produce something better, and we can together arrive to a good recipe for these type of visualizations, which I think are in high demand. An example of how things could look can be found in the videos here
[LINK TO MOVIES](https://www.cambridge.org/core/journals/journal-of-fluid-mechanics/article/direct-numerical-simulation-of-a-turbulent-hydraulic-jump-turbulence-statistics-and-air-entrainment/84800BF335F44F8A13EE5C648CDC388D#fndtn-supplementary-materials)
[LINK TO VTP FILE](https://my.pcloud.com/publink/show?code=XZaCUKkZ4UydXcyskejYfGlRHIK2R0Pi0yfk)
---
### Author:  [@EscapedGoat](https://discourse.paraview.org/u/EscapedGoat)
#### Post date: [May 4, 2020, 12:06am UTC](https://discourse.paraview.org/t/visualizations-of-water/4183/6 "2020-05-04T00:06:48Z")
Oh WOW!! I would definitely want to apply this to my visualizations.
But I got the question, about the water particle/droplet/waves visualization, that is the droplet formations, and wave formation is function of surface tension force, or angle at which the droplet form on the surface?
For example, if the constant contact angle is around 31 degrees, does that show the water is creating a sort of flatness/ forming less spherical particles? Or will it show visualization of a almost spherical particle at 72 degrees?
---
### Author:  [@MiguelAngelAGUIRRE](https://discourse.paraview.org/u/MiguelAngelAGUIRRE)
#### Post date: [May 5, 2020, 12:45pm UTC](https://discourse.paraview.org/t/visualizations-of-water/4183/7 "2020-05-05T12:45:15Z")
Hi all !
If you are trying to visualize that as a real flud, maybe you should take a look at this video:
Best regards
Miguel
---
### Author:  [@timofeymukha](https://discourse.paraview.org/u/timofeymukha)
#### Post date: [May 5, 2020, 5:51pm UTC](https://discourse.paraview.org/t/visualizations-of-water/4183/8 "2020-05-05T17:51:24Z")
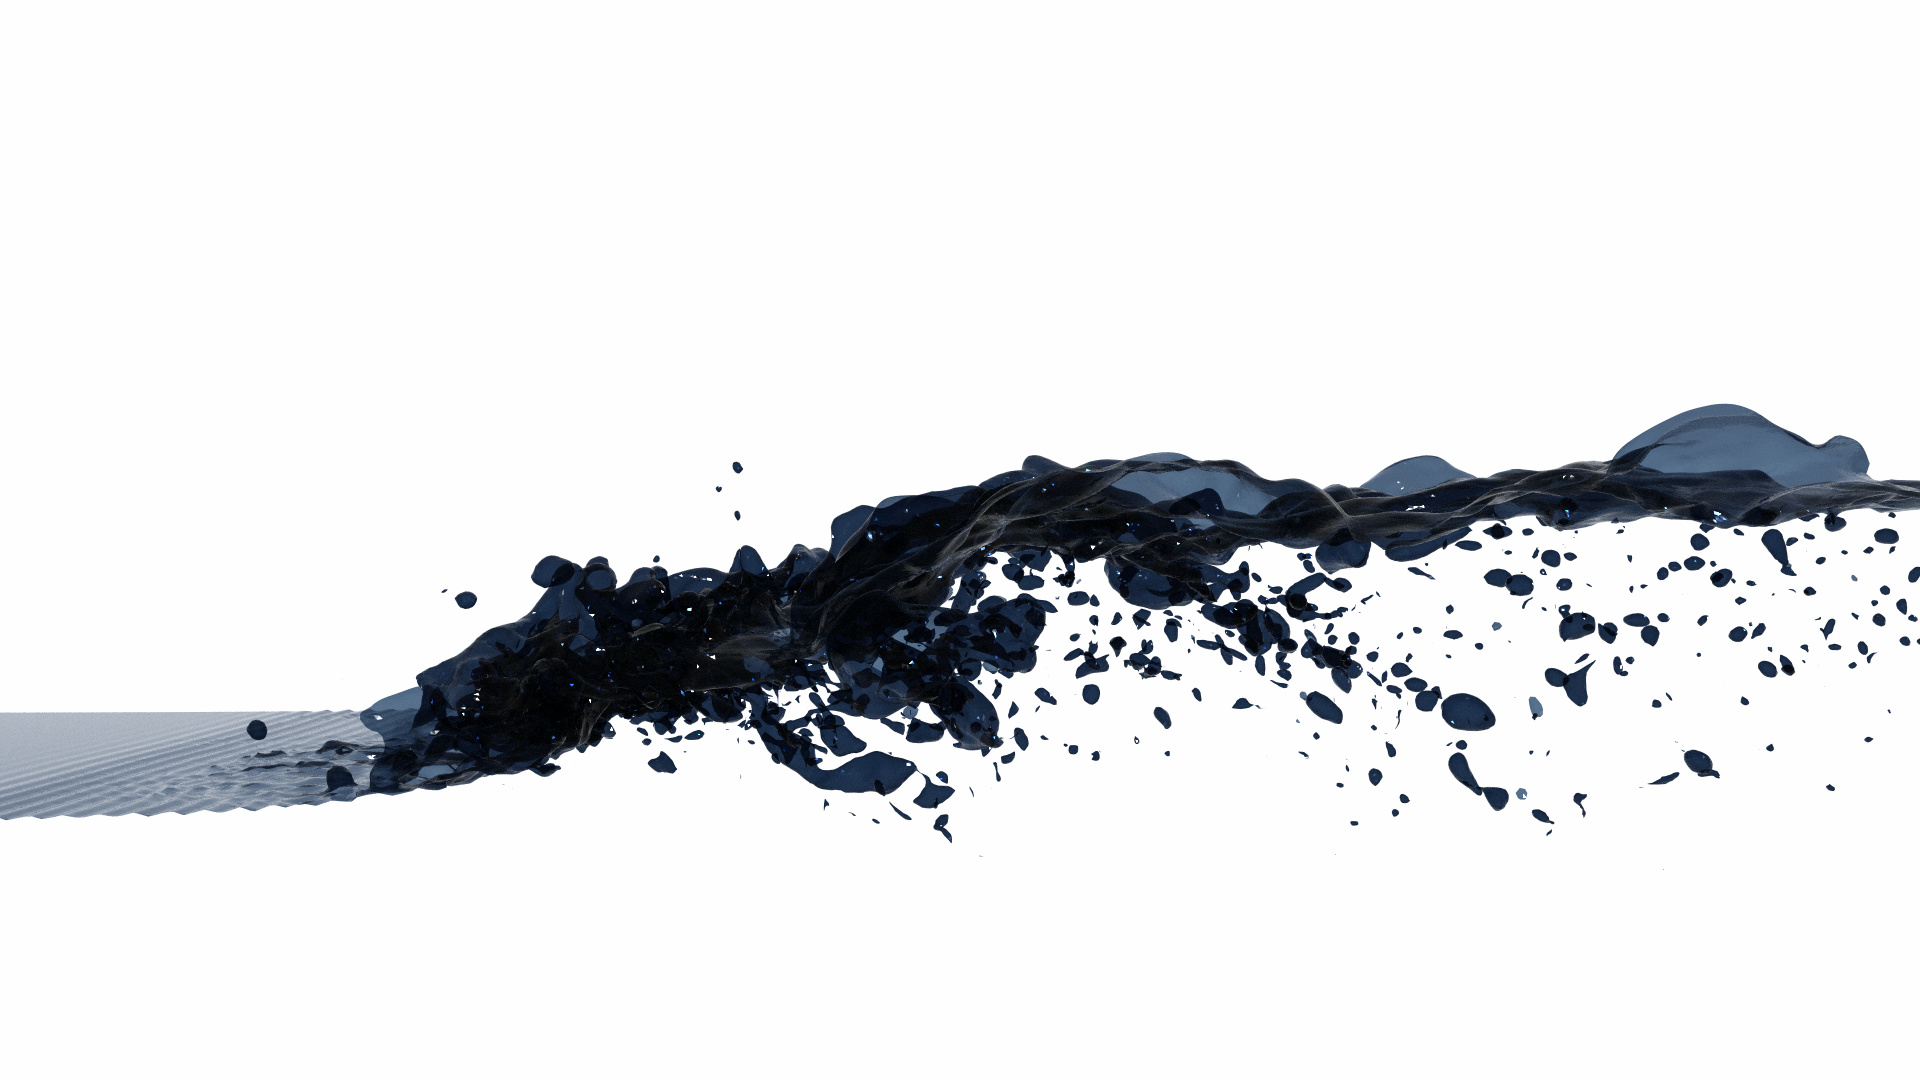
Yeah, I guess using Blender can bring it to the next level. I managed the following with Paraview so far.
---
### Author:  [@Michael](https://discourse.paraview.org/u/Michael)
#### Post date: [May 6, 2020, 6:50am UTC](https://discourse.paraview.org/t/visualizations-of-water/4183/9 "2020-05-06T06:50:50Z")
Here is my result, achieved with ParaView master (you cannot load .hdr files yet in PV 5.8):

The configuration is simple:
- The surface is opaque
- I used the Principled material (Metallic=0, Roughness=0.25) from the UI (select PBR interpolation)
- Color is #010412
- All lights are disabled and I use only this HDRI: [https://hdrihaven.com/hdri/?h=spruit\_sunrise](https://hdrihaven.com/hdri/?h=spruit_sunrise)
- Enable OSPRay pathtracer (200 samples per pixel)
I think we can achieve a better result with a dataset describing an enclosed surface rather than just the top surface, and having a velocity field, for instance, to use a colormap to change the color from blue to white at some parts of the surface.
---
### Author:  [@timofeymukha](https://discourse.paraview.org/u/timofeymukha)
#### Post date: [May 6, 2020, 7:55am UTC](https://discourse.paraview.org/t/visualizations-of-water/4183/10 "2020-05-06T07:55:26Z")
Looks great, espcially for looking at the structure of the overturning waves! I am still figuring out how lighting works in Paraview. I realize that the background colour plays a huge role and acts as a kind of ambient light of very strong intensity. If I set the background to white, the light kit basically does nothing.
I will eventually share the 3D dataset, including all the fluid properties. But having a 2D surface is pretty common, since I can extract that for a large number of time-steps and animate 🙂. It would be cool if one could extract an intersection of the water surface with a box, so that one gets the “bulk” below the surface for free.
---
### Author:  [@Michael](https://discourse.paraview.org/u/Michael)
#### Post date: [May 6, 2020, 8:10am UTC](https://discourse.paraview.org/t/visualizations-of-water/4183/11 "2020-05-06T08:10:38Z")
Indeed, the background image (HDRI) is something way too underrated and is a lot better than punctual lights when trying to achieve realistic results. It is especially true with the support of HDR images in the next ParaView version.
That would be nice if you can share the 3D dataset, that could be a nice use case for a future webinar.
I guess you are extracting the surface using a Contour filter?
---
### Author:  [@timofeymukha](https://discourse.paraview.org/u/timofeymukha)
#### Post date: [May 6, 2020, 8:27am UTC](https://discourse.paraview.org/t/visualizations-of-water/4183/12 "2020-05-06T08:27:11Z")
No, this is actually extracted directly in OpenFOAM using isosurface sampling. I expect everything to be released by the end of June!
---
### Author:  [@Michael](https://discourse.paraview.org/u/Michael)
#### Post date: [May 6, 2020, 8:36am UTC](https://discourse.paraview.org/t/visualizations-of-water/4183/13 "2020-05-06T08:36:45Z")
I see, the Contour filter of ParaView is actually an isosurface sampling.
I’m not sure if you can do this with OpenFOAM but a better pipeline would be:
- Clip with scalars (using the same array and value than the isosurface)
- Extract surface (in order to reduce 3D dataset to 2D surface)
- Generate normals (to get a smooth surface)
The result should be something equivalent to the isosurface intersected with a box.
---
### Author:  [@timofeymukha](https://discourse.paraview.org/u/timofeymukha)
#### Post date: [May 6, 2020, 9:35am UTC](https://discourse.paraview.org/t/visualizations-of-water/4183/14 "2020-05-06T09:35:09Z")
Interesting idea. I tried to reproduce this workflow in Paraview for starters. The issue is with getting a smooth surface.

One can clearly see the underlying mesh. I note that this dataset has a 4 times larger mesh size thatn the one used for the surface I attached above, but I think the problem will persist. I used the Generate Surface Normals, but it was a bit of a shot in the dark it does not seem to do much. I guess the normals are still aligned with the surfaces of the rectangular cells.
---
### Author:  [@Michael](https://discourse.paraview.org/u/Michael)
#### Post date: [May 6, 2020, 9:39am UTC](https://discourse.paraview.org/t/visualizations-of-water/4183/15 "2020-05-06T09:39:18Z")
Try to use “Clip” instead of “Threshold” and select “Scalar” for the clip type.
You should also use “Extract surface” instead of “Extract region surface”.
Let me know if it is better.
---
### Author:  [@timofeymukha](https://discourse.paraview.org/u/timofeymukha)
#### Post date: [May 6, 2020, 10:10am UTC](https://discourse.paraview.org/t/visualizations-of-water/4183/16 "2020-05-06T10:10:59Z")
Yes, using a scalar-clip gives the same surface as a contour extraction. Nice. A possibility for OpenFOAM might be to create a new field, that is equal to the volume fraction of water everywhere, but the boundary adjacent cells. For those cells, set it to 0.5 if the water volume fraction is \> 0.5. Then extract 0.5 isosurface of this field. Might try it later today.
---
### Author:  [@timofeymukha](https://discourse.paraview.org/u/timofeymukha)
#### Post date: [May 6, 2020, 11:24am UTC](https://discourse.paraview.org/t/visualizations-of-water/4183/17 "2020-05-06T11:24:15Z")
Dear all, here is a link to a new vtp that contains both the interface surface but also the bulk of the water below. Additionally, the velocity and water volume fraction fields are present.
> **[interface\_and\_bulk.vtp - Shared with pCloud](https://my.pcloud.com/publink/show?code=XZxbTlkZueXrRAvtkDkWgUOpKufVuh3OXTay)**
>
> Keep all your files safe, access them on any device you own and share with just the right people. Create a free pCloud account!
A quick render using a white background, the “water” material, default light kit settings, OSP raytracer.

---
### Author:  [@Michael](https://discourse.paraview.org/u/Michael)
#### Post date: [May 7, 2020, 11:43am UTC](https://discourse.paraview.org/t/visualizations-of-water/4183/18 "2020-05-07T11:43:52Z")
Thanks a lot for sharing, it looks great!
---
### Author:  [@EscapedGoat](https://discourse.paraview.org/u/EscapedGoat)
#### Post date: [May 7, 2020, 2:01pm UTC](https://discourse.paraview.org/t/visualizations-of-water/4183/19 "2020-05-07T14:01:33Z")
This looks quite interesting I don’t think so Tecplot, or
Ansys EnSight has this much capabilities or maybe I din’t explored those software much.
But, I’m gonna look in this, although my flow is low velocity, laminar flow, I may not have these sort of splashing around effect.
Thanks for sharing files as well!
---
### Author:  [@Sankhesh\_Jhaveri](https://discourse.paraview.org/u/Sankhesh_Jhaveri)
#### Post date: [May 22, 2020, 3:44am UTC](https://discourse.paraview.org/t/visualizations-of-water/4183/20 "2020-05-22T03:44:08Z")
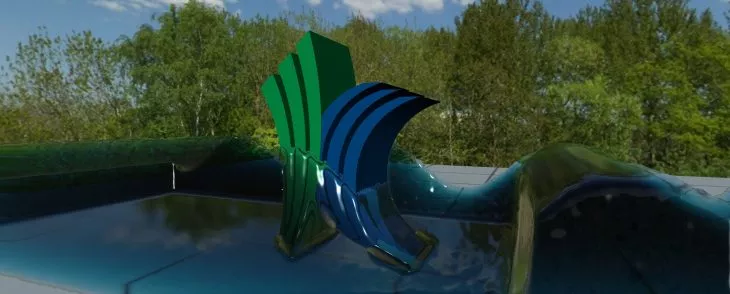
One more suggestion - We recently added [a fluid mapper to VTK](https://blog.kitware.com/screen-space-fluid-rendering-vtk/). It is not exposed in ParaView yet but it should not be too hard to do so as a new representation.
Here is a screenshot of the mapper in action showing the fluid rendering as water:
[Next page](https://discourse.paraview.org/t/visualizations-of-water/4183.md?page=2)