# Visualizations of wave breaking
**URL:** https://discourse.paraview.org/t/visualizations-of-wave-breaking/12432
**Category:** ParaView Support
**Tags:** vtk
**Created:** [July 1, 2023, 2:53pm UTC](https://discourse.paraview.org/t/visualizations-of-wave-breaking/12432 "2023-07-01T14:53:01Z")
**Posts on this page:** 3
**Page:** 1
### Author:  [@sopoyoon](https://discourse.paraview.org/u/sopoyoon)
#### Post date: [July 1, 2023, 2:53pm UTC](https://discourse.paraview.org/t/visualizations-of-wave-breaking/12432/1 "2023-07-01T14:53:01Z")
Hello everyone,
I am a beginner in using Paraview for visualizing wave breaking. I would like to use Paraview with an input file that contains volume fraction data for all cells at their centers, where 0 represents air and 1 represents water (as vti file format).
> **[Google Drive: Sign-in](https://accounts.google.com/v3/signin/identifier?dsh=S286029447%3A1688222812757220&continue=https%3A%2F%2Fdrive.google.com%2Ffile%2Fd%2F1hAwGd-_PZ9mQuTHO-ZLC9sLF0a-IcuwI%2Fview%3Fusp%3Ddrive_link&followup=https%3A%2F%2Fdrive.google.com%2Ffile%2Fd%2F1hAwGd-_PZ9mQuTHO-ZLC9sLF0a-IcuwI%2Fview%3Fusp%3Ddrive_link&ifkv=AeDOFXgpYQHgQENxF9UexJUlOEmOgyDhMQ5SR_WVk9-k4BwJ3v7rhq7O9M4DWhmNzHtcI1AIWC-Ong&osid=1&passive=1209600&service=wise&flowName=GlifWebSignIn&flowEntry=ServiceLogin)**
>
> Access Google Drive with a Google account (for personal use) or Google Workspace account (for business use).
I have attempted to visualize the data using Paraview, and the results are as follows:
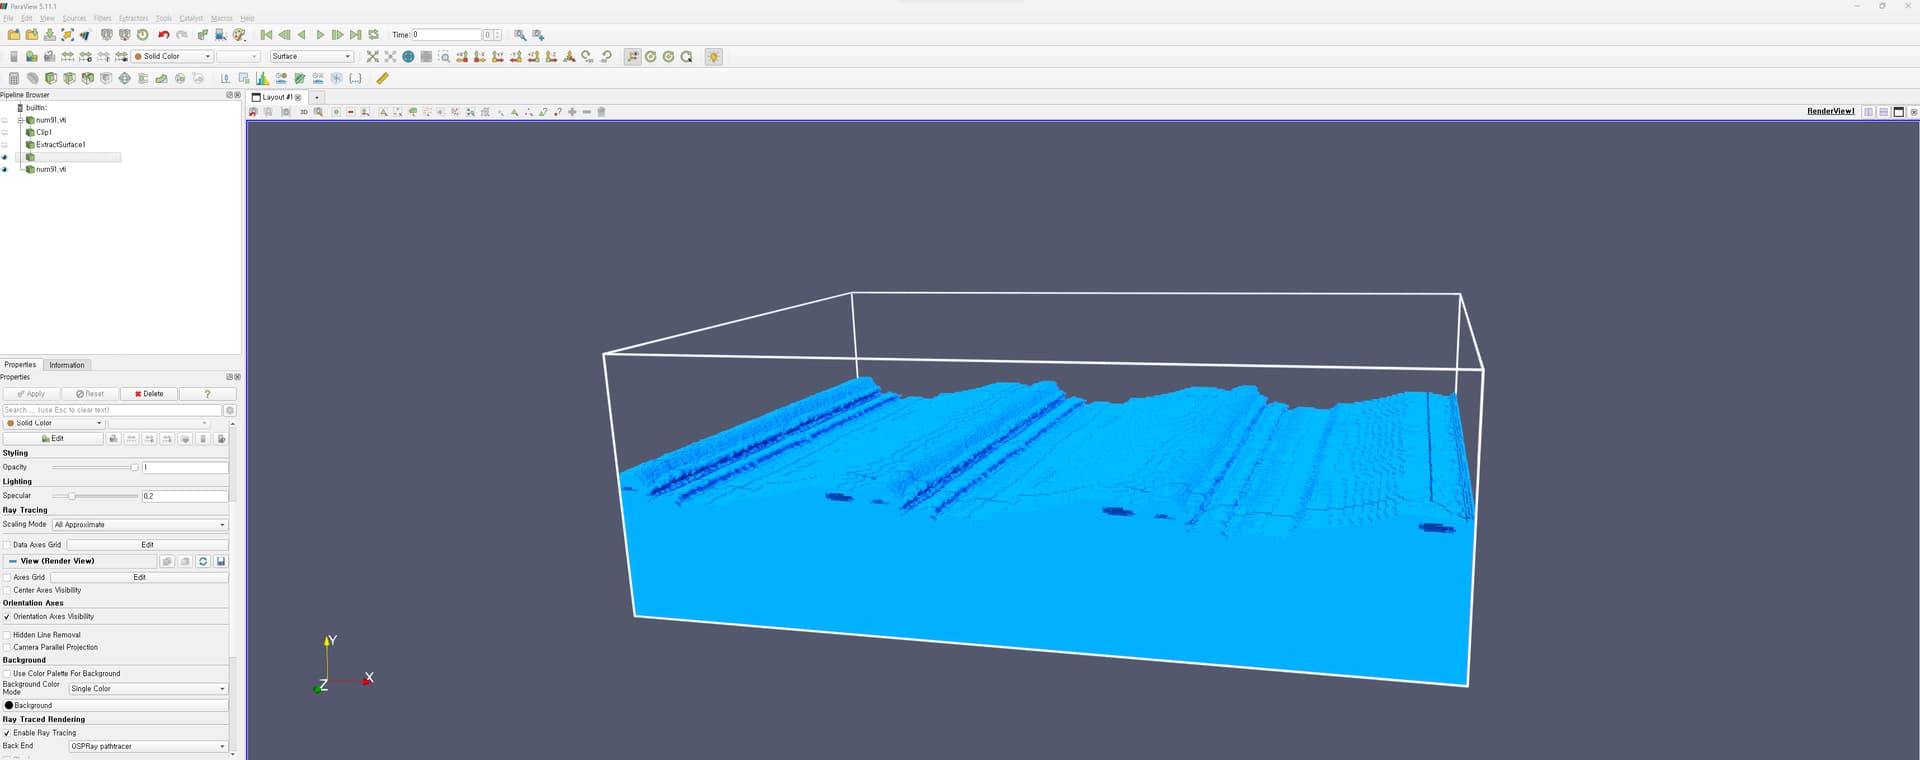
“Clip:Scalar for interface, 0.5”, “Extract Surface”, “Generate Surface Normal”, “OSPRay pathtracer”
I am seeking advice on which features or functionalities I should utilize to achieve the desired results, which can be seen in the example provided.
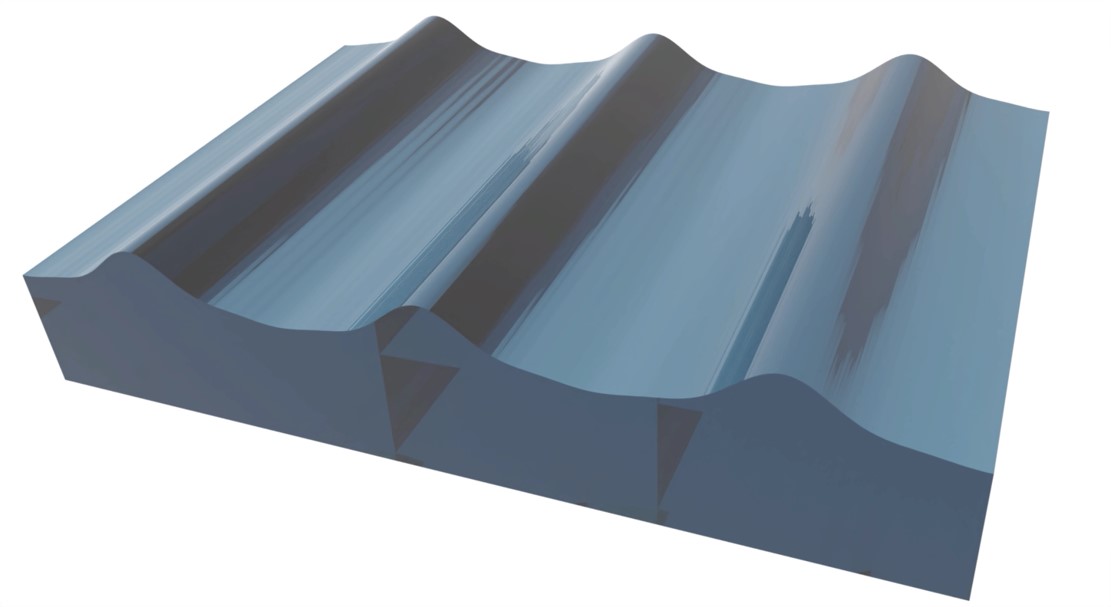
Thank you very much.
Regards,
Sopo.
---
### Author:  [@mwestphal](https://discourse.paraview.org/u/mwestphal)
#### Post date: [July 3, 2023, 5:24am UTC](https://discourse.paraview.org/t/visualizations-of-wave-breaking/12432/2 "2023-07-03T05:24:11Z")
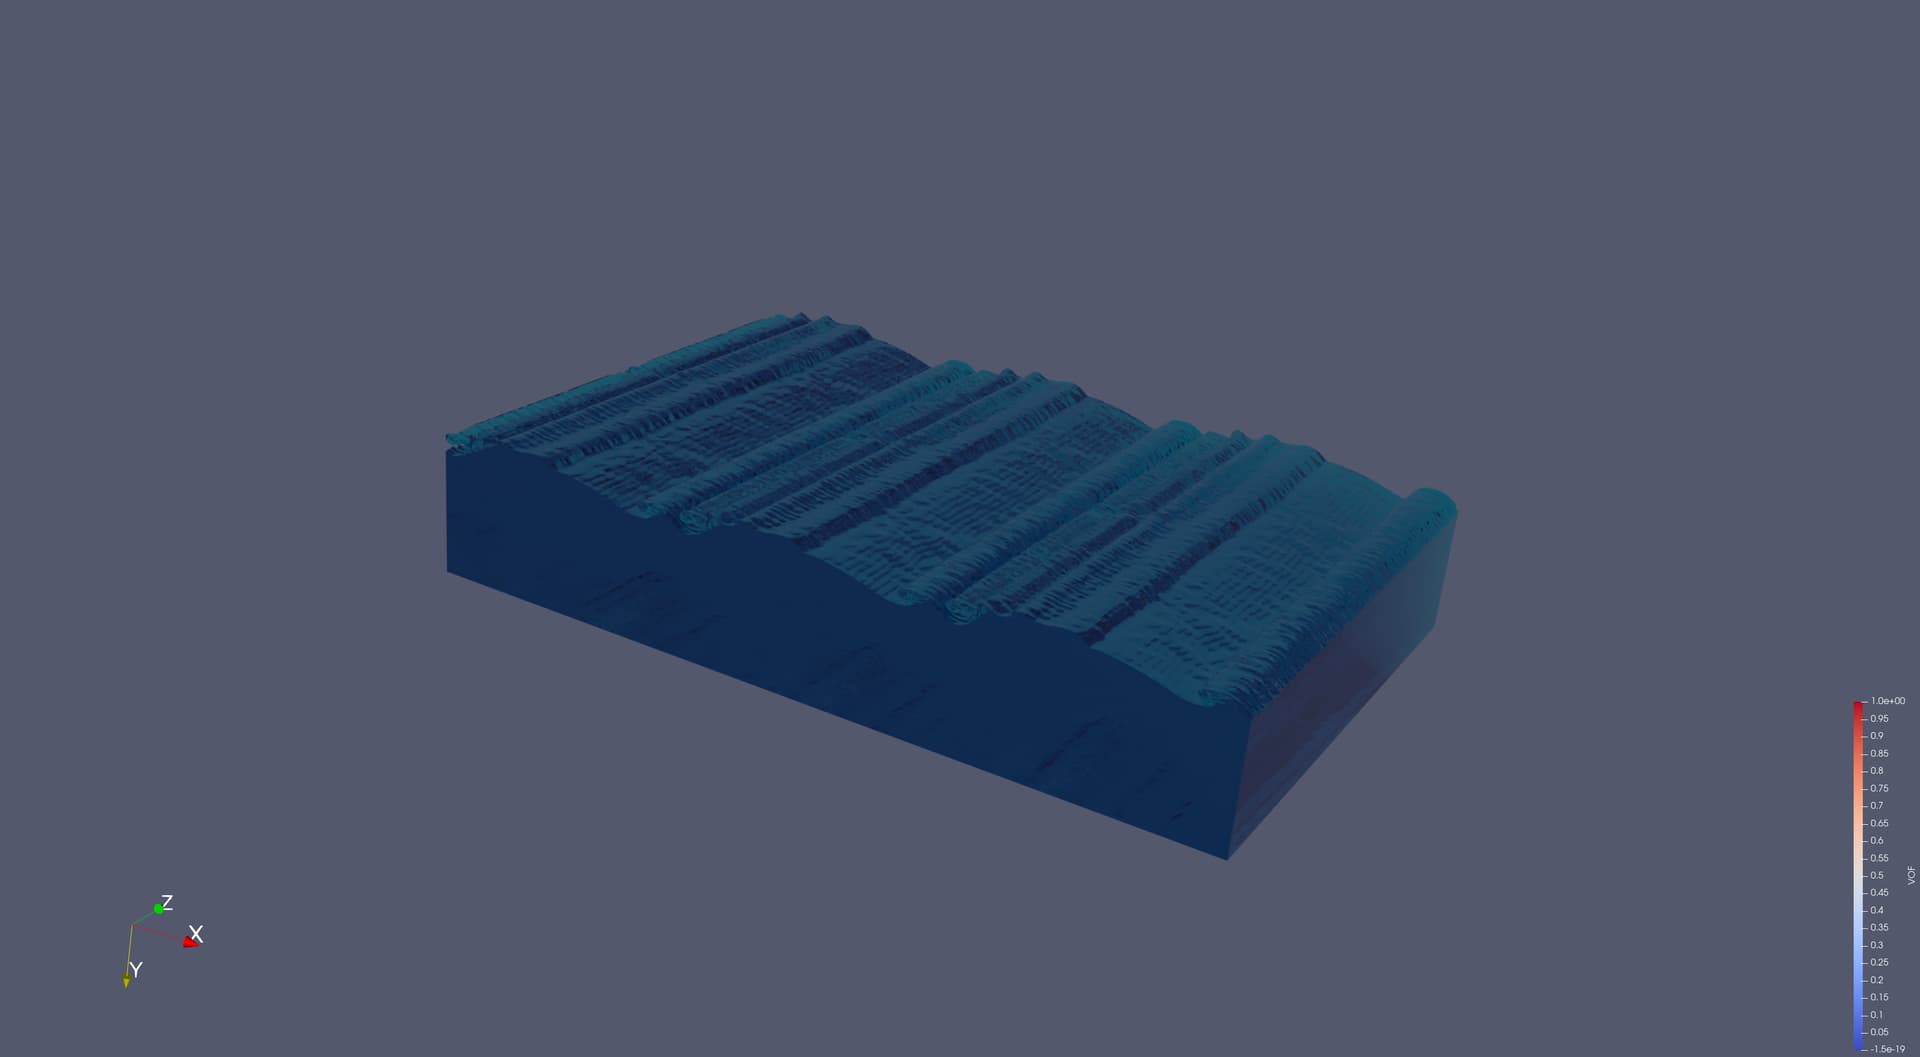
Add a CellDataToPointData before the Clip and use material “Glass\_Water”
Hth,
---
### Author:  [@sopoyoon](https://discourse.paraview.org/u/sopoyoon)
#### Post date: [July 4, 2023, 7:02am UTC](https://discourse.paraview.org/t/visualizations-of-wave-breaking/12432/3 "2023-07-04T07:02:48Z")
Thanks for your response and suggestion.
I really appreciate you letting me know about the Material Editor and all the handy built-in settings it offers. It sounds like a great tool that can help me achieve the visualization I’m aiming for.
Now, I’ll dive into understanding and applying the concepts related to the light source.
Once again, thanks a bunch for your valuable input.
Best regards,