# Visualize stress tensor in a NetCDF format file
**URL:** https://discourse.paraview.org/t/visualize-stress-tensor-in-a-netcdf-format-file/15097
**Category:** ParaView Support
**Created:** [July 22, 2024, 7:22am UTC](https://discourse.paraview.org/t/visualize-stress-tensor-in-a-netcdf-format-file/15097 "2024-07-22T07:22:52Z")
**Posts on this page:** 3
**Page:** 1
### Author:  [@Nemo](https://discourse.paraview.org/u/Nemo)
#### Post date: [July 22, 2024, 7:22am UTC](https://discourse.paraview.org/t/visualize-stress-tensor-in-a-netcdf-format-file/15097/1 "2024-07-22T07:22:52Z")
Hi Everyone,
I am new to ParaView and want to visualize the stress tensor in a NetCDF format file. My steps so far are as follows:
1.Convert the .dat0 file to NetCDF format.
2.Load the NetCDF file in ParaView using the NetCDF reader.
3.Use the contour filter to visualize it, and choose Szz. The result is shown in Fig. 1.
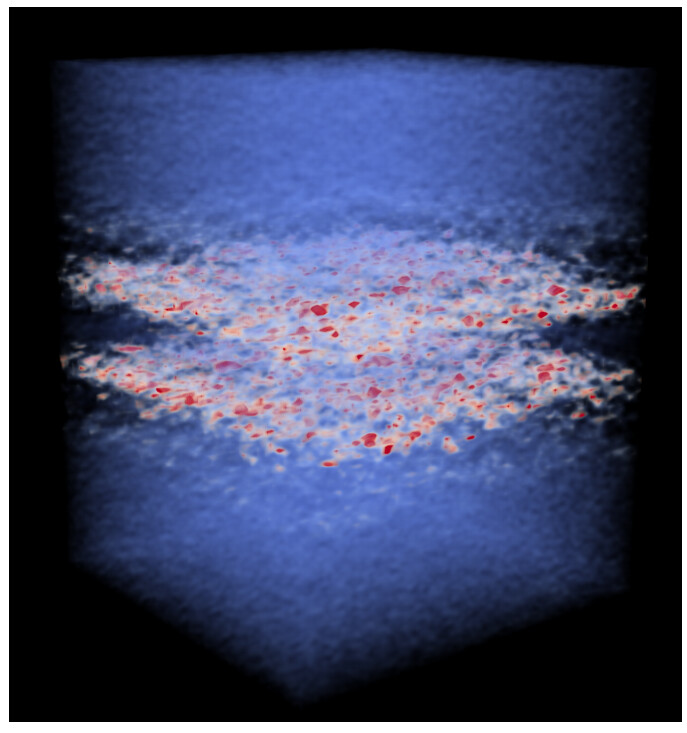
However, I want to display the data as shown in Fig. 2. How can I achieve this? Do I need to change filters or make other adjustments?
Fig. 1:
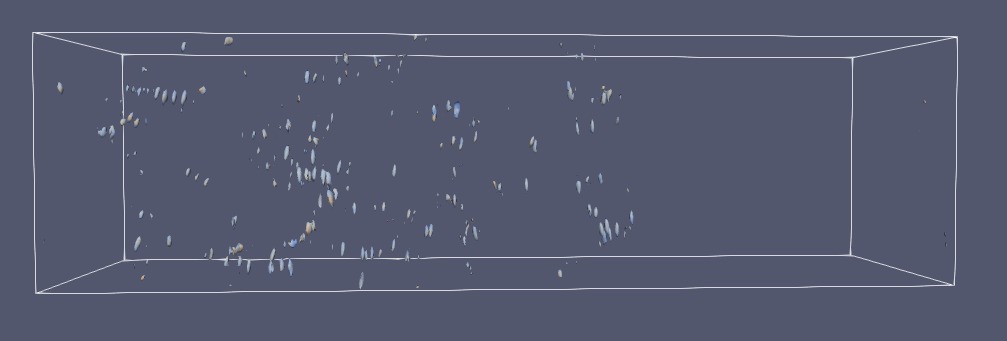
Fig. 2 (Example):
My data is in:
> **[Model.nc](https://drive.google.com/file/d/1uRuEst-_qI8Trfh6Comft2Kr_CPCa5hU/view?usp=drive_link)**
>
> Google Drive file.
Thanks if anyone can help.
Best,
Nemo
---
### Author:  [@cory.quammen](https://discourse.paraview.org/u/cory.quammen)
#### Post date: [July 22, 2024, 10:46am UTC](https://discourse.paraview.org/t/visualize-stress-tensor-in-a-netcdf-format-file/15097/2 "2024-07-22T10:46:42Z")
The second image appears to be a volume rendering of the data. To do volume rendering in ParaView, you change the type of representation used for the data. In the _Properties Panel_, look for the Representation property in the Display section:
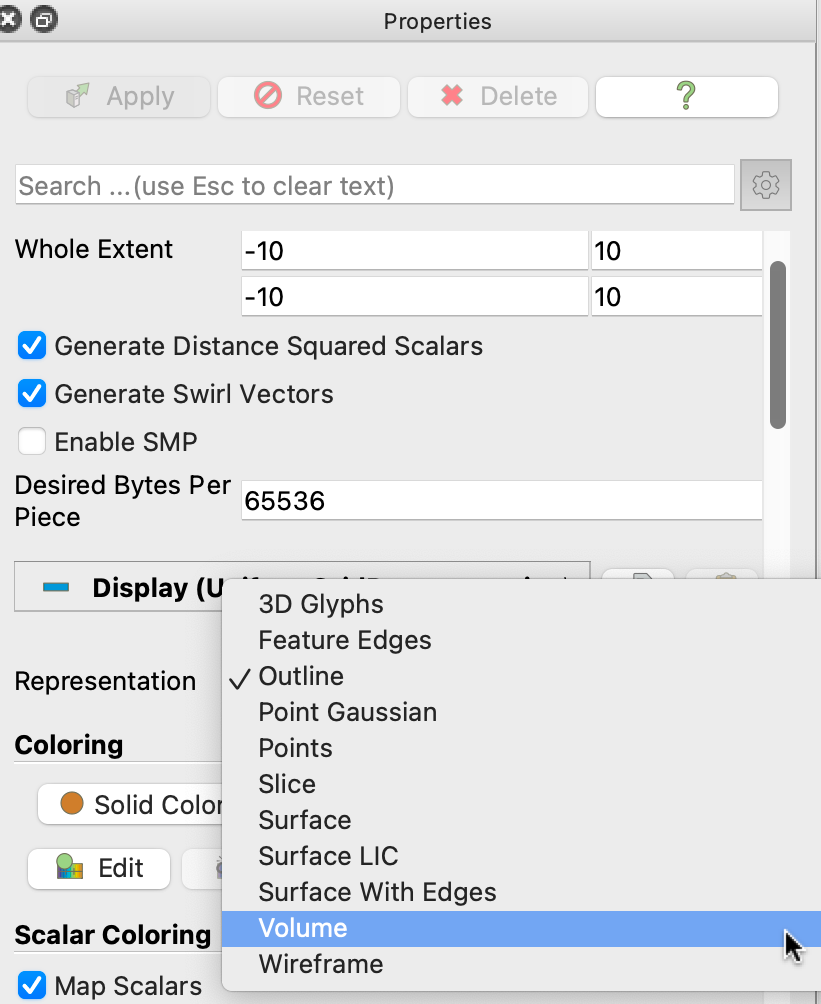
Change the representation to Volume. You should get an image somewhat like you posted in the second image.
For more background, see [this part](https://docs.paraview.org/en/latest/Tutorials/SelfDirectedTutorial/basicUsage.html#volume-rendering) of the self-directed tutorial.
---
### Author:  [@Nemo](https://discourse.paraview.org/u/Nemo)
#### Post date: [August 1, 2024, 2:24am UTC](https://discourse.paraview.org/t/visualize-stress-tensor-in-a-netcdf-format-file/15097/3 "2024-08-01T02:24:20Z")
Thank you so much for your reply. I succeed with your suggestion!