# Visualizing complex vibration modes
**URL:** https://discourse.paraview.org/t/visualizing-complex-vibration-modes/6467
**Category:** ParaView Support
**Created:** [February 15, 2021, 9:26pm UTC](https://discourse.paraview.org/t/visualizing-complex-vibration-modes/6467 "2021-02-15T21:26:18Z")
**Posts on this page:** 11
**Page:** 1
### Author:  [@PetrKryslUCSD](https://discourse.paraview.org/u/PetrKryslUCSD)
#### Post date: [February 15, 2021, 9:26pm UTC](https://discourse.paraview.org/t/visualizing-complex-vibration-modes/6467/1 "2021-02-15T21:26:18Z")
Is it possible to construct an animation of complex vibration modes? Obviously, the actual shape is described by a real field, composed of a real part and an imaginary part of a vector V:
v = ReV_cos(a_t) - ImV_sin(a_t).
Has anyone done this? Got any pointers?
---
### Author:  [@Kenneth\_Moreland](https://discourse.paraview.org/u/Kenneth_Moreland)
#### Post date: [February 15, 2021, 11:19pm UTC](https://discourse.paraview.org/t/visualizing-complex-vibration-modes/6467/2 "2021-02-15T23:19:36Z")
At first I was going to suggest using `Python Calculator`, but due to [a bug I just found](https://gitlab.kitware.com/paraview/paraview/-/issues/20489), I expect that won’t work for you.
Until that’s fixed, you’ll probably have to use the `Programmable Filter`. You can use that to get the real and imaginary fields from your data as well as the current time from the pipeline. From there, you can compute the instant value of the vibration. Here is an example `Script` for the `Programmable Filter`:
```python
real = inputs[0].PointData['Real']
imag = inputs[0].PointData['Imag']
executive = self.GetExecutive()
time_value = executive.GetOutputInformation(0).Get(executive.UPDATE_TIME_STEP())
vibrate = real * cos(6.28 * time_value) - imag * sin(6.28 * time_value)
output.PointData.append(vibrate, 'vibrate')
```
However, that alone won’t do it because you also have to tell the VTK pipeline what time you want. If you don’t, the pipeline won’t give you any time. So, you will need to also set the the `RequestInformation Script` (an advanced property). The following `RequestInformation Script` sets up 100 time steps between time 0 and time 1.
```python
executive = self.GetExecutive()
outInfo = executive.GetOutputInformation(0)
outInfo.Remove(executive.TIME_STEPS())
for i in range(0, 100):
outInfo.Append(executive.TIME_STEPS(), i/100)
outInfo.Remove(executive.TIME_RANGE())
outInfo.Append(executive.TIME_RANGE(), 0)
outInfo.Append(executive.TIME_RANGE(), 1)
```
Here is an example state file that creates some fabricated data with real and imaginary components and then applies a `Programmable Filter` to animate the vibration: [vibration-animation-example.pvsm](https://discourse.paraview.org/uploads/short-url/lRBsb5RR5xJHuDap06GsawwPyqO.pvsm) (583.1 KB)
---
### Author:  [@PetrKryslUCSD](https://discourse.paraview.org/u/PetrKryslUCSD)
#### Post date: [February 15, 2021, 11:26pm UTC](https://discourse.paraview.org/t/visualizing-complex-vibration-modes/6467/3 "2021-02-15T23:26:11Z")
Many thanks, I will give it a shot.
---
### Author:  [@PetrKryslUCSD](https://discourse.paraview.org/u/PetrKryslUCSD)
#### Post date: [February 16, 2021, 2:43am UTC](https://discourse.paraview.org/t/visualizing-complex-vibration-modes/6467/4 "2021-02-16T02:43:30Z")
> [@Kenneth\_Moreland](#):
>
> ```auto
> executive = self.GetExecutive()
> outInfo = executive.GetOutputInformation(0)
>
> outInfo.Remove(executive.TIME_STEPS())
> for i in range(0, 100):
> outInfo.Append(executive.TIME_STEPS(), i/100)
>
> outInfo.Remove(executive.TIME_RANGE())
> outInfo.Append(executive.TIME_RANGE(), 0)
> outInfo.Append(executive.TIME_RANGE(), 1)
>
> ```
Where do I find this `RequestInformation` script text box? I don’t see where to input this.
---
### Author:  [@Kenneth\_Moreland](https://discourse.paraview.org/u/Kenneth_Moreland)
#### Post date: [February 16, 2021, 2:15pm UTC](https://discourse.paraview.org/t/visualizing-complex-vibration-modes/6467/5 "2021-02-16T14:15:49Z")
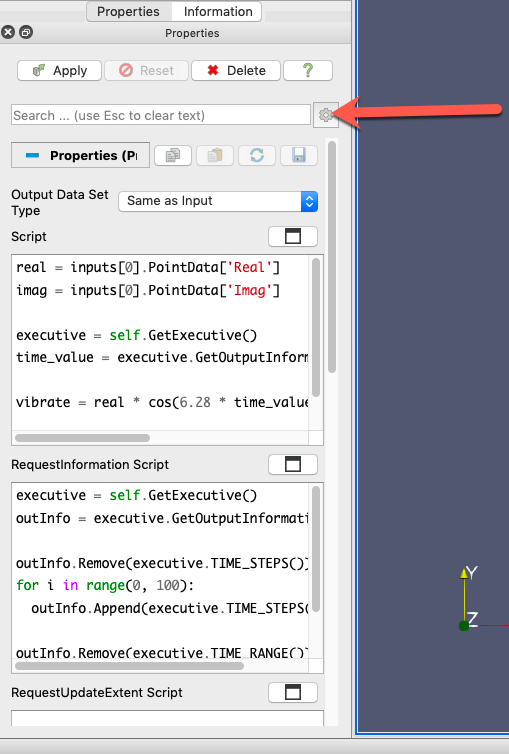
Press the `Toggle Advanced Properties` button and the `RequestInformation Script` text box will appear after the main `Script` box.
---
### Author:  [@PetrKryslUCSD](https://discourse.paraview.org/u/PetrKryslUCSD)
#### Post date: [February 16, 2021, 3:07pm UTC](https://discourse.paraview.org/t/visualizing-complex-vibration-modes/6467/6 "2021-02-16T15:07:35Z")
Many thanks, I realize it was an embarrassing question. 🙂 But in all my years of using paraview I’ve never once needed advanced properties, and I had no idea what the gear was for.
I have it now set up like this:
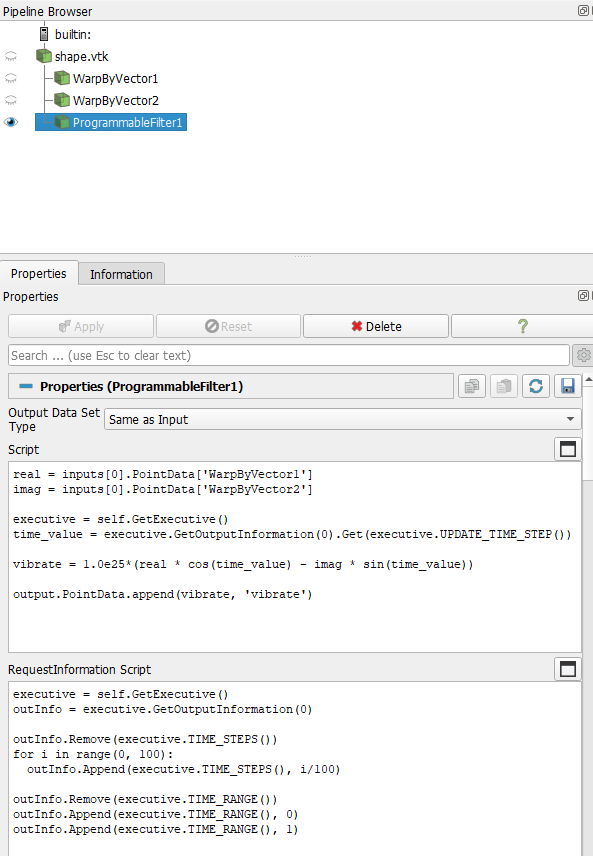
There is no error, but there is no change in shape either.
Shape.vtk has 2 point-data sets, one for the real part of the vector field, and one for the imaginary part.
---
### Author:  [@Kenneth\_Moreland](https://discourse.paraview.org/u/Kenneth_Moreland)
#### Post date: [February 16, 2021, 3:14pm UTC](https://discourse.paraview.org/t/visualizing-complex-vibration-modes/6467/7 "2021-02-16T15:14:01Z")
The output of this `Programmable Filter` will just create a field named `vibrate` that will change over time. If you want to use the `vibrate` field as displacements to change the shape, you will have to apply the `Warp by Vector` filter.
---
### Author:  [@PetrKryslUCSD](https://discourse.paraview.org/u/PetrKryslUCSD)
#### Post date: [February 16, 2021, 3:20pm UTC](https://discourse.paraview.org/t/visualizing-complex-vibration-modes/6467/8 "2021-02-16T15:20:30Z")
Perfect. That makes sense. Thanks!
---
### Author:  [@PetrKryslUCSD](https://discourse.paraview.org/u/PetrKryslUCSD)
#### Post date: [February 16, 2021, 3:50pm UTC](https://discourse.paraview.org/t/visualizing-complex-vibration-modes/6467/9 "2021-02-16T15:50:55Z")
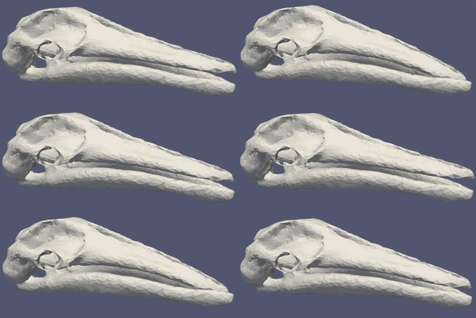
Many thanks for your help!
---
### Author:  [@Kenneth\_Moreland](https://discourse.paraview.org/u/Kenneth_Moreland)
#### Post date: [February 16, 2021, 3:52pm UTC](https://discourse.paraview.org/t/visualizing-complex-vibration-modes/6467/10 "2021-02-16T15:52:13Z")
Neat! I’m glad it worked.
---
### Author:  [@rvelseg](https://discourse.paraview.org/u/rvelseg)
#### Post date: [April 29, 2022, 5:42pm UTC](https://discourse.paraview.org/t/visualizing-complex-vibration-modes/6467/11 "2022-04-29T17:42:27Z")
Thank you so much for this discussion, and the code.
I want to do something similar. However, I want it to work as a “representation”, like the one described in the following link:
[https://www.kitware.com/new-animated-stream-lines-representation-for-paraview-5-3/](https://www.kitware.com/new-animated-stream-lines-representation-for-paraview-5-3/)
I’ve been reading, and I’m thinking on doing the following:
- pull the docker image `kitware/paraview`
- compile paraview within a container using this image
- following [this documentation](https://www.paraview.org/Wiki/ParaView/Plugin_HowTo) modify the example “Examples/Plugins/Representation”
- compile the example
Am I in the right track?
The reason for doing this is to animate the acoustic fields [here](https://gitlab.com/cfd-pizca/hef-acoustics/-/blob/master/doc/details/list_of_acoustics_systems.md)
Thank you, again.