# Visualizing electric fields of Plasma Simulation
**URL:** https://discourse.paraview.org/t/visualizing-electric-fields-of-plasma-simulation/16803
**Category:** ParaView Support
**Created:** [June 12, 2025, 11:07am UTC](https://discourse.paraview.org/t/visualizing-electric-fields-of-plasma-simulation/16803 "2025-06-12T11:07:36Z")
**Posts on this page:** 16
**Page:** 1
### Author:  [@Bortus](https://discourse.paraview.org/u/Bortus)
#### Post date: [June 12, 2025, 11:07am UTC](https://discourse.paraview.org/t/visualizing-electric-fields-of-plasma-simulation/16803/1 "2025-06-12T11:07:36Z")
Hello.
I am working on understanding the example DBD Simulation from the project called “SOMAFOAM”. The project is based on foam-extend-4.0. The example that I am running is called “ArgonDB”, the link for the same is: [SOMAFOAM/examples/plasmaDielectric/ArgonDBD at main · vayyaswamy/SOMAFOAM · GitHub](https://github.com/vayyaswamy/SOMAFOAM/tree/main/examples/plasmaDielectric/ArgonDBD)
Goal:
I want to visualize the electric field generated around the edges of the electrodes, when the plasma is generated.
Problem:
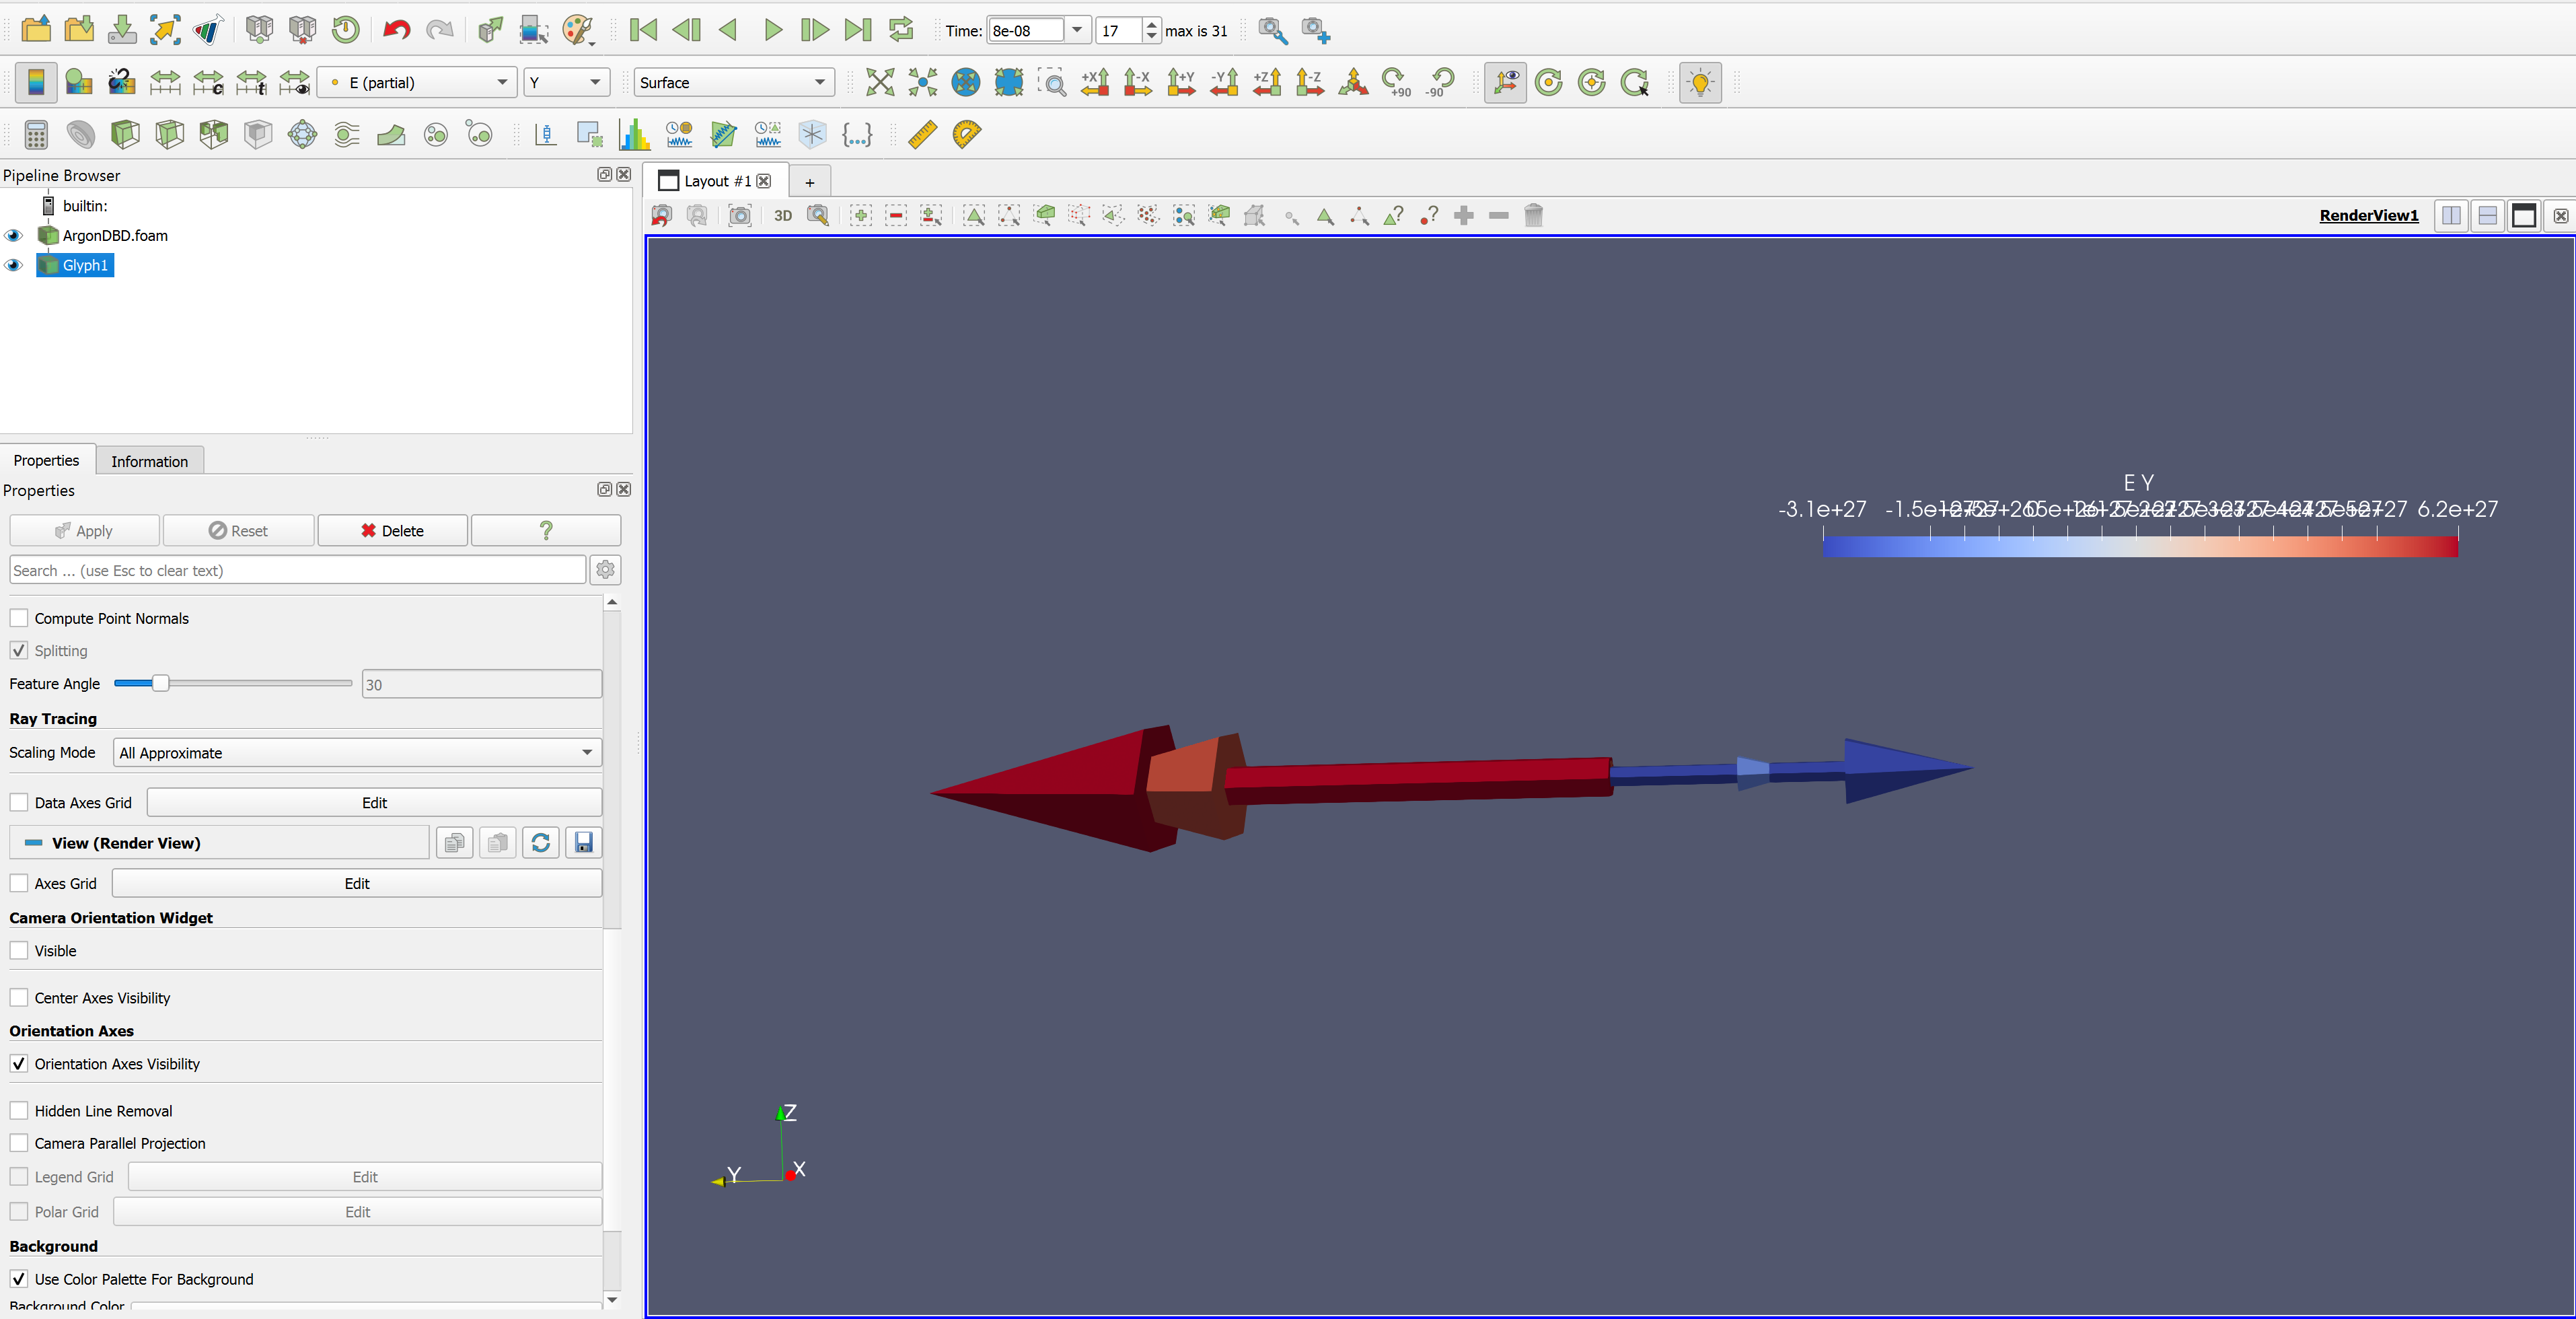
I tried using the Glyph filter, but instead of getting a field, I get single arrows coming out from the sides. I am relatively new to this domain, and I have little idea on what is going on.
If it matters, my setup is:
Ubuntu 18.04 on WSL. I run the command blockMesh and somaFoam (the solver), and it runs the simulation. Once the simulation is run, the \*.foam file is opened in ParaView 5.13.3 (on Windows).
Help Needed:
How can I visualize the electric fields better?
---
### Author:  [@mwestphal](https://discourse.paraview.org/u/mwestphal)
#### Post date: [June 12, 2025, 11:31am UTC](https://discourse.paraview.org/t/visualizing-electric-fields-of-plasma-simulation/16803/2 "2025-06-12T11:31:49Z")
You probably want to reduce the scaling, you currently have very big arrows.
---
### Author:  [@Bortus](https://discourse.paraview.org/u/Bortus)
#### Post date: [June 12, 2025, 11:40am UTC](https://discourse.paraview.org/t/visualizing-electric-fields-of-plasma-simulation/16803/3 "2025-06-12T11:40:08Z")
Hello. Thank you for responding.
I did play with the scale factor. The current (not in the picture) Scale Factor is: 0.00000000000001.
The problem is, I expect to see fields, but instead, it shows just two arrows, as shown in the image. I think my method to visualize the electric field is incorrect.
---
### Author:  [@mwestphal](https://discourse.paraview.org/u/mwestphal)
#### Post date: [June 12, 2025, 11:40am UTC](https://discourse.paraview.org/t/visualizing-electric-fields-of-plasma-simulation/16803/4 "2025-06-12T11:40:39Z")
Please share your data
---
### Author:  [@Bortus](https://discourse.paraview.org/u/Bortus)
#### Post date: [June 12, 2025, 11:42am UTC](https://discourse.paraview.org/t/visualizing-electric-fields-of-plasma-simulation/16803/5 "2025-06-12T11:42:16Z")
I am very sorry, but I am not sure if I follow.
Do you want me to share the _.vtk files? The file that I have imported in ParaView is "_.foam" file.
Again, I am very sorry for not following.
---
### Author:  [@mwestphal](https://discourse.paraview.org/u/mwestphal)
#### Post date: [June 12, 2025, 11:44am UTC](https://discourse.paraview.org/t/visualizing-electric-fields-of-plasma-simulation/16803/6 "2025-06-12T11:44:27Z")
> [@Bortus](#):
>
> _The file that I have imported in ParaView is "_.foam" file.
Then zip the whole folder containing the .foam file and share it using wetransfer or similar.
---
### Author:  [@Bortus](https://discourse.paraview.org/u/Bortus)
#### Post date: [June 12, 2025, 11:48am UTC](https://discourse.paraview.org/t/visualizing-electric-fields-of-plasma-simulation/16803/7 "2025-06-12T11:48:29Z")
Here: [Unique Download Link | WeTransfer](https://we.tl/t-MxTfGuvNZm)
Thanks a lot for your support.
---
### Author:  [@mwestphal](https://discourse.paraview.org/u/mwestphal)
#### Post date: [June 12, 2025, 12:02pm UTC](https://discourse.paraview.org/t/visualizing-electric-fields-of-plasma-simulation/16803/8 "2025-06-12T12:02:02Z")
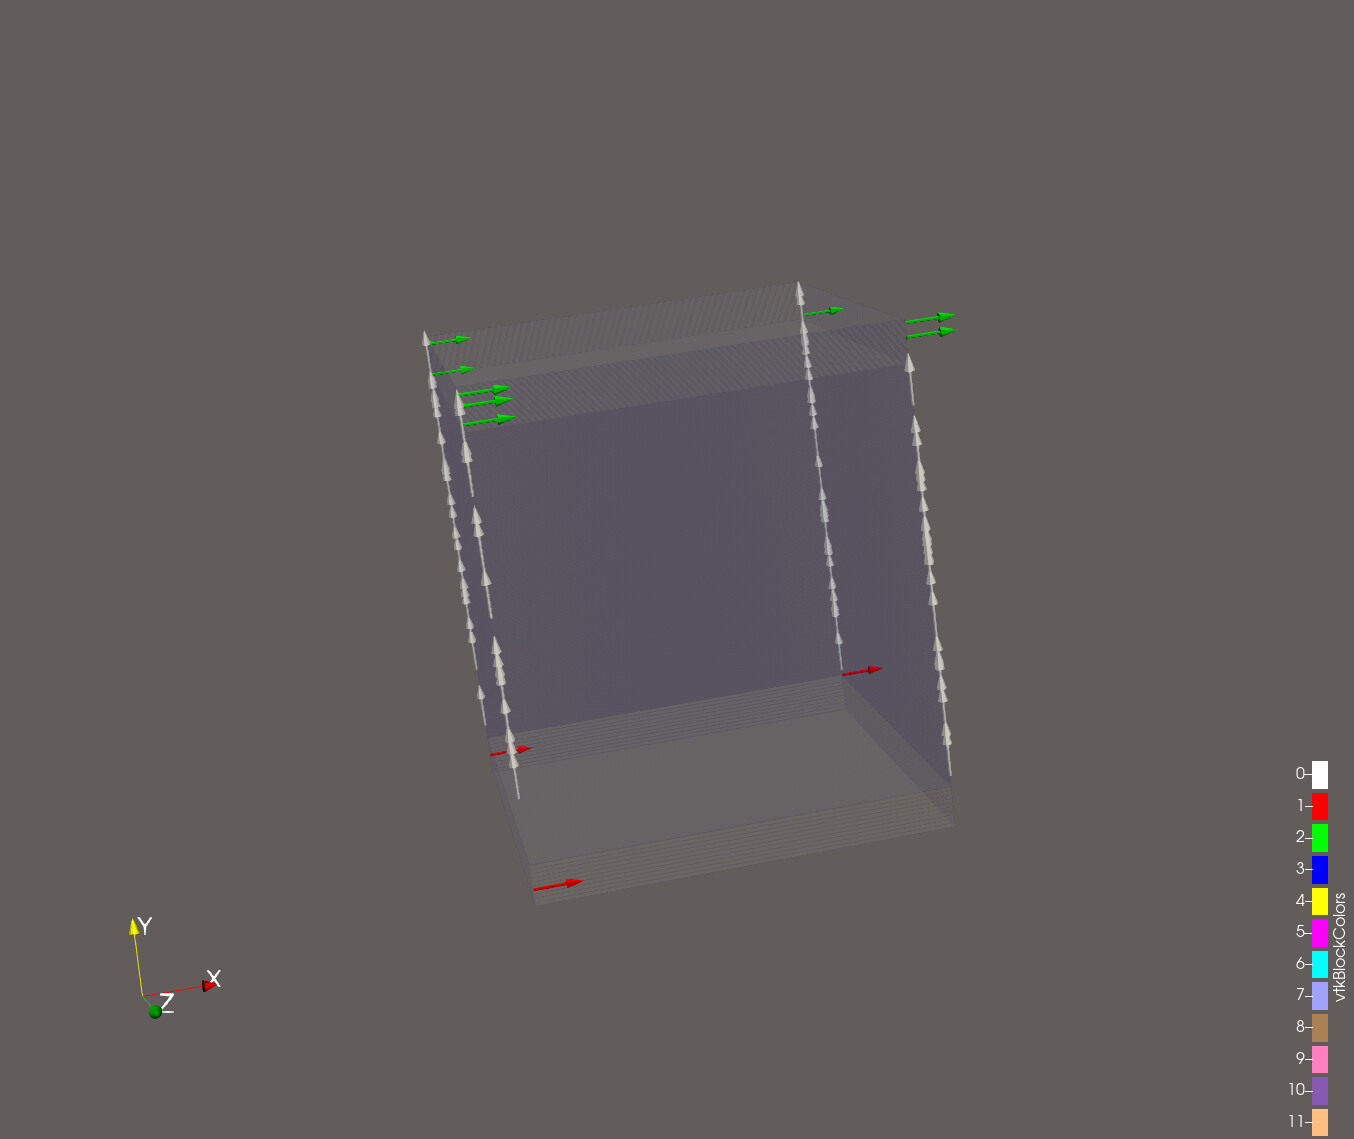
You mesh contain very elongated cells in the Z and X direction, there is not much data to draw glyphs from:
---
### Author:  [@Bortus](https://discourse.paraview.org/u/Bortus)
#### Post date: [June 12, 2025, 12:49pm UTC](https://discourse.paraview.org/t/visualizing-electric-fields-of-plasma-simulation/16803/9 "2025-06-12T12:49:07Z")
Thank you for the efforts.
How did you manage to get this view?
Also, is there another filter that I can use to visualize the electric fields?
---
### Author:  [@mwestphal](https://discourse.paraview.org/u/mwestphal)
#### Post date: [June 12, 2025, 12:50pm UTC](https://discourse.paraview.org/t/visualizing-electric-fields-of-plasma-simulation/16803/10 "2025-06-12T12:50:58Z")
> [@Bortus](#):
>
> How did you manage to get this view?
CellDataToPointData + Glyph
> Also, is there another filter that I can use to visualize the electric fields?
As I said, there is no data to visualize apart the few elongated cells.
---
### Author:  [@Bortus](https://discourse.paraview.org/u/Bortus)
#### Post date: [June 12, 2025, 1:56pm UTC](https://discourse.paraview.org/t/visualizing-electric-fields-of-plasma-simulation/16803/11 "2025-06-12T13:56:48Z")
> [@mwestphal](#):
>
> CellDataToPointData + Glyph
I will have to learn how to do that. Can you please tell me which file you used to get that image?
> [@mwestphal](#):
>
> As I said, there is no data to visualize apart the few elongated cells.
I believe more data around the edges should exist at Time #17 (8e-08). We run the simulation and after few micro or milli seconds, the voltage field is generated.
---
### Author:  [@Kenichiro-Yoshimi](https://discourse.paraview.org/u/Kenichiro-Yoshimi)
#### Post date: [June 12, 2025, 2:30pm UTC](https://discourse.paraview.org/t/visualizing-electric-fields-of-plasma-simulation/16803/12 "2025-06-12T14:30:42Z")
Isn’t it possible that this analysis is being performed with a **1D analysis model**? For example, the following link also describes a 1D analysis:
> **[models.plasma.argon\_dbd\_1d.pdf](https://cds.comsol.com/model/download/186245/models.plasma.argon_dbd_1d.pdf? __gda__ =1749741532_7cac2e8211d45020353378183c2b60f1&fileExt=.pdf)**
>
> 1372.01 KB
While OpenFOAM primarily handles 3D models, when you want to perform a 1D simulation, **“empty” boundary conditions** are applied to two dimensions, leaving only one dimension active for calculation. In fact, in this example, the `type` keyword for `otherfaces` within the `boundary` file in the `processor0\constant\polyMesh` directory is set to `empty`.
---
### Author:  [@Bortus](https://discourse.paraview.org/u/Bortus)
#### Post date: [June 13, 2025, 7:45am UTC](https://discourse.paraview.org/t/visualizing-electric-fields-of-plasma-simulation/16803/13 "2025-06-13T07:45:00Z")
Thank you so much for sharing this PDF.
If I understand your comment well, are you saying that my example is already “good enough” for a 1-D visualization? And I should be able to achieve what I want to? i.e., I should be able to see the electric field from the edge of the electrode when plasma is generated by selecting appropriate filters?
---
### Author:  [@Kenichiro-Yoshimi](https://discourse.paraview.org/u/Kenichiro-Yoshimi)
#### Post date: [June 13, 2025, 9:45am UTC](https://discourse.paraview.org/t/visualizing-electric-fields-of-plasma-simulation/16803/14 "2025-06-13T09:45:25Z")
I’m not sure how to best display a suitable figure for observing plasma generation, but perhaps a procedure like the following could work:
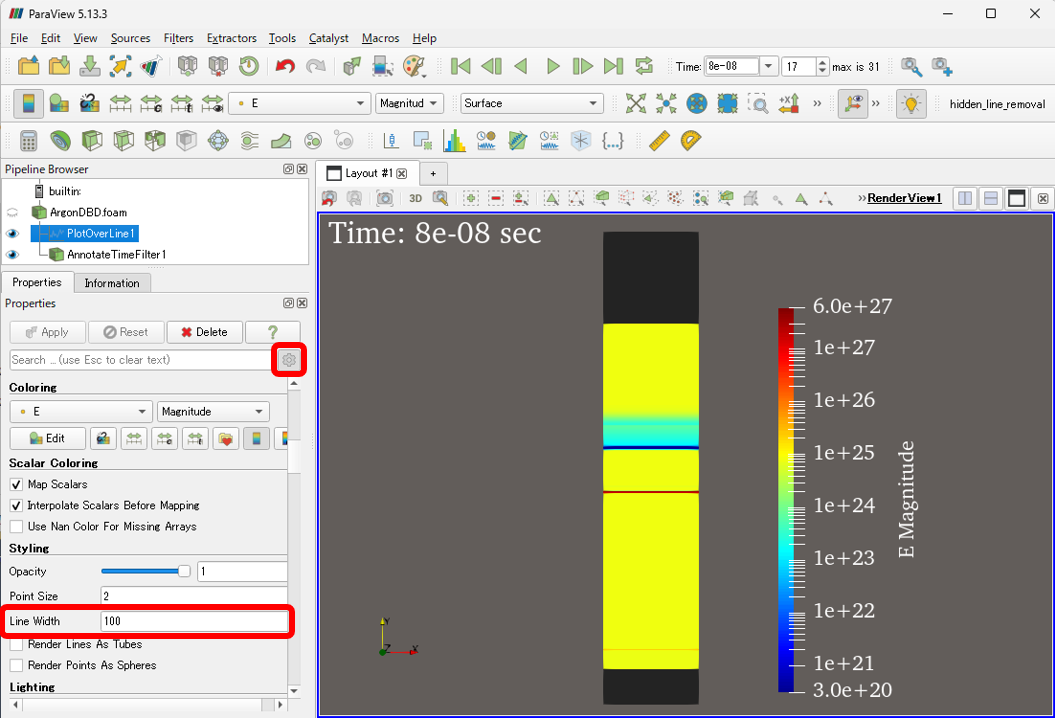
- In the **Plot Over Line** filter, click the **Y Axis** button to map values along a line on the Y-axis.
- In the **Advanced Settings** (turn on the gear icon), set a large value for **Line Width**.
- For example, display a contour plot of the electric field ( **E** ) at 8e-8 seconds.
state file:
[line\_width.pvsm](https://discourse.paraview.org/uploads/short-url/gpHwz4THBUaUR6vpNNhNQgvMbwv.pvsm) (392.8 KB)
---
### Author:  [@Bortus](https://discourse.paraview.org/u/Bortus)
#### Post date: [June 16, 2025, 9:20am UTC](https://discourse.paraview.org/t/visualizing-electric-fields-of-plasma-simulation/16803/15 "2025-06-16T09:20:36Z")
Thank you so much for the efforts. Please excuse me for asking some basic questions. I am extremely new to this tool and the technology.
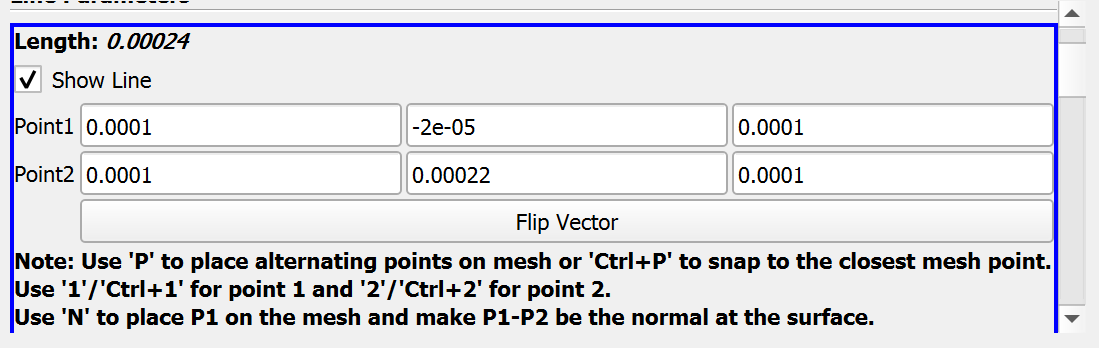
1. How did you figure out the values required for the field “Line Parameters”? I am given to understand that it is the most important part for viewing this plot. My previous attempts had been unsuccessful because I could not figure out the right values for this field.
2. How do I know if the visuals are from the edge of the electrode?
---
### Author:  [@Kenichiro-Yoshimi](https://discourse.paraview.org/u/Kenichiro-Yoshimi)
#### Post date: [June 16, 2025, 1:02pm UTC](https://discourse.paraview.org/t/visualizing-electric-fields-of-plasma-simulation/16803/16 "2025-06-16T13:02:15Z")
1. I clicked the “ **Y Axis** ” button without specifically considering the start and end points of the line.
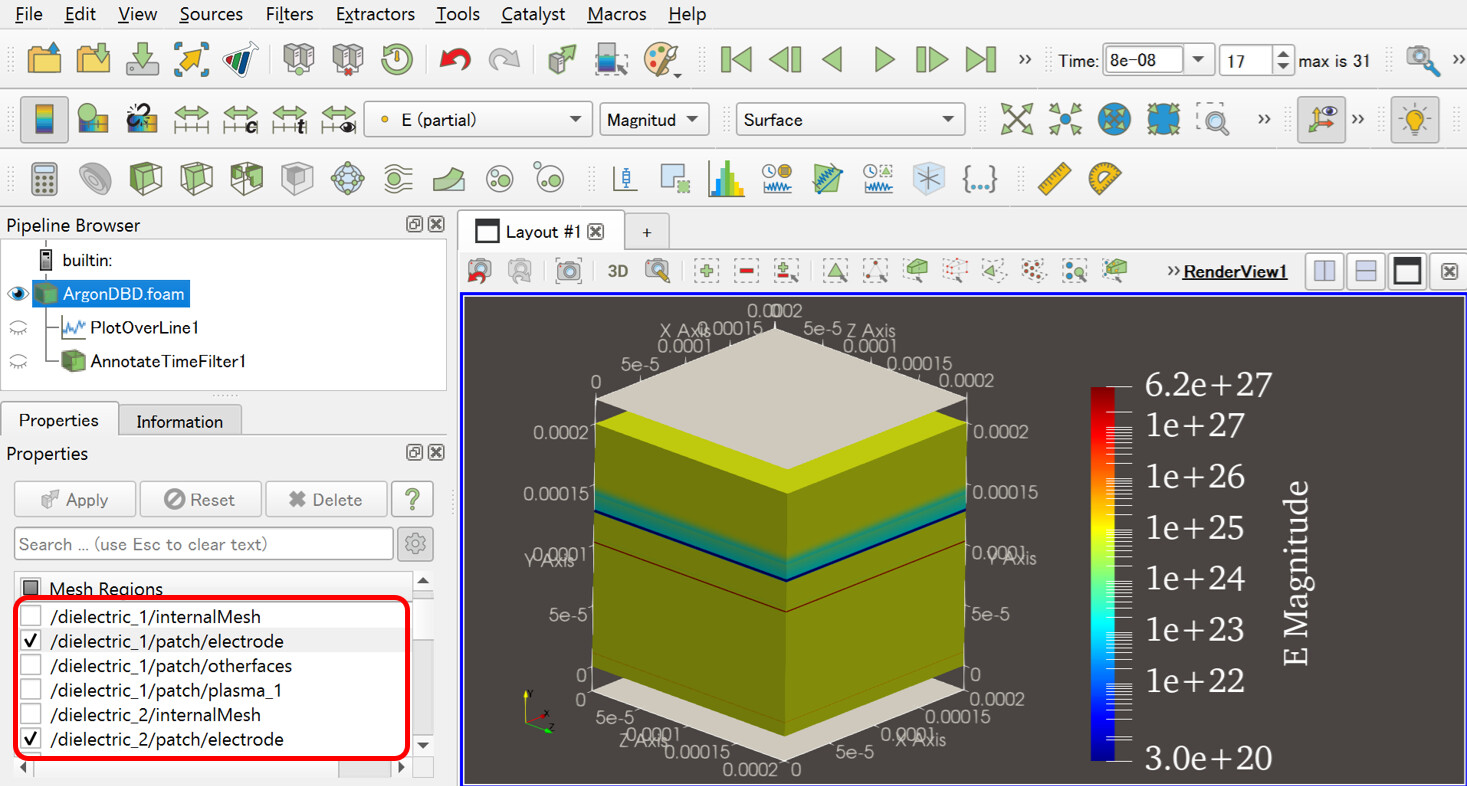
2. If you mean you want to set the Y-coordinates of the electrode as the start and end points of the line, you can find the Y-coordinates using the following method:
2.1. In the **OpenFOAM Reader** settings, check both `/dielectric_1/patch/electrode` and `/dielectric_2/patch/electrode` and load them.
2.2. You can then find the coordinates using tools like “ **Hover Points On** ” in the selection tools.
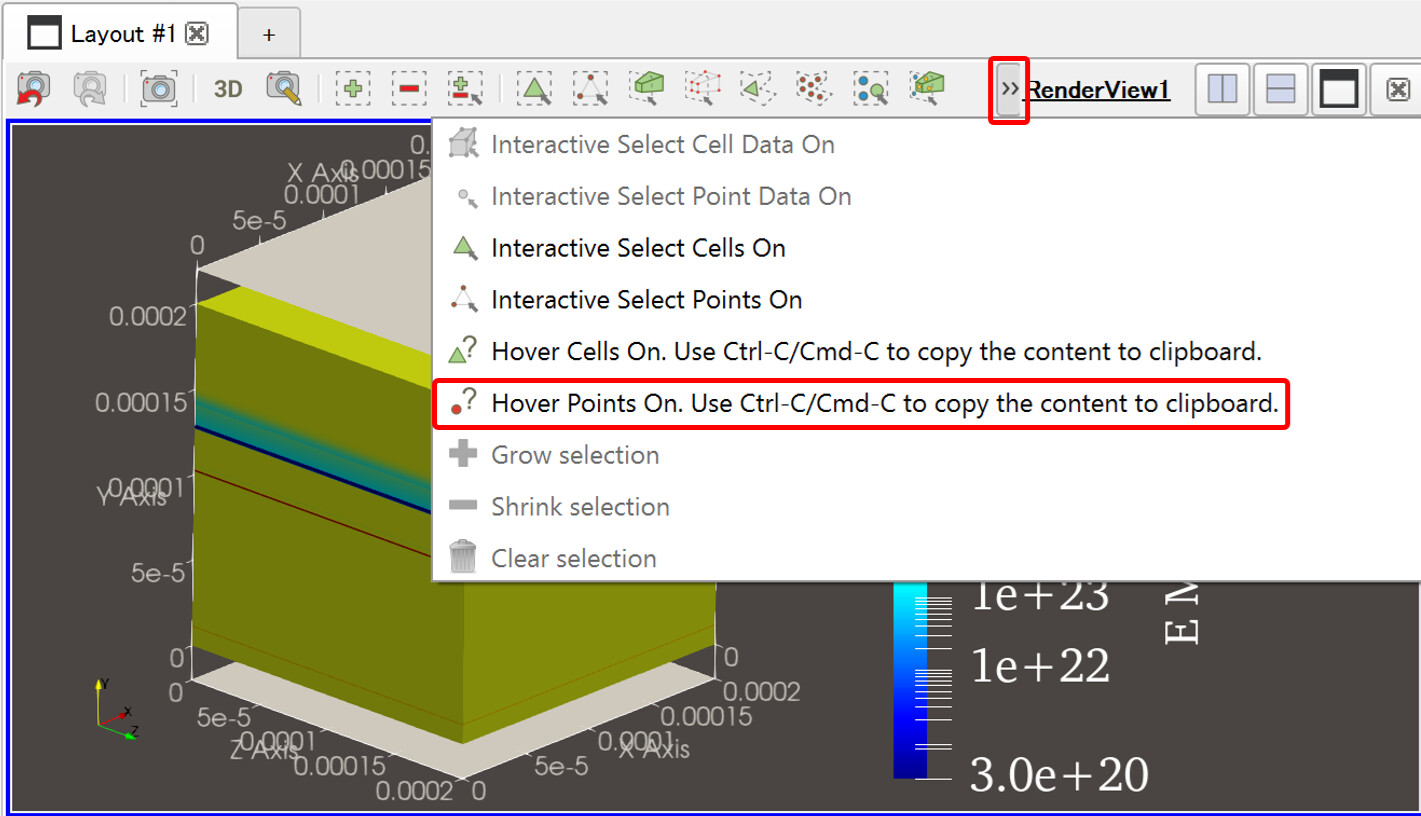
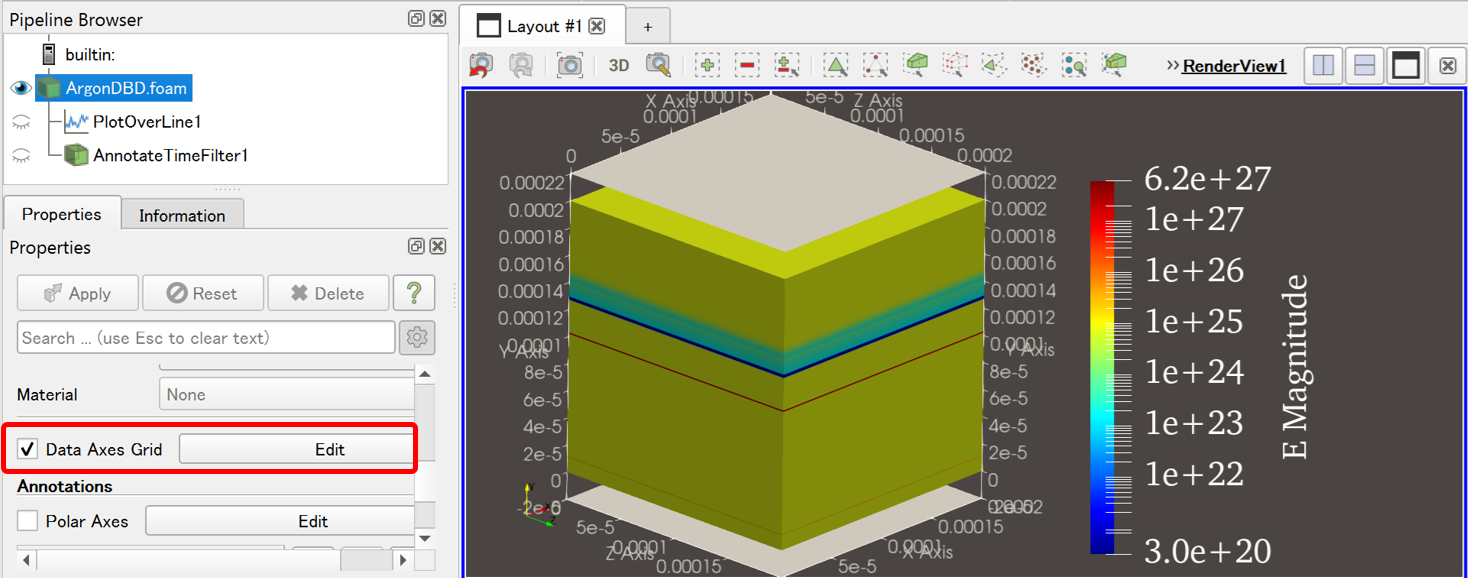
Alternatively, you can check the “ **Data Axes Grid** ” option in the **Properties** tab.